


stevecarufel_
@stevecarufel.bsky.social
Mostly here for charts and maps 💁📊 especially about weather and space
Montréal ⚜️🌹🌲🌷☘️
stevecarufel.com (needs an update)
github.com/datacarvel
Montréal ⚜️🌹🌲🌷☘️
stevecarufel.com (needs an update)
github.com/datacarvel
Gigantic blaze in the #Etosha National Park and around in #Namibia as seen from above
Burnt area was estimated at nearly 1M hectares 2 days ago. That's more than all the fires in British Columbia this year 😳
Fortunately, it didn't grow much since then and appears to be contained
#wildfire #Africa
Burnt area was estimated at nearly 1M hectares 2 days ago. That's more than all the fires in British Columbia this year 😳
Fortunately, it didn't grow much since then and appears to be contained
#wildfire #Africa
September 30, 2025 at 3:15 PM
So it's #TidyTuesday and we're looking at US retail #gasoline and #diesel prices of the last 30 years
#rstats #dataviz ⛽ 🚗🚛
#rstats #dataviz ⛽ 🚗🚛

July 2, 2025 at 12:35 AM
So it's #TidyTuesday and we're looking at US retail #gasoline and #diesel prices of the last 30 years
#rstats #dataviz ⛽ 🚗🚛
#rstats #dataviz ⛽ 🚗🚛

June 26, 2025 at 8:53 PM

Played with #Rstats and {rayshader} to make this #Quebec population density map, thanks to a tutorial by @milos-makes-maps.bsky.social ✌️⚜️
Code 👉 github.com/datacarvel/q...
Code 👉 github.com/datacarvel/q...

May 31, 2025 at 3:40 PM
Played with #Rstats and {rayshader} to make this #Quebec population density map, thanks to a tutorial by @milos-makes-maps.bsky.social ✌️⚜️
Code 👉 github.com/datacarvel/q...
Code 👉 github.com/datacarvel/q...
A lake just... completely drained in Northern #Quebec, in a matter of days. Lake Rouge, ~70km SW of Chapais.
Still a mystery, but it seems that a small natural dam has burst and all the water escaped.
Sentinel-1 | Copernicus Programme | EU | SentinelHub
Still a mystery, but it seems that a small natural dam has burst and all the water escaped.
Sentinel-1 | Copernicus Programme | EU | SentinelHub
May 26, 2025 at 5:14 PM
A lake just... completely drained in Northern #Quebec, in a matter of days. Lake Rouge, ~70km SW of Chapais.
Still a mystery, but it seems that a small natural dam has burst and all the water escaped.
Sentinel-1 | Copernicus Programme | EU | SentinelHub
Still a mystery, but it seems that a small natural dam has burst and all the water escaped.
Sentinel-1 | Copernicus Programme | EU | SentinelHub
#TidyTuesday
1000+ grants of scientific research from the NIH and NSF were terminated under the current Trump admin.
I compared their abstract against that list of 350+ banned words from federal sites and docs, with incendiary terms like "peanut allergies", "women" and "water quality".
#rstats
1000+ grants of scientific research from the NIH and NSF were terminated under the current Trump admin.
I compared their abstract against that list of 350+ banned words from federal sites and docs, with incendiary terms like "peanut allergies", "women" and "water quality".
#rstats

May 7, 2025 at 3:01 AM
#TidyTuesday
1000+ grants of scientific research from the NIH and NSF were terminated under the current Trump admin.
I compared their abstract against that list of 350+ banned words from federal sites and docs, with incendiary terms like "peanut allergies", "women" and "water quality".
#rstats
1000+ grants of scientific research from the NIH and NSF were terminated under the current Trump admin.
I compared their abstract against that list of 350+ banned words from federal sites and docs, with incendiary terms like "peanut allergies", "women" and "water quality".
#rstats
Reposted by stevecarufel_

📊 #SWDchallenge – MAY 2025 | compare human and machine
.
Transformed disaster death data into ridgeline plots revealing hidden patterns across seven decades.
.
🔗:
stevenponce.netlify.app/data_visuali...
.
#SWDchallenge | #dataviz | #rstats | #ggplot2
.
Transformed disaster death data into ridgeline plots revealing hidden patterns across seven decades.
.
🔗:
stevenponce.netlify.app/data_visuali...
.
#SWDchallenge | #dataviz | #rstats | #ggplot2

May 2, 2025 at 1:32 PM
📊 #SWDchallenge – MAY 2025 | compare human and machine
.
Transformed disaster death data into ridgeline plots revealing hidden patterns across seven decades.
.
🔗:
stevenponce.netlify.app/data_visuali...
.
#SWDchallenge | #dataviz | #rstats | #ggplot2
.
Transformed disaster death data into ridgeline plots revealing hidden patterns across seven decades.
.
🔗:
stevenponce.netlify.app/data_visuali...
.
#SWDchallenge | #dataviz | #rstats | #ggplot2
#30DayChartChallenge Day 30 : NetGeo Theme Day
[war horn in the distance]
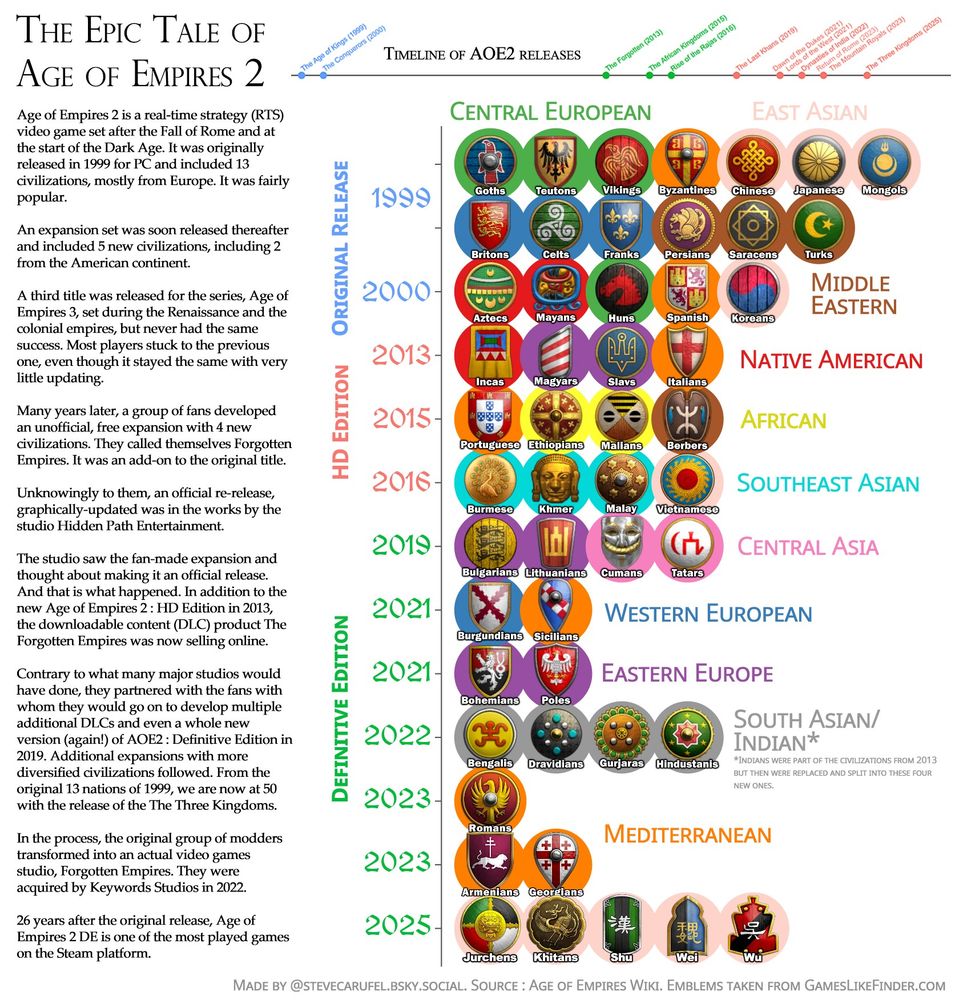
The story of #AgeOfEmpires2 since its original 1999 release and all the available civilizations to play with and attack others, group by region and version.
#rstats #videogames
[war horn in the distance]
The story of #AgeOfEmpires2 since its original 1999 release and all the available civilizations to play with and attack others, group by region and version.
#rstats #videogames
May 1, 2025 at 6:58 AM
#30DayChartChallenge Day 30 : NetGeo Theme Day
[war horn in the distance]
The story of #AgeOfEmpires2 since its original 1999 release and all the available civilizations to play with and attack others, group by region and version.
#rstats #videogames
[war horn in the distance]
The story of #AgeOfEmpires2 since its original 1999 release and all the available civilizations to play with and attack others, group by region and version.
#rstats #videogames
#30DayChallenge Day 29 : Extraterrestrial
Here are the distances from Earth to other planets over time
Hardly useful, really just neat waveforms 〰️🪐〰️
Maybe I'll create a #synth patch with these someday 🎹🎛️👀
#space #Jupiter #Saturn #SolarSystem
Here are the distances from Earth to other planets over time
Hardly useful, really just neat waveforms 〰️🪐〰️
Maybe I'll create a #synth patch with these someday 🎹🎛️👀
#space #Jupiter #Saturn #SolarSystem

April 30, 2025 at 2:32 AM
#30DayChallenge Day 29 : Extraterrestrial
Here are the distances from Earth to other planets over time
Hardly useful, really just neat waveforms 〰️🪐〰️
Maybe I'll create a #synth patch with these someday 🎹🎛️👀
#space #Jupiter #Saturn #SolarSystem
Here are the distances from Earth to other planets over time
Hardly useful, really just neat waveforms 〰️🪐〰️
Maybe I'll create a #synth patch with these someday 🎹🎛️👀
#space #Jupiter #Saturn #SolarSystem
#30DayChartChallenge Day 27 : Noise
Our #Sun 's level of activity since 1749, as indicated by its number of sunspots.
Most coronal mass ejections come from these "colder" areas over the Sun. CMEs provoke the biggest aurora shows when Earth is in their way.
#rstats #space
Our #Sun 's level of activity since 1749, as indicated by its number of sunspots.
Most coronal mass ejections come from these "colder" areas over the Sun. CMEs provoke the biggest aurora shows when Earth is in their way.
#rstats #space

April 28, 2025 at 5:01 AM
#30DayChartChallenge Day 27 : Noise
Our #Sun 's level of activity since 1749, as indicated by its number of sunspots.
Most coronal mass ejections come from these "colder" areas over the Sun. CMEs provoke the biggest aurora shows when Earth is in their way.
#rstats #space
Our #Sun 's level of activity since 1749, as indicated by its number of sunspots.
Most coronal mass ejections come from these "colder" areas over the Sun. CMEs provoke the biggest aurora shows when Earth is in their way.
#rstats #space

April 26, 2025 at 2:34 PM
#30DdayChartChallenge Day 24 : WHO data day
Comparing levels of #depression of the migrant and non-migrant populations across 8 countries of the EU.
Of course, I wish there was more recent data, maybe soon. Past 2019, I'm not sure what we should expect 😐
#rstars #europe #eurostat #mentalhealth
Comparing levels of #depression of the migrant and non-migrant populations across 8 countries of the EU.
Of course, I wish there was more recent data, maybe soon. Past 2019, I'm not sure what we should expect 😐
#rstars #europe #eurostat #mentalhealth

April 25, 2025 at 1:27 PM
#30DdayChartChallenge Day 24 : WHO data day
Comparing levels of #depression of the migrant and non-migrant populations across 8 countries of the EU.
Of course, I wish there was more recent data, maybe soon. Past 2019, I'm not sure what we should expect 😐
#rstars #europe #eurostat #mentalhealth
Comparing levels of #depression of the migrant and non-migrant populations across 8 countries of the EU.
Of course, I wish there was more recent data, maybe soon. Past 2019, I'm not sure what we should expect 😐
#rstars #europe #eurostat #mentalhealth
#30DayChartChallenge Day 23 : logscale
A sequel to Day 4 : Everything that goes up... must go down. Also true for all the things we send to our lower orbit.
All human objects that reentered our atmosphere since 2000.
(not exactly log, but safe to say it will be one very soon 😬)
#rstats #space
A sequel to Day 4 : Everything that goes up... must go down. Also true for all the things we send to our lower orbit.
All human objects that reentered our atmosphere since 2000.
(not exactly log, but safe to say it will be one very soon 😬)
#rstats #space

April 24, 2025 at 3:16 PM
#30DayChartChallenge Day 23 : logscale
A sequel to Day 4 : Everything that goes up... must go down. Also true for all the things we send to our lower orbit.
All human objects that reentered our atmosphere since 2000.
(not exactly log, but safe to say it will be one very soon 😬)
#rstats #space
A sequel to Day 4 : Everything that goes up... must go down. Also true for all the things we send to our lower orbit.
All human objects that reentered our atmosphere since 2000.
(not exactly log, but safe to say it will be one very soon 😬)
#rstats #space
#30DayChartChallenge Day 21 : Fossils
The price of gas at the pump of the last 35 years in constant 2025 $CAD ⛽🚘
It got more expensive, +/- 30%, although it's been impressively steady since 2010 in most cities.
#rstats #canada #climatechange
The price of gas at the pump of the last 35 years in constant 2025 $CAD ⛽🚘
It got more expensive, +/- 30%, although it's been impressively steady since 2010 in most cities.
#rstats #canada #climatechange

April 23, 2025 at 2:45 PM
#30DayChartChallenge Day 21 : Fossils
The price of gas at the pump of the last 35 years in constant 2025 $CAD ⛽🚘
It got more expensive, +/- 30%, although it's been impressively steady since 2010 in most cities.
#rstats #canada #climatechange
The price of gas at the pump of the last 35 years in constant 2025 $CAD ⛽🚘
It got more expensive, +/- 30%, although it's been impressively steady since 2010 in most cities.
#rstats #canada #climatechange
#30DayChartChallenge Day 7 : Outliers
(late submission)
Let me tell you about one hell of a winter.
Note the outlier in this chart on the right 🧐 This story is precisely about it.
#rstats #Quebec #winter #snow #BlancSablon #thread
(late submission)
Let me tell you about one hell of a winter.
Note the outlier in this chart on the right 🧐 This story is precisely about it.
#rstats #Quebec #winter #snow #BlancSablon #thread

April 22, 2025 at 1:18 AM
#30DayChartChallenge Day 7 : Outliers
(late submission)
Let me tell you about one hell of a winter.
Note the outlier in this chart on the right 🧐 This story is precisely about it.
#rstats #Quebec #winter #snow #BlancSablon #thread
(late submission)
Let me tell you about one hell of a winter.
Note the outlier in this chart on the right 🧐 This story is precisely about it.
#rstats #Quebec #winter #snow #BlancSablon #thread
#30DayChartChallenge Day 5 : Ranking
The #PLAYOFFS have begun! 🏒💥🥅👊
This graph shows the standing of the two #StanleyCup Final clubs at the end of the regular season.
Cup Champions are highlighted in gold.
See how far one lagging team can go 👀
#NHL #hockey
#GoHabsGo #Canadiens #Montreal
The #PLAYOFFS have begun! 🏒💥🥅👊
This graph shows the standing of the two #StanleyCup Final clubs at the end of the regular season.
Cup Champions are highlighted in gold.
See how far one lagging team can go 👀
#NHL #hockey
#GoHabsGo #Canadiens #Montreal

April 19, 2025 at 11:13 PM
#30DayChartChallenge Day 5 : Ranking
The #PLAYOFFS have begun! 🏒💥🥅👊
This graph shows the standing of the two #StanleyCup Final clubs at the end of the regular season.
Cup Champions are highlighted in gold.
See how far one lagging team can go 👀
#NHL #hockey
#GoHabsGo #Canadiens #Montreal
The #PLAYOFFS have begun! 🏒💥🥅👊
This graph shows the standing of the two #StanleyCup Final clubs at the end of the regular season.
Cup Champions are highlighted in gold.
See how far one lagging team can go 👀
#NHL #hockey
#GoHabsGo #Canadiens #Montreal

#30DayChartChallenge Day 15 : Complicated
Like the relationship between the Republican Party/Trump and the white working class over the years, a popular narrative that is not so strong.
#rstats
Like the relationship between the Republican Party/Trump and the white working class over the years, a popular narrative that is not so strong.
#rstats

April 16, 2025 at 2:59 AM
#30DayChartChallenge Day 15 : Complicated
Like the relationship between the Republican Party/Trump and the white working class over the years, a popular narrative that is not so strong.
#rstats
Like the relationship between the Republican Party/Trump and the white working class over the years, a popular narrative that is not so strong.
#rstats
#30DayChartChallenge Day 14 : Kinship
This huge ball of colorful hair is populated by all the music genres found on Wikipedia.
Every node/dot is a genre, and every edge/ligne is a genealogical connection.
#Music lovers should go play with it, it's interactive
aquamarine-chaja-6da378.netlify.app
This huge ball of colorful hair is populated by all the music genres found on Wikipedia.
Every node/dot is a genre, and every edge/ligne is a genealogical connection.
#Music lovers should go play with it, it's interactive
aquamarine-chaja-6da378.netlify.app

April 15, 2025 at 7:14 AM
#30DayChartChallenge Day 14 : Kinship
This huge ball of colorful hair is populated by all the music genres found on Wikipedia.
Every node/dot is a genre, and every edge/ligne is a genealogical connection.
#Music lovers should go play with it, it's interactive
aquamarine-chaja-6da378.netlify.app
This huge ball of colorful hair is populated by all the music genres found on Wikipedia.
Every node/dot is a genre, and every edge/ligne is a genealogical connection.
#Music lovers should go play with it, it's interactive
aquamarine-chaja-6da378.netlify.app

#30DayChartChallenge Day 11 : Stripes
Here in #Montreal, nights are officially considered "uncomfortable" when 20 °C (68 °F) or above (too warm)
I know, for most of you this night temp is trival, maybe even ridiculous.
Still, you can see how #climatechange might alter sleep.
#rstats #weather
Here in #Montreal, nights are officially considered "uncomfortable" when 20 °C (68 °F) or above (too warm)
I know, for most of you this night temp is trival, maybe even ridiculous.
Still, you can see how #climatechange might alter sleep.
#rstats #weather

April 12, 2025 at 2:00 AM
#30DayChartChallenge Day 11 : Stripes
Here in #Montreal, nights are officially considered "uncomfortable" when 20 °C (68 °F) or above (too warm)
I know, for most of you this night temp is trival, maybe even ridiculous.
Still, you can see how #climatechange might alter sleep.
#rstats #weather
Here in #Montreal, nights are officially considered "uncomfortable" when 20 °C (68 °F) or above (too warm)
I know, for most of you this night temp is trival, maybe even ridiculous.
Still, you can see how #climatechange might alter sleep.
#rstats #weather
#30DayChartChallenge Day 9 : Multi-modal(ish?)
Age demographics of QC
I used the generation categories as defined by Statistics Canada.
My takeaway here is that boomers are a larger cohort also because... well, the cohort has a larger year of birth range.
#rstats #Canada #Quebec #demographics
Age demographics of QC
I used the generation categories as defined by Statistics Canada.
My takeaway here is that boomers are a larger cohort also because... well, the cohort has a larger year of birth range.
#rstats #Canada #Quebec #demographics

April 11, 2025 at 4:15 AM
#30DayChartChallenge Day 9 : Multi-modal(ish?)
Age demographics of QC
I used the generation categories as defined by Statistics Canada.
My takeaway here is that boomers are a larger cohort also because... well, the cohort has a larger year of birth range.
#rstats #Canada #Quebec #demographics
Age demographics of QC
I used the generation categories as defined by Statistics Canada.
My takeaway here is that boomers are a larger cohort also because... well, the cohort has a larger year of birth range.
#rstats #Canada #Quebec #demographics
