


Sidney Schaberle Goveia
@sidneysgoveia.bsky.social
#QGIS Brasil | #OSGeo Brasil

November 7, 2025 at 10:35 PM
WebGIS com Python e PostGIS
Visualização de dados geográficos usando Python (Github Pages) no frontend e PostgreSQL (Supabase) no backend.
#python #postgis #postgresql #sql #webgis
⚠️ versão sem BD:
*Carregue arquivos GeoJSON e calcule áreas usando Python*
geosaber.github.io/webgis
Visualização de dados geográficos usando Python (Github Pages) no frontend e PostgreSQL (Supabase) no backend.
#python #postgis #postgresql #sql #webgis
⚠️ versão sem BD:
*Carregue arquivos GeoJSON e calcule áreas usando Python*
geosaber.github.io/webgis

November 1, 2025 at 3:08 AM
WebGIS com Python e PostGIS
Visualização de dados geográficos usando Python (Github Pages) no frontend e PostgreSQL (Supabase) no backend.
#python #postgis #postgresql #sql #webgis
⚠️ versão sem BD:
*Carregue arquivos GeoJSON e calcule áreas usando Python*
geosaber.github.io/webgis
Visualização de dados geográficos usando Python (Github Pages) no frontend e PostgreSQL (Supabase) no backend.
#python #postgis #postgresql #sql #webgis
⚠️ versão sem BD:
*Carregue arquivos GeoJSON e calcule áreas usando Python*
geosaber.github.io/webgis
Reposted by Sidney Schaberle Goveia

SNAP 13 is out
Improve SAR geolocation accuracy.
Support for the BIOMASS commissioning phase products and ECOSTRESS Collection 2, improved ICEYE reader, S3 reader and OLCI O2A harmonization. Plus: Naive-Bayes, new Spectral Indices and LERC support.
t.co/mOOnQ6obws
Improve SAR geolocation accuracy.
Support for the BIOMASS commissioning phase products and ECOSTRESS Collection 2, improved ICEYE reader, S3 reader and OLCI O2A harmonization. Plus: Naive-Bayes, new Spectral Indices and LERC support.
t.co/mOOnQ6obws

October 31, 2025 at 1:07 PM
SNAP 13 is out
Improve SAR geolocation accuracy.
Support for the BIOMASS commissioning phase products and ECOSTRESS Collection 2, improved ICEYE reader, S3 reader and OLCI O2A harmonization. Plus: Naive-Bayes, new Spectral Indices and LERC support.
t.co/mOOnQ6obws
Improve SAR geolocation accuracy.
Support for the BIOMASS commissioning phase products and ECOSTRESS Collection 2, improved ICEYE reader, S3 reader and OLCI O2A harmonization. Plus: Naive-Bayes, new Spectral Indices and LERC support.
t.co/mOOnQ6obws
Reposted by Sidney Schaberle Goveia

#30DayMapChallenge starts tomorrow: 30 days, 30 map ideas.
If you’re using R, Python, or Julia, consider sharing open-source examples or tutorials. 🧭
30daymapchallenge.com
#GeoData #DataViz #Maps #SpatialViz
If you’re using R, Python, or Julia, consider sharing open-source examples or tutorials. 🧭
30daymapchallenge.com
#GeoData #DataViz #Maps #SpatialViz

30DayMapChallenge
Daily mapping challenge happening every November!
30daymapchallenge.com
October 31, 2025 at 3:02 PM
#30DayMapChallenge starts tomorrow: 30 days, 30 map ideas.
If you’re using R, Python, or Julia, consider sharing open-source examples or tutorials. 🧭
30daymapchallenge.com
#GeoData #DataViz #Maps #SpatialViz
If you’re using R, Python, or Julia, consider sharing open-source examples or tutorials. 🧭
30daymapchallenge.com
#GeoData #DataViz #Maps #SpatialViz
October 27, 2025 at 4:27 PM
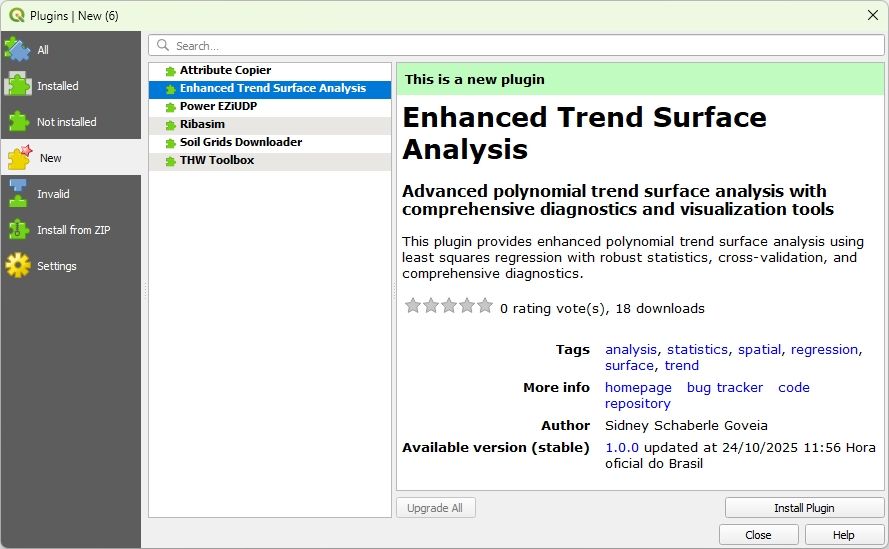
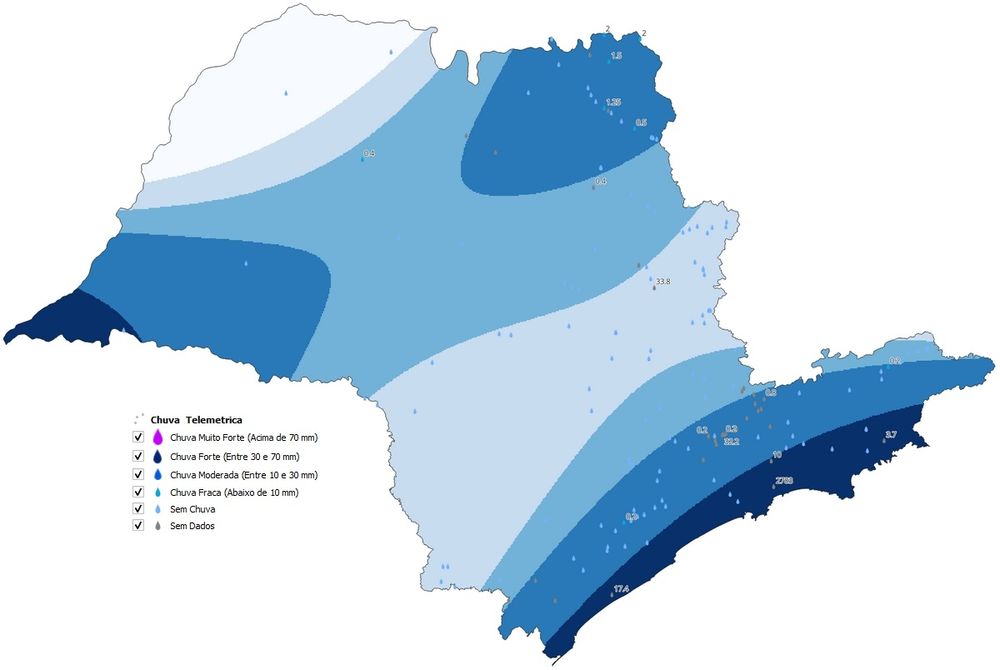
QGIS Processing Toolbox script to generate trend surface from point data
#qgis #trend #interpolation
▫️ Geological trend identification
▫️ Climate pattern analysis
▫️ Pollution gradient mapping
▫️ Temperature surface generation
▫️ Precipitation trend analysis
github.com/geosaber/trendsurf
#qgis #trend #interpolation
▫️ Geological trend identification
▫️ Climate pattern analysis
▫️ Pollution gradient mapping
▫️ Temperature surface generation
▫️ Precipitation trend analysis
github.com/geosaber/trendsurf
October 20, 2025 at 12:45 PM
QGIS Processing Toolbox script to generate trend surface from point data
#qgis #trend #interpolation
▫️ Geological trend identification
▫️ Climate pattern analysis
▫️ Pollution gradient mapping
▫️ Temperature surface generation
▫️ Precipitation trend analysis
github.com/geosaber/trendsurf
#qgis #trend #interpolation
▫️ Geological trend identification
▫️ Climate pattern analysis
▫️ Pollution gradient mapping
▫️ Temperature surface generation
▫️ Precipitation trend analysis
github.com/geosaber/trendsurf
Mapa potenciométrico utilizando R
gstat.geosaber.com.br/potenciometr...
gstat.geosaber.com.br/potenciometr...

May 12, 2025 at 3:15 PM
Mapa potenciométrico utilizando R
gstat.geosaber.com.br/potenciometr...
gstat.geosaber.com.br/potenciometr...


March 19, 2025 at 1:01 AM
Reposted by Sidney Schaberle Goveia
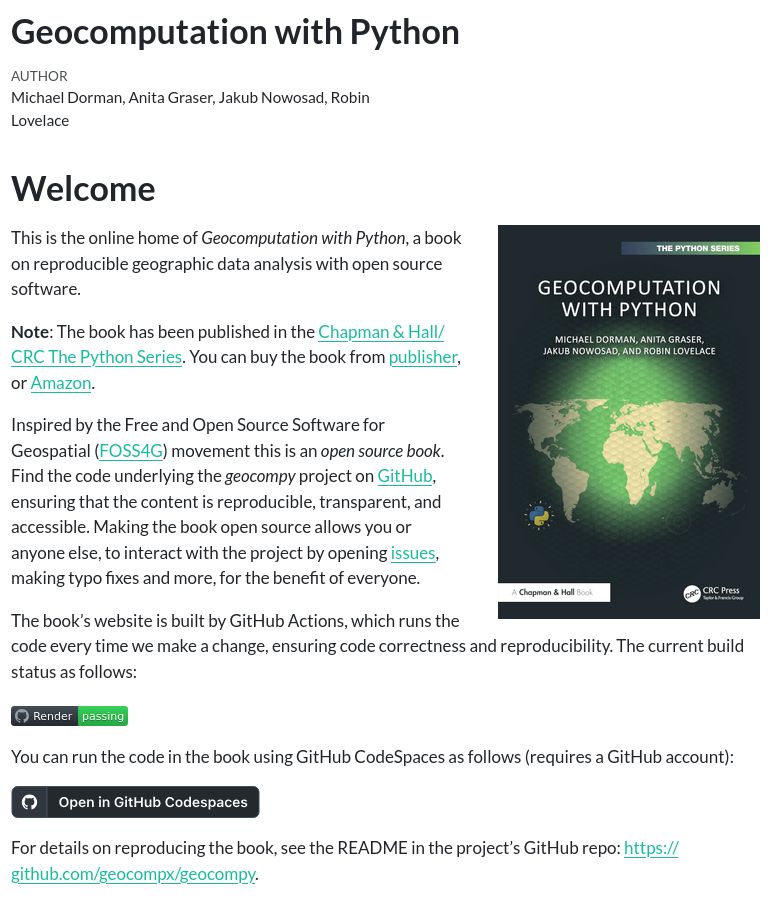
🎉 The "Geocomputation with Python" book has been officially published today!
Dive into the world of spatial analysis and geospatial data with Python. 📖🐍
Book's website: https://buff.ly/3NK2uBq
#geocompx #geopython #spatialanalysis
Dive into the world of spatial analysis and geospatial data with Python. 📖🐍
Book's website: https://buff.ly/3NK2uBq
#geocompx #geopython #spatialanalysis
February 14, 2025 at 9:04 AM
🎉 The "Geocomputation with Python" book has been officially published today!
Dive into the world of spatial analysis and geospatial data with Python. 📖🐍
Book's website: https://buff.ly/3NK2uBq
#geocompx #geopython #spatialanalysis
Dive into the world of spatial analysis and geospatial data with Python. 📖🐍
Book's website: https://buff.ly/3NK2uBq
#geocompx #geopython #spatialanalysis
QGIS Processing Toolbox tool for Variogram Modeling and Ordinary Kriging using GSTools
This tool automates variogram modeling and kriging within QGIS, providing a user-friendly interface for spatial interpolation.
#qgis #geostatistics #kriging #prediction #variogram
github.com/geosaber/geo...
This tool automates variogram modeling and kriging within QGIS, providing a user-friendly interface for spatial interpolation.
#qgis #geostatistics #kriging #prediction #variogram
github.com/geosaber/geo...
GitHub - geosaber/geostat: QGIS Processing Toolbox tool for Variogram Modeling and Ordinary Kriging using GSTools
QGIS Processing Toolbox tool for Variogram Modeling and Ordinary Kriging using GSTools - geosaber/geostat
github.com
February 14, 2025 at 12:44 AM
QGIS Processing Toolbox tool for Variogram Modeling and Ordinary Kriging using GSTools
This tool automates variogram modeling and kriging within QGIS, providing a user-friendly interface for spatial interpolation.
#qgis #geostatistics #kriging #prediction #variogram
github.com/geosaber/geo...
This tool automates variogram modeling and kriging within QGIS, providing a user-friendly interface for spatial interpolation.
#qgis #geostatistics #kriging #prediction #variogram
github.com/geosaber/geo...
Reposted by Sidney Schaberle Goveia

Spatial prediction methods for geostatistical data such as disease prevalence 🪰 precipitation 🌧️ contaminants 🏭 household prices 🏡
🔗 www.paulamoraga.com/book-spatial...
#rstats #rspatial #GISChat
🔗 www.paulamoraga.com/book-spatial...
#rstats #rspatial #GISChat

January 19, 2025 at 4:29 PM
Spatial prediction methods for geostatistical data such as disease prevalence 🪰 precipitation 🌧️ contaminants 🏭 household prices 🏡
🔗 www.paulamoraga.com/book-spatial...
#rstats #rspatial #GISChat
🔗 www.paulamoraga.com/book-spatial...
#rstats #rspatial #GISChat
Reposted by Sidney Schaberle Goveia

The Open Source Geospatial Foundation is pleased to announce the results of its Board of Directors elections 2024. Congratulations to the new @osgeo board of directors. Read our new item https://www.osgeo.org/foundation-news/board-election-2024-results/ #foss4g #osgeo
OSGeo Board Election 2024 results - OSGeo
There were four open seats for the 2024 board in this cycle of the Board of Directors election. The Chief Returning Officers reported that 310 out of 568 Charter members cast their votes for the Board of Directors (54% participation). … Continued
www.osgeo.org
December 22, 2024 at 11:08 AM
The Open Source Geospatial Foundation is pleased to announce the results of its Board of Directors elections 2024. Congratulations to the new @osgeo board of directors. Read our new item https://www.osgeo.org/foundation-news/board-election-2024-results/ #foss4g #osgeo
Reposted by Sidney Schaberle Goveia
The course materials are freely available at GIS OpenCourseWare: courses.gisopencourseware.org/course/view....
December 12, 2024 at 6:27 PM
The course materials are freely available at GIS OpenCourseWare: courses.gisopencourseware.org/course/view....

Reposted by Sidney Schaberle Goveia

Discover the #qgis Model Hub. Share your Graphical Models with the :qgis: community and use the QGIS Hub plugin to add models to the Processing Toolbox. Watch my latest video for more information: https://youtu.be/BgTRC098-Qw.
The example is a model to create Relative Elevation Models (REM). #gis
The example is a model to create Relative Elevation Models (REM). #gis

Submit Graphical Models to the QGIS Model Hub and use them in QGIS
QGIS has a hub for sharing styles, projects, models, 3D models, etc. This video demonstrates how to submit a graphical model to the QGIS Model Hub, how to do...
www.youtube.com
December 3, 2024 at 8:27 PM
Discover the #qgis Model Hub. Share your Graphical Models with the :qgis: community and use the QGIS Hub plugin to add models to the Processing Toolbox. Watch my latest video for more information: https://youtu.be/BgTRC098-Qw.
The example is a model to create Relative Elevation Models (REM). #gis
The example is a model to create Relative Elevation Models (REM). #gis
December 2 marks an important date as ClarkLabs releases TerrSet liberaGIS, the newest version of its geospatial software. In line with efforts to make advanced geospatial tools accessible to all users, TerrSet liberaGIS is now available as a free, open-access platform
www.clarku.edu/centers/geos...
www.clarku.edu/centers/geos...

December 3, 2024 at 1:10 PM
December 2 marks an important date as ClarkLabs releases TerrSet liberaGIS, the newest version of its geospatial software. In line with efforts to make advanced geospatial tools accessible to all users, TerrSet liberaGIS is now available as a free, open-access platform
www.clarku.edu/centers/geos...
www.clarku.edu/centers/geos...

December 2, 2024 at 10:47 PM
#FOSS4G2024
🌤 Weather: average temperatures ranging from 25°C to 32°C. Be prepared for warm and humid days
❄️ All indoor spaces have air conditioning
🔌 Power outlets: Brazil uses type N outlets (sometimes type C), and the voltage in Belém is 127V. Bring an adapter if needed!
2024.foss4g.org
🌤 Weather: average temperatures ranging from 25°C to 32°C. Be prepared for warm and humid days
❄️ All indoor spaces have air conditioning
🔌 Power outlets: Brazil uses type N outlets (sometimes type C), and the voltage in Belém is 127V. Bring an adapter if needed!
2024.foss4g.org

November 27, 2024 at 4:47 PM
#FOSS4G2024
🌤 Weather: average temperatures ranging from 25°C to 32°C. Be prepared for warm and humid days
❄️ All indoor spaces have air conditioning
🔌 Power outlets: Brazil uses type N outlets (sometimes type C), and the voltage in Belém is 127V. Bring an adapter if needed!
2024.foss4g.org
🌤 Weather: average temperatures ranging from 25°C to 32°C. Be prepared for warm and humid days
❄️ All indoor spaces have air conditioning
🔌 Power outlets: Brazil uses type N outlets (sometimes type C), and the voltage in Belém is 127V. Bring an adapter if needed!
2024.foss4g.org
Reposted by Sidney Schaberle Goveia
📚 Spatial Statistics for #datascience w/ #rstats
Chapter 1: Spatial Data Types
🔹 Areal: aggregated number of events (disease counts)
🔹 Geostatistical: observations at known locations (air pollution)
🔹 Point patterns: event locations (fires, trees)
Examples 👉 www.paulamoraga.com/book-spatial...
Chapter 1: Spatial Data Types
🔹 Areal: aggregated number of events (disease counts)
🔹 Geostatistical: observations at known locations (air pollution)
🔹 Point patterns: event locations (fires, trees)
Examples 👉 www.paulamoraga.com/book-spatial...


November 23, 2024 at 4:59 PM
📚 Spatial Statistics for #datascience w/ #rstats
Chapter 1: Spatial Data Types
🔹 Areal: aggregated number of events (disease counts)
🔹 Geostatistical: observations at known locations (air pollution)
🔹 Point patterns: event locations (fires, trees)
Examples 👉 www.paulamoraga.com/book-spatial...
Chapter 1: Spatial Data Types
🔹 Areal: aggregated number of events (disease counts)
🔹 Geostatistical: observations at known locations (air pollution)
🔹 Point patterns: event locations (fires, trees)
Examples 👉 www.paulamoraga.com/book-spatial...


Reposted by Sidney Schaberle Goveia

Happy #PostGISDay, to those who observe.
November 21, 2024 at 12:37 PM
Happy #PostGISDay, to those who observe.