


Rafael Irizarry
@rafalab.bsky.social
Applied statistician. I tweet data-driven observations, data science educational materials, academic research updates, and the occasional joke.
📢 We are taking applications for our Postdoctoral Fellows Program at Harvard/DFCI!
🔹Join a research group in our department
🔹Co-mentoring opportunities with 2+ faculty
🔹Collaborate with investigators beyond our department
🔹Salary starts at $75K
Apply here: t.co/B7SLZzQFKu
🔹Join a research group in our department
🔹Co-mentoring opportunities with 2+ faculty
🔹Collaborate with investigators beyond our department
🔹Salary starts at $75K
Apply here: t.co/B7SLZzQFKu
https://ds.dfci.harvard.edu/postdocs/
t.co
December 1, 2025 at 6:59 PM
📢 We are taking applications for our Postdoctoral Fellows Program at Harvard/DFCI!
🔹Join a research group in our department
🔹Co-mentoring opportunities with 2+ faculty
🔹Collaborate with investigators beyond our department
🔹Salary starts at $75K
Apply here: t.co/B7SLZzQFKu
🔹Join a research group in our department
🔹Co-mentoring opportunities with 2+ faculty
🔹Collaborate with investigators beyond our department
🔹Salary starts at $75K
Apply here: t.co/B7SLZzQFKu
🚨 We're hiring! 🚨
Join us at @HarvardBiostats and @dfcidatascience
We are filling THREE positions:
1️⃣ Tenure-track (any rank) in AI/ML
2️⃣ Assistant Professor in Single Cell Genomics
3️⃣ Lecturer & Director Training/Education
Need to apply separately for each role. Links 👇
Join us at @HarvardBiostats and @dfcidatascience
We are filling THREE positions:
1️⃣ Tenure-track (any rank) in AI/ML
2️⃣ Assistant Professor in Single Cell Genomics
3️⃣ Lecturer & Director Training/Education
Need to apply separately for each role. Links 👇

November 26, 2024 at 3:06 PM
🚨 We're hiring! 🚨
Join us at @HarvardBiostats and @dfcidatascience
We are filling THREE positions:
1️⃣ Tenure-track (any rank) in AI/ML
2️⃣ Assistant Professor in Single Cell Genomics
3️⃣ Lecturer & Director Training/Education
Need to apply separately for each role. Links 👇
Join us at @HarvardBiostats and @dfcidatascience
We are filling THREE positions:
1️⃣ Tenure-track (any rank) in AI/ML
2️⃣ Assistant Professor in Single Cell Genomics
3️⃣ Lecturer & Director Training/Education
Need to apply separately for each role. Links 👇
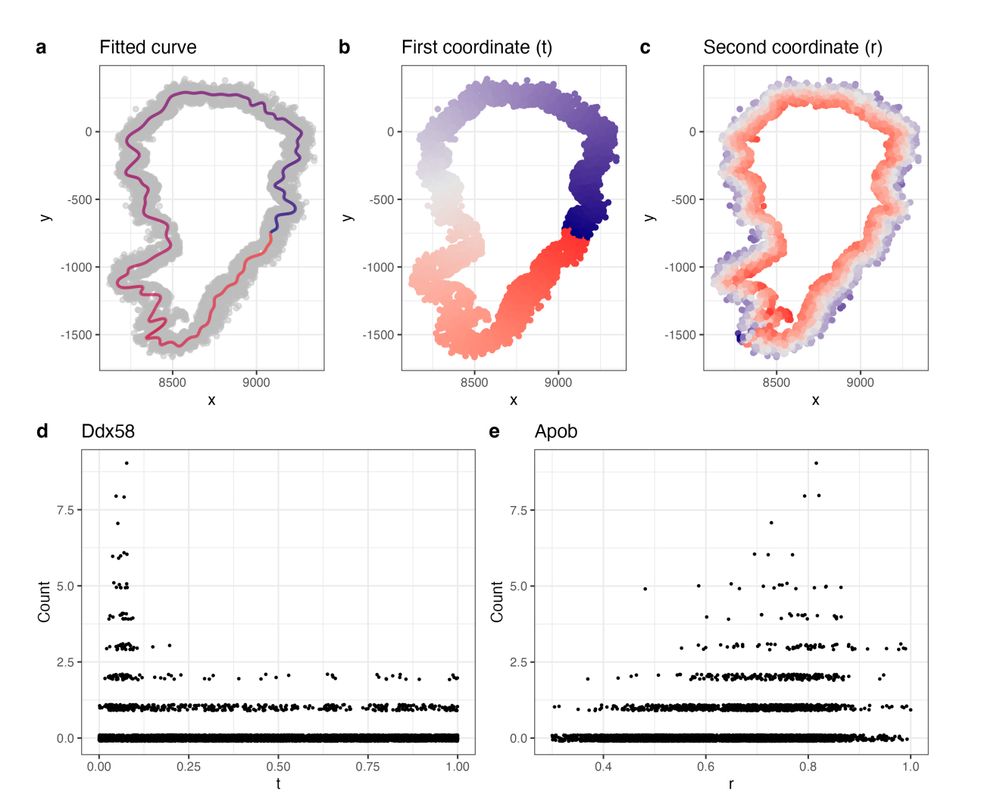
New method for identifying spatially variable genes in spatial transcriptomics.
We use spectral graph theory to extract 1D curves related to tissue morphology, creating a more relevant coordinate system. Improves sensitivity.
with @PhillipNicol et al.
www.biorxiv.org/content/10.1...
We use spectral graph theory to extract 1D curves related to tissue morphology, creating a more relevant coordinate system. Improves sensitivity.
with @PhillipNicol et al.
www.biorxiv.org/content/10.1...
November 22, 2024 at 8:04 PM
New method for identifying spatially variable genes in spatial transcriptomics.
We use spectral graph theory to extract 1D curves related to tissue morphology, creating a more relevant coordinate system. Improves sensitivity.
with @PhillipNicol et al.
www.biorxiv.org/content/10.1...
We use spectral graph theory to extract 1D curves related to tissue morphology, creating a more relevant coordinate system. Improves sensitivity.
with @PhillipNicol et al.
www.biorxiv.org/content/10.1...
Question for #rstats educators: Do you use a standard format for exercises?
I have 100s of exercises along with solutions in quarto documents (see image). But they are not formatted in a systematic way. I would like to easily create docs with and w/o solutions and export to LMS.
I have 100s of exercises along with solutions in quarto documents (see image). But they are not formatted in a systematic way. I would like to easily create docs with and w/o solutions and export to LMS.

December 7, 2023 at 2:10 PM
Question for #rstats educators: Do you use a standard format for exercises?
I have 100s of exercises along with solutions in quarto documents (see image). But they are not formatted in a systematic way. I would like to easily create docs with and w/o solutions and export to LMS.
I have 100s of exercises along with solutions in quarto documents (see image). But they are not formatted in a systematic way. I would like to easily create docs with and w/o solutions and export to LMS.
Hoy inicia nuestro Curso en español de Ciencia de Datos: Fundamentos de R en HarvardX! Aprenderás desde los básicos hasta data wrangling, conceptos de programación e importación de datos. La versión gratis y en línea te da acceso a los videos, textos y ejercicios.
t.co/TGID4IwTSQ
t.co/TGID4IwTSQ
October 19, 2023 at 5:00 PM
Hoy inicia nuestro Curso en español de Ciencia de Datos: Fundamentos de R en HarvardX! Aprenderás desde los básicos hasta data wrangling, conceptos de programación e importación de datos. La versión gratis y en línea te da acceso a los videos, textos y ejercicios.
t.co/TGID4IwTSQ
t.co/TGID4IwTSQ
Data visualization is used in two ways in data analysis:
1) Communicating data insights.
2) Guiding analysis and spotting data issues.
While modern courses and books focus on the first, it's the second - exploratory data analysis - that is more important and harder to teach.
1) Communicating data insights.
2) Guiding analysis and spotting data issues.
While modern courses and books focus on the first, it's the second - exploratory data analysis - that is more important and harder to teach.
September 22, 2023 at 1:24 PM
Data visualization is used in two ways in data analysis:
1) Communicating data insights.
2) Guiding analysis and spotting data issues.
While modern courses and books focus on the first, it's the second - exploratory data analysis - that is more important and harder to teach.
1) Communicating data insights.
2) Guiding analysis and spotting data issues.
While modern courses and books focus on the first, it's the second - exploratory data analysis - that is more important and harder to teach.
Introducing the Data Science Postdoctoral Fellows Program at Harvard/DFCI!
- Join a research group in our department
- Co-mentoring opportunities with 2+ faculty
- Collaborate with DFCI investigators beyond our department
- Salary starts at $75K
Apply here: ds.dfci.harvard.edu/postdocs/
- Join a research group in our department
- Co-mentoring opportunities with 2+ faculty
- Collaborate with DFCI investigators beyond our department
- Salary starts at $75K
Apply here: ds.dfci.harvard.edu/postdocs/
September 20, 2023 at 4:59 PM
Introducing the Data Science Postdoctoral Fellows Program at Harvard/DFCI!
- Join a research group in our department
- Co-mentoring opportunities with 2+ faculty
- Collaborate with DFCI investigators beyond our department
- Salary starts at $75K
Apply here: ds.dfci.harvard.edu/postdocs/
- Join a research group in our department
- Co-mentoring opportunities with 2+ faculty
- Collaborate with DFCI investigators beyond our department
- Salary starts at $75K
Apply here: ds.dfci.harvard.edu/postdocs/