


Dennis Kao
@professorkao.bsky.social
Social Work Professor | Data Viz & Map Designer | Tableau Visionary & Ambassador | husband/father | perpetual student | he/him/his | no AI used
Pinned
Dennis Kao
@professorkao.bsky.social
· Jan 17
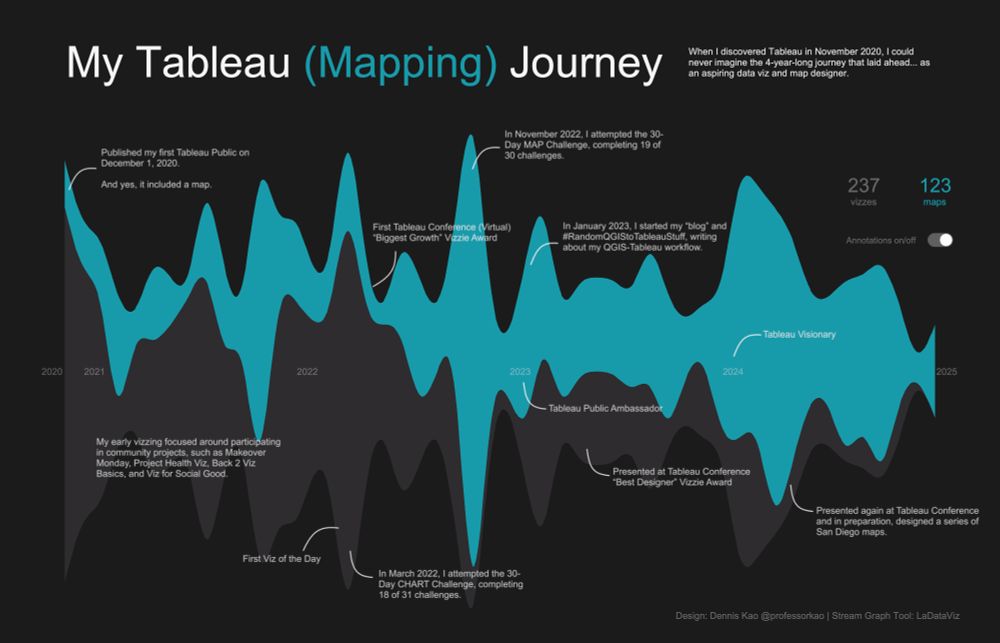
My Tableau (Mapping) Journey visualized... Thanks everyone for all of your support over the past 4+ years. 🙏
Tools: #TableauPublic @figma.com
Stream Graph Tool: @ladataviz.com
Link to workbook: tabsoft.co/3DY0405
Tools: #TableauPublic @figma.com
Stream Graph Tool: @ladataviz.com
Link to workbook: tabsoft.co/3DY0405
Arrrrr.... Happy belated #InternationalTalkLikeAPirateDay, which was this past Friday... ☠️
Link: public.tableau.com/app/profile/...
Link: public.tableau.com/app/profile/...

September 22, 2025 at 8:07 PM
Arrrrr.... Happy belated #InternationalTalkLikeAPirateDay, which was this past Friday... ☠️
Link: public.tableau.com/app/profile/...
Link: public.tableau.com/app/profile/...
Reposted by Dennis Kao

I really try not to write about AI. Too many conversations forced my hand (again)...
www.tableaufit.com/love-it-loat...
www.tableaufit.com/love-it-loat...
Love It, Loathe It, and Lift It: The Missing Conversation on AI
I’ve sat through perhaps too many conversations on AI this month. Whether in-person (hi Outlier), online (oh, the discourse), or anywhere else I happened to be, GenAI is specifically on the m…
www.tableaufit.com
June 24, 2025 at 7:14 PM
I really try not to write about AI. Too many conversations forced my hand (again)...
www.tableaufit.com/love-it-loat...
www.tableaufit.com/love-it-loat...
Reposted by Dennis Kao

Chatbots — LLMs — do not know facts and are not designed to be able to accurately answer factual questions. They are designed to find and mimic patterns of words, probabilistically. When they’re “right” it’s because correct things are often written down, so those patterns are frequent. That’s all.
June 19, 2025 at 11:21 AM
Chatbots — LLMs — do not know facts and are not designed to be able to accurately answer factual questions. They are designed to find and mimic patterns of words, probabilistically. When they’re “right” it’s because correct things are often written down, so those patterns are frequent. That’s all.
Happy #AAPIHeritageMonth & #AsianHeritageMonth!
Here's my viz for this week's #MakeoverMonday & #APITug project, highlighting the prevalence of Asian restaurants and cuisine in the US.
#TableauPublic 🔗: public.tableau.com/app/profile/...
Here's my viz for this week's #MakeoverMonday & #APITug project, highlighting the prevalence of Asian restaurants and cuisine in the US.
#TableauPublic 🔗: public.tableau.com/app/profile/...

May 11, 2025 at 4:10 AM
Happy #AAPIHeritageMonth & #AsianHeritageMonth!
Here's my viz for this week's #MakeoverMonday & #APITug project, highlighting the prevalence of Asian restaurants and cuisine in the US.
#TableauPublic 🔗: public.tableau.com/app/profile/...
Here's my viz for this week's #MakeoverMonday & #APITug project, highlighting the prevalence of Asian restaurants and cuisine in the US.
#TableauPublic 🔗: public.tableau.com/app/profile/...
As we near summer, one of the things I always look forward to are the music festivals! So I've updated my viz "Blues and Jazz Festivals of Canada", showcasing almost 40 festivals across the country...
Link: tabsoft.co/3EHnjYT
Happy Festival-ing!!!! 🎶 🎺 🍻
Link: tabsoft.co/3EHnjYT
Happy Festival-ing!!!! 🎶 🎺 🍻

May 8, 2025 at 4:45 AM
As we near summer, one of the things I always look forward to are the music festivals! So I've updated my viz "Blues and Jazz Festivals of Canada", showcasing almost 40 festivals across the country...
Link: tabsoft.co/3EHnjYT
Happy Festival-ing!!!! 🎶 🎺 🍻
Link: tabsoft.co/3EHnjYT
Happy Festival-ing!!!! 🎶 🎺 🍻
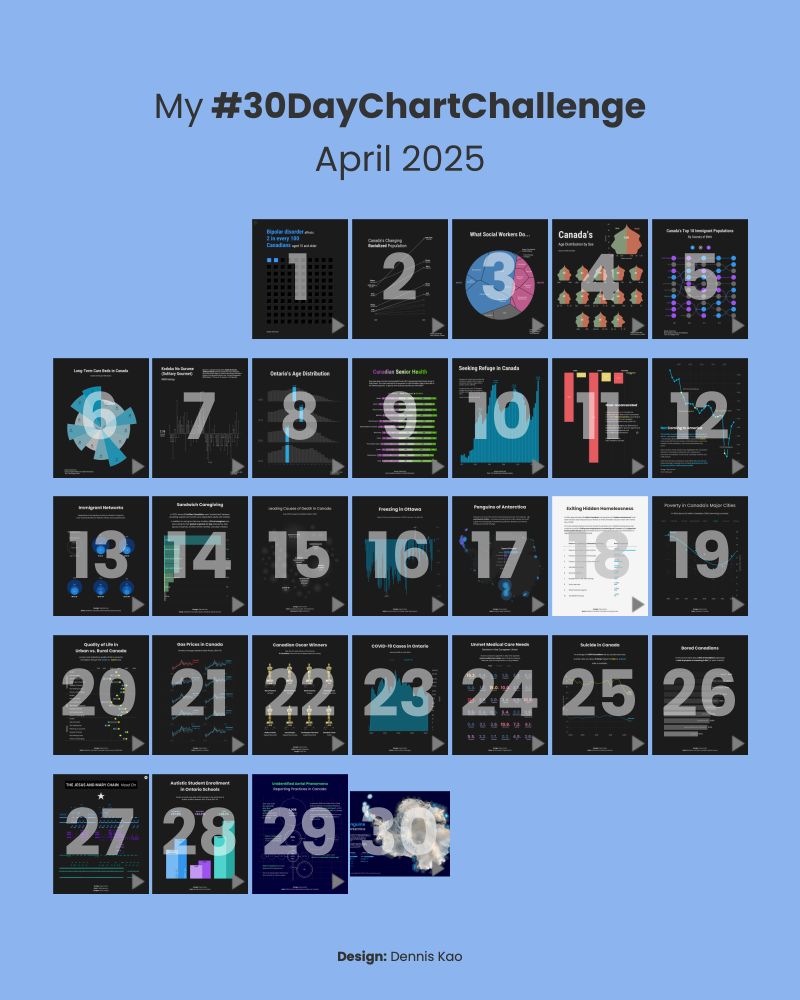
#30DayChartChallenge 2025... it's a wrap!
30 days... 30 visualizations... At some point, I hope to share some of my reflections... but for now, thank you for all your support! 🙏
Congrats to all of the participants! It was great seeing all of your work!
Link: public.tableau.com/app/profile/...
30 days... 30 visualizations... At some point, I hope to share some of my reflections... but for now, thank you for all your support! 🙏
Congrats to all of the participants! It was great seeing all of your work!
Link: public.tableau.com/app/profile/...
May 2, 2025 at 10:53 PM
#30DayChartChallenge 2025... it's a wrap!
30 days... 30 visualizations... At some point, I hope to share some of my reflections... but for now, thank you for all your support! 🙏
Congrats to all of the participants! It was great seeing all of your work!
Link: public.tableau.com/app/profile/...
30 days... 30 visualizations... At some point, I hope to share some of my reflections... but for now, thank you for all your support! 🙏
Congrats to all of the participants! It was great seeing all of your work!
Link: public.tableau.com/app/profile/...
#30DayChartChallenge Day 30 National Geographic
I love NG... and re: maps, NG is the gold standard! I decided to redo my "Penguins of Antarctica" viz/map and hope I do NG justice...
Feedback always appreciated!
Link: public.tableau.com/app/profile/...
I love NG... and re: maps, NG is the gold standard! I decided to redo my "Penguins of Antarctica" viz/map and hope I do NG justice...
Feedback always appreciated!
Link: public.tableau.com/app/profile/...


April 30, 2025 at 12:22 PM
#30DayChartChallenge Day 30 National Geographic
I love NG... and re: maps, NG is the gold standard! I decided to redo my "Penguins of Antarctica" viz/map and hope I do NG justice...
Feedback always appreciated!
Link: public.tableau.com/app/profile/...
I love NG... and re: maps, NG is the gold standard! I decided to redo my "Penguins of Antarctica" viz/map and hope I do NG justice...
Feedback always appreciated!
Link: public.tableau.com/app/profile/...
#30DayChartChallenge Day 29 Extraterrestrial
Had a bit of fun with this one... here's my "crop circle" chart highlighting some findings from the Sky Canada Report... 🛸
Let me know what you think! 🙏
Link: public.tableau.com/app/profile/...
Had a bit of fun with this one... here's my "crop circle" chart highlighting some findings from the Sky Canada Report... 🛸
Let me know what you think! 🙏
Link: public.tableau.com/app/profile/...

April 29, 2025 at 5:22 AM
#30DayChartChallenge Day 29 Extraterrestrial
Had a bit of fun with this one... here's my "crop circle" chart highlighting some findings from the Sky Canada Report... 🛸
Let me know what you think! 🙏
Link: public.tableau.com/app/profile/...
Had a bit of fun with this one... here's my "crop circle" chart highlighting some findings from the Sky Canada Report... 🛸
Let me know what you think! 🙏
Link: public.tableau.com/app/profile/...
Can't believe it's almost over... #30DayChartChallenge Day 28 Inclusion
The theme made me think of the special education field... so here's my viz, highlighting the increase in autistic students enrolled in Ontario schools.
Feedback always appreciated!
Link: public.tableau.com/app/profile/...
The theme made me think of the special education field... so here's my viz, highlighting the increase in autistic students enrolled in Ontario schools.
Feedback always appreciated!
Link: public.tableau.com/app/profile/...

April 28, 2025 at 5:12 AM
Can't believe it's almost over... #30DayChartChallenge Day 28 Inclusion
The theme made me think of the special education field... so here's my viz, highlighting the increase in autistic students enrolled in Ontario schools.
Feedback always appreciated!
Link: public.tableau.com/app/profile/...
The theme made me think of the special education field... so here's my viz, highlighting the increase in autistic students enrolled in Ontario schools.
Feedback always appreciated!
Link: public.tableau.com/app/profile/...
#30DayChartChallenge Day 27 Noise
Naturally, I thought of one of my favorite noise rock bands in the 80s & 90s, The Jesus and Mary Chain...
... and decided to visualize the MIDI data of their song, Head On. 🤘
Link: public.tableau.com/app/profile/...
Naturally, I thought of one of my favorite noise rock bands in the 80s & 90s, The Jesus and Mary Chain...
... and decided to visualize the MIDI data of their song, Head On. 🤘
Link: public.tableau.com/app/profile/...

April 27, 2025 at 8:15 AM
#30DayChartChallenge Day 27 Noise
Naturally, I thought of one of my favorite noise rock bands in the 80s & 90s, The Jesus and Mary Chain...
... and decided to visualize the MIDI data of their song, Head On. 🤘
Link: public.tableau.com/app/profile/...
Naturally, I thought of one of my favorite noise rock bands in the 80s & 90s, The Jesus and Mary Chain...
... and decided to visualize the MIDI data of their song, Head On. 🤘
Link: public.tableau.com/app/profile/...
#30DayChartChallenge Day 26 Monochrome
Really leaned into today's theme... In 2024, 20% of Canadians expressed a lack of purpose or meaning in life (or in other words, were "bored"). So here's a bar chart...
Feedback always appreciated!
Link: public.tableau.com/app/profile/...
Really leaned into today's theme... In 2024, 20% of Canadians expressed a lack of purpose or meaning in life (or in other words, were "bored"). So here's a bar chart...
Feedback always appreciated!
Link: public.tableau.com/app/profile/...

April 26, 2025 at 12:06 PM
#30DayChartChallenge Day 26 Monochrome
Really leaned into today's theme... In 2024, 20% of Canadians expressed a lack of purpose or meaning in life (or in other words, were "bored"). So here's a bar chart...
Feedback always appreciated!
Link: public.tableau.com/app/profile/...
Really leaned into today's theme... In 2024, 20% of Canadians expressed a lack of purpose or meaning in life (or in other words, were "bored"). So here's a bar chart...
Feedback always appreciated!
Link: public.tableau.com/app/profile/...
#30DayChartChallenge Day 25 Risk
Each year, an average of 4,000 Canadians die by suicide... and the risk for men is about 3 times higher than women.
Help is available... Speak with someone today! #StarttheConversation #EndTheStigma
Link: public.tableau.com/app/profile/...
Each year, an average of 4,000 Canadians die by suicide... and the risk for men is about 3 times higher than women.
Help is available... Speak with someone today! #StarttheConversation #EndTheStigma
Link: public.tableau.com/app/profile/...

April 25, 2025 at 1:42 PM
#30DayChartChallenge Day 25 Risk
Each year, an average of 4,000 Canadians die by suicide... and the risk for men is about 3 times higher than women.
Help is available... Speak with someone today! #StarttheConversation #EndTheStigma
Link: public.tableau.com/app/profile/...
Each year, an average of 4,000 Canadians die by suicide... and the risk for men is about 3 times higher than women.
Help is available... Speak with someone today! #StarttheConversation #EndTheStigma
Link: public.tableau.com/app/profile/...
#30DayChartChallenge Day 24 World Health Organization
Here's my viz, looking at unmet medical care needs among seniors in the European Union. I went with a sort-of small multiples/heat map hybrid...
Let me know if it works... feedback always appreciated!🙏
Link: public.tableau.com/app/profile/...
Here's my viz, looking at unmet medical care needs among seniors in the European Union. I went with a sort-of small multiples/heat map hybrid...
Let me know if it works... feedback always appreciated!🙏
Link: public.tableau.com/app/profile/...

April 25, 2025 at 2:25 AM
#30DayChartChallenge Day 24 World Health Organization
Here's my viz, looking at unmet medical care needs among seniors in the European Union. I went with a sort-of small multiples/heat map hybrid...
Let me know if it works... feedback always appreciated!🙏
Link: public.tableau.com/app/profile/...
Here's my viz, looking at unmet medical care needs among seniors in the European Union. I went with a sort-of small multiples/heat map hybrid...
Let me know if it works... feedback always appreciated!🙏
Link: public.tableau.com/app/profile/...
#30DayChartChallenge Day 23 Log Scale
Learned log scale in school years ago, but TBH, I don't really know how to use or interpret it 😅
But here you go... a simple viz of COVID cases in Ontario from Jan 2020 to June 2024.
Feedback always appreciated! 🙏
Link: public.tableau.com/app/profile/...
Learned log scale in school years ago, but TBH, I don't really know how to use or interpret it 😅
But here you go... a simple viz of COVID cases in Ontario from Jan 2020 to June 2024.
Feedback always appreciated! 🙏
Link: public.tableau.com/app/profile/...

April 23, 2025 at 6:06 AM
#30DayChartChallenge Day 23 Log Scale
Learned log scale in school years ago, but TBH, I don't really know how to use or interpret it 😅
But here you go... a simple viz of COVID cases in Ontario from Jan 2020 to June 2024.
Feedback always appreciated! 🙏
Link: public.tableau.com/app/profile/...
Learned log scale in school years ago, but TBH, I don't really know how to use or interpret it 😅
But here you go... a simple viz of COVID cases in Ontario from Jan 2020 to June 2024.
Feedback always appreciated! 🙏
Link: public.tableau.com/app/profile/...

#30DayChartChallenge Day 22 Stars
Here's a fun visualization highlighting the 8 Canadians who have won the Oscar for acting...
Feedback always appreciated!🙏
Link: public.tableau.com/app/profile/...
Here's a fun visualization highlighting the 8 Canadians who have won the Oscar for acting...
Feedback always appreciated!🙏
Link: public.tableau.com/app/profile/...

April 22, 2025 at 12:10 PM
#30DayChartChallenge Day 22 Stars
Here's a fun visualization highlighting the 8 Canadians who have won the Oscar for acting...
Feedback always appreciated!🙏
Link: public.tableau.com/app/profile/...
Here's a fun visualization highlighting the 8 Canadians who have won the Oscar for acting...
Feedback always appreciated!🙏
Link: public.tableau.com/app/profile/...
#30DayChartChallenge Day 21 Fossils
Here's my viz looking at average gas prices in Canada from 2020 to the present...
Feedback always appreciated! 🙏
Link: public.tableau.com/app/profile/...
Here's my viz looking at average gas prices in Canada from 2020 to the present...
Feedback always appreciated! 🙏
Link: public.tableau.com/app/profile/...

April 21, 2025 at 4:14 PM
#30DayChartChallenge Day 21 Fossils
Here's my viz looking at average gas prices in Canada from 2020 to the present...
Feedback always appreciated! 🙏
Link: public.tableau.com/app/profile/...
Here's my viz looking at average gas prices in Canada from 2020 to the present...
Feedback always appreciated! 🙏
Link: public.tableau.com/app/profile/...
#30DayChartChallenge Day 20 Urbanization
I designed a visualization, i.e. a dumbbell chart, looking at the urban-rural differences in quality of life among Canadians.
Feedback always appreciated! 🙏
Link: public.tableau.com/app/profile/...
I designed a visualization, i.e. a dumbbell chart, looking at the urban-rural differences in quality of life among Canadians.
Feedback always appreciated! 🙏
Link: public.tableau.com/app/profile/...

April 21, 2025 at 7:11 AM
#30DayChartChallenge Day 20 Urbanization
I designed a visualization, i.e. a dumbbell chart, looking at the urban-rural differences in quality of life among Canadians.
Feedback always appreciated! 🙏
Link: public.tableau.com/app/profile/...
I designed a visualization, i.e. a dumbbell chart, looking at the urban-rural differences in quality of life among Canadians.
Feedback always appreciated! 🙏
Link: public.tableau.com/app/profile/...
#30DayChartChallenge Day 19 Smooth
A bit late... I designed a visualization showing the poverty rates for Canada's major cities from 2015 to 2022.
Feedback always appreciated! 🙏
Link: public.tableau.com/app/profile/...
A bit late... I designed a visualization showing the poverty rates for Canada's major cities from 2015 to 2022.
Feedback always appreciated! 🙏
Link: public.tableau.com/app/profile/...

April 20, 2025 at 8:51 AM
#30DayChartChallenge Day 19 Smooth
A bit late... I designed a visualization showing the poverty rates for Canada's major cities from 2015 to 2022.
Feedback always appreciated! 🙏
Link: public.tableau.com/app/profile/...
A bit late... I designed a visualization showing the poverty rates for Canada's major cities from 2015 to 2022.
Feedback always appreciated! 🙏
Link: public.tableau.com/app/profile/...
#30DayChartChallenge Day 18 El País
The charts I found on El País seemed simple & clean... Following this approach, here's my viz highlighting the issue of "hidden homelessness" which impacted over 1.7 million Canadians in 2022.
Feedback appreciated!🙏
Link: public.tableau.com/app/profile/...
The charts I found on El País seemed simple & clean... Following this approach, here's my viz highlighting the issue of "hidden homelessness" which impacted over 1.7 million Canadians in 2022.
Feedback appreciated!🙏
Link: public.tableau.com/app/profile/...

April 19, 2025 at 2:31 AM
#30DayChartChallenge Day 18 El País
The charts I found on El País seemed simple & clean... Following this approach, here's my viz highlighting the issue of "hidden homelessness" which impacted over 1.7 million Canadians in 2022.
Feedback appreciated!🙏
Link: public.tableau.com/app/profile/...
The charts I found on El País seemed simple & clean... Following this approach, here's my viz highlighting the issue of "hidden homelessness" which impacted over 1.7 million Canadians in 2022.
Feedback appreciated!🙏
Link: public.tableau.com/app/profile/...
#30DayChartChallenge Day 17 Birds
I was planning to wait until next Friday, April 25th, which is WORLD PENGUIN DAY... but given the prompt, here's my viz of the estimated 44 million penguins living around Antarctica.
Feedback always appreciated! 🙏
Link: public.tableau.com/app/profile/...
I was planning to wait until next Friday, April 25th, which is WORLD PENGUIN DAY... but given the prompt, here's my viz of the estimated 44 million penguins living around Antarctica.
Feedback always appreciated! 🙏
Link: public.tableau.com/app/profile/...

April 17, 2025 at 3:52 PM
#30DayChartChallenge Day 17 Birds
I was planning to wait until next Friday, April 25th, which is WORLD PENGUIN DAY... but given the prompt, here's my viz of the estimated 44 million penguins living around Antarctica.
Feedback always appreciated! 🙏
Link: public.tableau.com/app/profile/...
I was planning to wait until next Friday, April 25th, which is WORLD PENGUIN DAY... but given the prompt, here's my viz of the estimated 44 million penguins living around Antarctica.
Feedback always appreciated! 🙏
Link: public.tableau.com/app/profile/...
#30DayChartChallenge Day 16 Negative
I created a simple chart visualizing the daily minimum temperatures in Ottawa this year. It's been a bit cold this past winter (and spring)...
Feedback always appreciated! 🙏
Link: public.tableau.com/app/profile/...
I created a simple chart visualizing the daily minimum temperatures in Ottawa this year. It's been a bit cold this past winter (and spring)...
Feedback always appreciated! 🙏
Link: public.tableau.com/app/profile/...

April 16, 2025 at 11:39 AM
#30DayChartChallenge Day 16 Negative
I created a simple chart visualizing the daily minimum temperatures in Ottawa this year. It's been a bit cold this past winter (and spring)...
Feedback always appreciated! 🙏
Link: public.tableau.com/app/profile/...
I created a simple chart visualizing the daily minimum temperatures in Ottawa this year. It's been a bit cold this past winter (and spring)...
Feedback always appreciated! 🙏
Link: public.tableau.com/app/profile/...
#30DayChartChallenge Day 15 Complicated
My viz touches upon the difficult topic of death, but an issue with significant implications for public health and health care.
Feedback always appreciated 🙏
Link: public.tableau.com/app/profile/...
My viz touches upon the difficult topic of death, but an issue with significant implications for public health and health care.
Feedback always appreciated 🙏
Link: public.tableau.com/app/profile/...

April 15, 2025 at 9:46 AM
#30DayChartChallenge Day 15 Complicated
My viz touches upon the difficult topic of death, but an issue with significant implications for public health and health care.
Feedback always appreciated 🙏
Link: public.tableau.com/app/profile/...
My viz touches upon the difficult topic of death, but an issue with significant implications for public health and health care.
Feedback always appreciated 🙏
Link: public.tableau.com/app/profile/...
#30DayChartChallenge Day 14 Kinships
My viz touches on the issue of sandwich caregiving. In 2020, 1.8 million Canadians were "sandwiched" between providing care to both an care-dependent adult & their children.
Feedback always appreciated!🙏
Link: public.tableau.com/app/profile/...
My viz touches on the issue of sandwich caregiving. In 2020, 1.8 million Canadians were "sandwiched" between providing care to both an care-dependent adult & their children.
Feedback always appreciated!🙏
Link: public.tableau.com/app/profile/...

April 14, 2025 at 7:31 AM
#30DayChartChallenge Day 14 Kinships
My viz touches on the issue of sandwich caregiving. In 2020, 1.8 million Canadians were "sandwiched" between providing care to both an care-dependent adult & their children.
Feedback always appreciated!🙏
Link: public.tableau.com/app/profile/...
My viz touches on the issue of sandwich caregiving. In 2020, 1.8 million Canadians were "sandwiched" between providing care to both an care-dependent adult & their children.
Feedback always appreciated!🙏
Link: public.tableau.com/app/profile/...
#30DayChartChallenge Day 13 Clusters
My viz looks at the networks of immigrants to Canada, which can look different based on the age they immigrated to the country. Tried to be a bit more creative this time... 😅
Feedback always appreicated! 🙏
Link: public.tableau.com/app/profile/...
My viz looks at the networks of immigrants to Canada, which can look different based on the age they immigrated to the country. Tried to be a bit more creative this time... 😅
Feedback always appreicated! 🙏
Link: public.tableau.com/app/profile/...

April 13, 2025 at 2:10 PM
#30DayChartChallenge Day 13 Clusters
My viz looks at the networks of immigrants to Canada, which can look different based on the age they immigrated to the country. Tried to be a bit more creative this time... 😅
Feedback always appreicated! 🙏
Link: public.tableau.com/app/profile/...
My viz looks at the networks of immigrants to Canada, which can look different based on the age they immigrated to the country. Tried to be a bit more creative this time... 😅
Feedback always appreicated! 🙏
Link: public.tableau.com/app/profile/...