


Mridul K. Thomas
@mridulkthomas.bsky.social
ecology, statistics, experimental design, temperature, multiple drivers, plankton | www.mridulkthomas.com | Transitioning out of academia
Pinned
My time in academia is at an end. I'm not sure what comes next, but what a privilege it's been getting to work with smart, idealistic, and kind people every day to understand our world a little better.
This one, which shaped many of our lives:
www.newyorker.com/news/john-ca...
Alt link if that doesn't work: archive.ph/PtwWF
www.newyorker.com/news/john-ca...
Alt link if that doesn't work: archive.ph/PtwWF

The Reinhart and Rogoff Controversy: A Summing Up
www.newyorker.com
January 9, 2026 at 3:33 PM
This one, which shaped many of our lives:
www.newyorker.com/news/john-ca...
Alt link if that doesn't work: archive.ph/PtwWF
www.newyorker.com/news/john-ca...
Alt link if that doesn't work: archive.ph/PtwWF
December 17, 2025 at 4:33 PM
December 17, 2025 at 4:33 PM
Thank you so much - that is very kind! All the best to you too.
December 12, 2025 at 9:39 AM
Thank you so much - that is very kind! All the best to you too.
My time in academia is at an end. I'm not sure what comes next, but what a privilege it's been getting to work with smart, idealistic, and kind people every day to understand our world a little better.
December 11, 2025 at 1:52 PM
My time in academia is at an end. I'm not sure what comes next, but what a privilege it's been getting to work with smart, idealistic, and kind people every day to understand our world a little better.
Reposted by Mridul K. Thomas
Happy to see our analysis on scaling up temperature x nutrient interactions from populations to communities published in Ecological Monographs @esajournals.bsky.social! 📈
Ecologists recognize the importance of integrating across scales, yet our models often target specific scales. Our new paper presents models of population growth that scale up to explain community-level patterns, including interactions of temperature, light & nutrients. doi.org/10.1002/ecm....

December 9, 2025 at 3:21 PM
Happy to see our analysis on scaling up temperature x nutrient interactions from populations to communities published in Ecological Monographs @esajournals.bsky.social! 📈
How do temperature and resources interact to shape both population and community growth rates?
We have a model that makes predictions at both levels! And we test them with experimental data from the lab & field.
This one has been gestating for years and we're rather proud of it. Give it a read.
We have a model that makes predictions at both levels! And we test them with experimental data from the lab & field.
This one has been gestating for years and we're rather proud of it. Give it a read.
Ecologists recognize the importance of integrating across scales, yet our models often target specific scales. Our new paper presents models of population growth that scale up to explain community-level patterns, including interactions of temperature, light & nutrients. doi.org/10.1002/ecm....
December 9, 2025 at 2:49 PM
How do temperature and resources interact to shape both population and community growth rates?
We have a model that makes predictions at both levels! And we test them with experimental data from the lab & field.
This one has been gestating for years and we're rather proud of it. Give it a read.
We have a model that makes predictions at both levels! And we test them with experimental data from the lab & field.
This one has been gestating for years and we're rather proud of it. Give it a read.
Looks like an exciting network!
There are so many interesting, important questions that we could address well with some more co-ordination.
There are so many interesting, important questions that we could address well with some more co-ordination.

The Thermal Ecology Alliance is approaching 1000 members! Join here: www.thermalecologyalliance.org/participation

December 9, 2025 at 11:59 AM
Looks like an exciting network!
There are so many interesting, important questions that we could address well with some more co-ordination.
There are so many interesting, important questions that we could address well with some more co-ordination.
Reposted by Mridul K. Thomas

Our data analysis guides for multiple stressor/driver research 🌊
@christinamcgraw.bsky.social
@sineadcollins.bsky.social
@mridulkthomas.bsky.social
@chrisecornwall.bsky.social
+ Peter Dillingham, Steeve Comeau, Sam Dupont
aslopubs.onlinelibrary.wiley.com/doi/10.1002/...
@christinamcgraw.bsky.social
@sineadcollins.bsky.social
@mridulkthomas.bsky.social
@chrisecornwall.bsky.social
+ Peter Dillingham, Steeve Comeau, Sam Dupont
aslopubs.onlinelibrary.wiley.com/doi/10.1002/...

The MEDDLE Data Analysis Guides as a Living Resource for Multiple‐Driver Marine Research
Click on the article title to read more.
aslopubs.onlinelibrary.wiley.com
December 8, 2025 at 1:46 PM
Our data analysis guides for multiple stressor/driver research 🌊
@christinamcgraw.bsky.social
@sineadcollins.bsky.social
@mridulkthomas.bsky.social
@chrisecornwall.bsky.social
+ Peter Dillingham, Steeve Comeau, Sam Dupont
aslopubs.onlinelibrary.wiley.com/doi/10.1002/...
@christinamcgraw.bsky.social
@sineadcollins.bsky.social
@mridulkthomas.bsky.social
@chrisecornwall.bsky.social
+ Peter Dillingham, Steeve Comeau, Sam Dupont
aslopubs.onlinelibrary.wiley.com/doi/10.1002/...
Reposted by Mridul K. Thomas
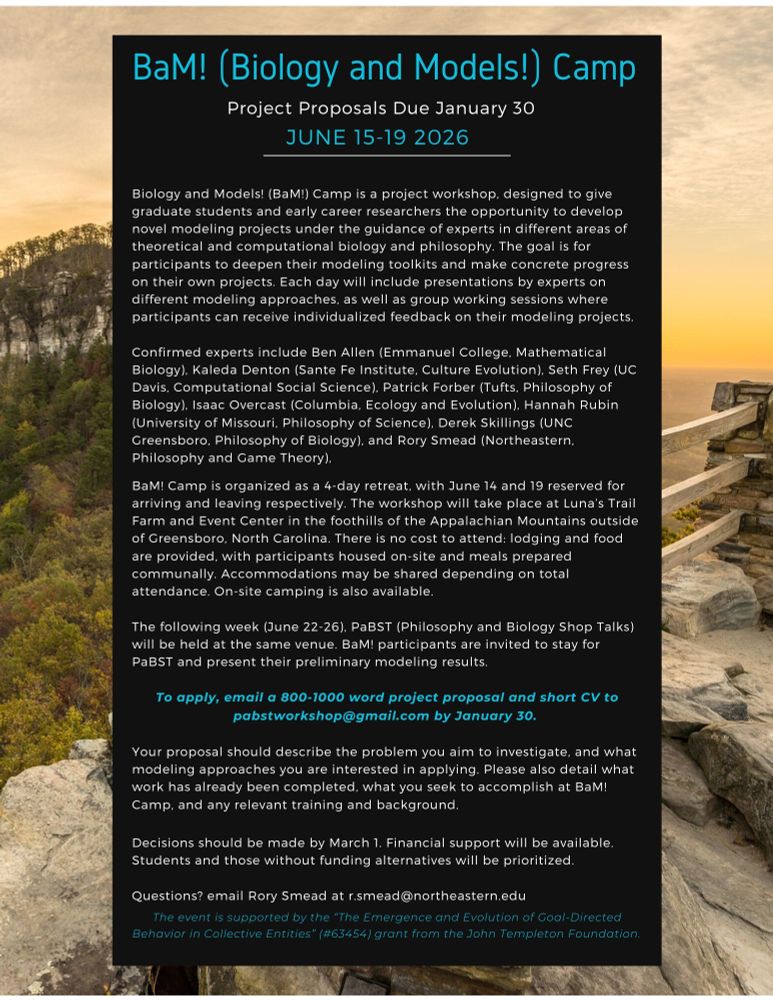
Hi everyone! I'm co-organizing this retreat/workshop June 15-19 for those looking to get started in mathematical/computational modeling of biological processes. Location is a beautiful farm in NC. Please share with students and others who want to build modeling skills. Interdisciplinarity welcome!
December 2, 2025 at 7:00 PM
Hi everyone! I'm co-organizing this retreat/workshop June 15-19 for those looking to get started in mathematical/computational modeling of biological processes. Location is a beautiful farm in NC. Please share with students and others who want to build modeling skills. Interdisciplinarity welcome!
And while we're on the subject of weird photosynthesis, Pseudoblepharisma has both a green alga and a purple sulphur bacterium as endosymbiotes.
en.wikipedia.org/wiki/Pseudob...
en.wikipedia.org/wiki/Pseudob...

Pseudoblepharisma - Wikipedia
en.wikipedia.org
November 26, 2025 at 2:45 PM
And while we're on the subject of weird photosynthesis, Pseudoblepharisma has both a green alga and a purple sulphur bacterium as endosymbiotes.
en.wikipedia.org/wiki/Pseudob...
en.wikipedia.org/wiki/Pseudob...
The genus Paulinella is apparently the only known case of a photosynthetic eukaryote that did NOT receive its chloroplast from a primary endosymbiosis more than a billion years ago.
It repeated the trick independently ~100 million years ago!
en.wikipedia.org/wiki/Pauline...
It repeated the trick independently ~100 million years ago!
en.wikipedia.org/wiki/Pauline...

Paulinella - Wikipedia
en.wikipedia.org
November 26, 2025 at 2:45 PM
The genus Paulinella is apparently the only known case of a photosynthetic eukaryote that did NOT receive its chloroplast from a primary endosymbiosis more than a billion years ago.
It repeated the trick independently ~100 million years ago!
en.wikipedia.org/wiki/Pauline...
It repeated the trick independently ~100 million years ago!
en.wikipedia.org/wiki/Pauline...


A new release of the mgcv #RStats 📦 is out on CRAN and Simon Wood (U Edinburgh) has added some significant new features despite the small bump in version number:
🌟 scasm() for estimating GAMs with shape constrained smooths. Can be used with any family & smoothness selection is via the EFS method
🌟 scasm() for estimating GAMs with shape constrained smooths. Can be used with any family & smoothness selection is via the EFS method

November 12, 2025 at 2:04 PM
Reposted by Mridul K. Thomas
Thank you @ecologicalsociety.bsky.social's Theoretical Ecology Section for the Best Theory paper award for our @science.org paper on eco-evo emergence of macroecological scaling!
esa.org/theory/award...
esa.org/theory/award...
November 3, 2025 at 4:30 PM
Thank you @ecologicalsociety.bsky.social's Theoretical Ecology Section for the Best Theory paper award for our @science.org paper on eco-evo emergence of macroecological scaling!
esa.org/theory/award...
esa.org/theory/award...
library(manipulate)
manipulate(
curve(
arnoldi(x, T_opt, E, Pf_max),
0, 40, ylim = c(0, 2)),
T_opt = slider(0.1, 40, 20),
E= slider(0.1, 20, 5),
Pf_max = slider(0.01, 3, 1)
)
manipulate(
curve(
arnoldi(x, T_opt, E, Pf_max),
0, 40, ylim = c(0, 2)),
T_opt = slider(0.1, 40, 20),
E= slider(0.1, 20, 5),
Pf_max = slider(0.01, 3, 1)
)
October 24, 2025 at 11:05 AM
library(manipulate)
manipulate(
curve(
arnoldi(x, T_opt, E, Pf_max),
0, 40, ylim = c(0, 2)),
T_opt = slider(0.1, 40, 20),
E= slider(0.1, 20, 5),
Pf_max = slider(0.01, 3, 1)
)
manipulate(
curve(
arnoldi(x, T_opt, E, Pf_max),
0, 40, ylim = c(0, 2)),
T_opt = slider(0.1, 40, 20),
E= slider(0.1, 20, 5),
Pf_max = slider(0.01, 3, 1)
)
# Arnoldi et al. (2025) function
arnoldi <- function(x, T_opt, E, Pf_max){
exp((x-T_opt)/E)*(1-((x-T_opt)/E))*Pf_max
}
# T_opt = optimum temperature
# E= upper critical temperature (i.e. Tmax) minus t_opt
# Pf_max = max performance (e.g. max growth rate)
curve(arnoldi(x, 20, 10, 2), 0, 35)
arnoldi <- function(x, T_opt, E, Pf_max){
exp((x-T_opt)/E)*(1-((x-T_opt)/E))*Pf_max
}
# T_opt = optimum temperature
# E= upper critical temperature (i.e. Tmax) minus t_opt
# Pf_max = max performance (e.g. max growth rate)
curve(arnoldi(x, 20, 10, 2), 0, 35)
October 24, 2025 at 11:05 AM
# Arnoldi et al. (2025) function
arnoldi <- function(x, T_opt, E, Pf_max){
exp((x-T_opt)/E)*(1-((x-T_opt)/E))*Pf_max
}
# T_opt = optimum temperature
# E= upper critical temperature (i.e. Tmax) minus t_opt
# Pf_max = max performance (e.g. max growth rate)
curve(arnoldi(x, 20, 10, 2), 0, 35)
arnoldi <- function(x, T_opt, E, Pf_max){
exp((x-T_opt)/E)*(1-((x-T_opt)/E))*Pf_max
}
# T_opt = optimum temperature
# E= upper critical temperature (i.e. Tmax) minus t_opt
# Pf_max = max performance (e.g. max growth rate)
curve(arnoldi(x, 20, 10, 2), 0, 35)
Need to think more about the headline claim, but this proposes a very nice new thermal performance curve (TPC) function with appealing properties.
www.pnas.org/doi/abs/10.1...
www.pnas.org/doi/abs/10.1...

A universal thermal performance curve arises in biology and ecology | PNAS
Temperature has strong impacts on all biological and ecological processes, and thermal
performance curves (TPCs) have been employed recurrently to ...
www.pnas.org
October 24, 2025 at 11:05 AM
Need to think more about the headline claim, but this proposes a very nice new thermal performance curve (TPC) function with appealing properties.
www.pnas.org/doi/abs/10.1...
www.pnas.org/doi/abs/10.1...
Reposted by Mridul K. Thomas
🌊 New paper out today: Assessing the interaction between ocean alkalinity enhancement 🚢 and phytoplankton🦠 in an Earth System Model 🌐
#mCDR #OAE #ESM
bg.copernicus.org/articles/22/...
#mCDR #OAE #ESM
bg.copernicus.org/articles/22/...

Interactions between ocean alkalinity enhancement and phytoplankton in an Earth system model
Abstract. The functioning and efficiency of ocean alkalinity enhancement (OAE) as a CO2 removal strategy is well investigated in model studies, but risks for the ecosystem are presently not considered...
bg.copernicus.org
October 22, 2025 at 3:06 PM
🌊 New paper out today: Assessing the interaction between ocean alkalinity enhancement 🚢 and phytoplankton🦠 in an Earth System Model 🌐
#mCDR #OAE #ESM
bg.copernicus.org/articles/22/...
#mCDR #OAE #ESM
bg.copernicus.org/articles/22/...
Reposted by Mridul K. Thomas

Interested in resource competition theory, mutualism, spatial patterns or temporal dynamics? I'll be giving a talk in the IITE online seminar series tomorrow summarizing our recent work on microbial cross-feeding that includes all these ingredients.

📣Tomorrow our next series of online seminars restarts: Chris Klausmeier (MSU) will present:
⭐Microbial cross-feeding: coexistence and collapse, spatial patterns and population cycles⭐
Free and open to all:
Zoom link: iite.info/seminar/
Global Times: www.timeanddate.com/worldclock/f...
⭐Microbial cross-feeding: coexistence and collapse, spatial patterns and population cycles⭐
Free and open to all:
Zoom link: iite.info/seminar/
Global Times: www.timeanddate.com/worldclock/f...

October 20, 2025 at 5:19 PM
Interested in resource competition theory, mutualism, spatial patterns or temporal dynamics? I'll be giving a talk in the IITE online seminar series tomorrow summarizing our recent work on microbial cross-feeding that includes all these ingredients.

Our thanks to @gleonetwork.bsky.social for hosting this as part of its Limnoseries. And for this impressive catalogue of past workshops & talks on youtube - an excellent resource:
www.youtube.com/@gleonetwork...
www.youtube.com/@gleonetwork...

GLEONetwork
www.youtube.com
October 15, 2025 at 9:58 AM
Our thanks to @gleonetwork.bsky.social for hosting this as part of its Limnoseries. And for this impressive catalogue of past workshops & talks on youtube - an excellent resource:
www.youtube.com/@gleonetwork...
www.youtube.com/@gleonetwork...
If you watch this video and go through the scripts (or attended live), we'd be happy to have your feedback!
docs.google.com/forms/d/e/1F...
docs.google.com/forms/d/e/1F...

Feedback for GLEON experimental design workshop
Thank you for attending the GLEON workshop on 'How to design better experiments' by Mridul K. Thomas & Ravi Ranjan on 23/09/2025! This is a quick survey about your experience at the workshop. We are h...
docs.google.com
October 15, 2025 at 9:52 AM
If you watch this video and go through the scripts (or attended live), we'd be happy to have your feedback!
docs.google.com/forms/d/e/1F...
docs.google.com/forms/d/e/1F...
R scripts and presentation:
github.com/mridulkthoma...
No need to be familiar with Github, just download two files at the link.
github.com/mridulkthoma...
No need to be familiar with Github, just download two files at the link.

GitHub - mridulkthomas/experimental-design-limnoseries-workshop: Materials for workshop "How to Design Better Experiments"
Materials for workshop "How to Design Better Experiments" - mridulkthomas/experimental-design-limnoseries-workshop
github.com
October 15, 2025 at 9:50 AM
R scripts and presentation:
github.com/mridulkthoma...
No need to be familiar with Github, just download two files at the link.
github.com/mridulkthoma...
No need to be familiar with Github, just download two files at the link.