
As of 1Q25, 71.3% of active single-family mortgages carry a rate under 5%, down 0.6% from 4Q24. Over half (53.4%) are locked in below 4%.


As of 1Q25, 71.3% of active single-family mortgages carry a rate under 5%, down 0.6% from 4Q24. Over half (53.4%) are locked in below 4%.
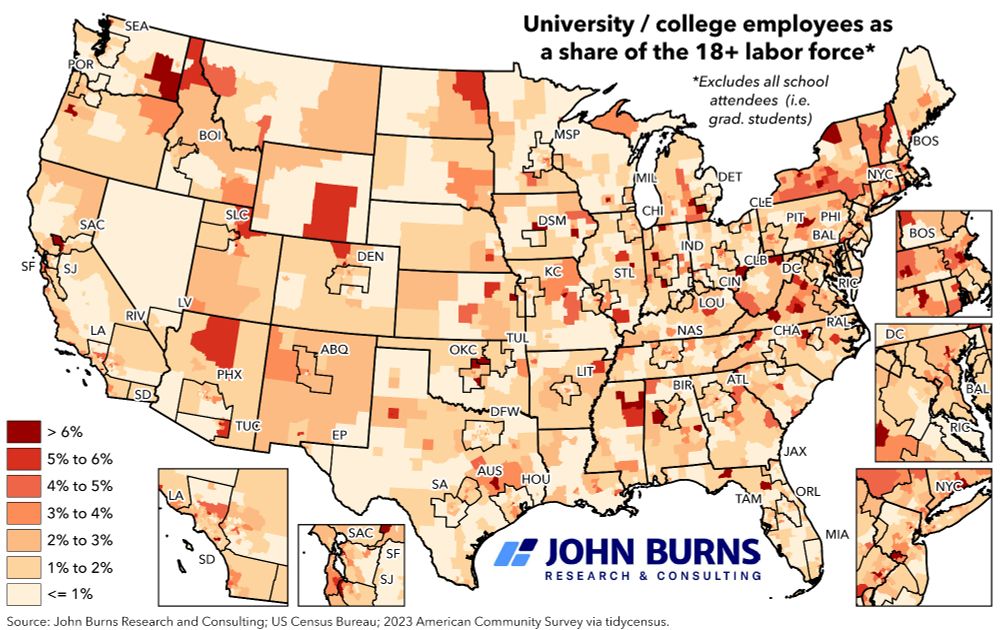
#jbrec #housing #realestate #economics #DOGE #college #gis #maps #geography #cartography

#jbrec #housing #realestate #economics #DOGE #college #gis #maps #geography #cartography
Source: US Census Bureau, Survey of Construction, 2024 Characteristics of New Housing (www.census.gov/construction...).


Source: US Census Bureau, Survey of Construction, 2024 Characteristics of New Housing (www.census.gov/construction...).
@jbrec.com clients can reach out for access to the underlying data!

@jbrec.com clients can reach out for access to the underlying data!
Source: lnkd.in/eyRiXeKs
Note: February 2025 vs February 2024
#jbrec #realestate #housing #utilities #electricity #inflation #gis #maps #geography #cartography

Source: lnkd.in/eyRiXeKs
Note: February 2025 vs February 2024
#jbrec #realestate #housing #utilities #electricity #inflation #gis #maps #geography #cartography


#housing #realestate

#housing #realestate

As of 4Q24, 72.1% of outstanding single-family mortgages are sitting on a mortgage rate below 5%, down 0.8% from 3Q24. Over half (54.1%) have a rate under 4%.
Source: lnkd.in/e3uXGdHj
#realestate #housing #economics #gis


As of 4Q24, 72.1% of outstanding single-family mortgages are sitting on a mortgage rate below 5%, down 0.8% from 3Q24. Over half (54.1%) have a rate under 4%.
Source: lnkd.in/e3uXGdHj
#realestate #housing #economics #gis
#jbrec #housing #realestate #economics #gis #maps

#jbrec #housing #realestate #economics #gis #maps

