


Jonas Groot Kormelink
@jgrootkormelink.bsky.social
Creative Coding, Data Visualisation, Frontend Developer, Design, Maps, D3.js, Three.js, WebGL, p5.js, React.js, Next.js and other creative and fun things on the intersection of Design, Data and Technology!
jonasgrootkormelink.nl
jonasgrootkormelink.co.uk
jonasgrootkormelink.nl
jonasgrootkormelink.co.uk
Back in 2018 we did an experiment with generating a landscapes based on GPS route data. By merging DEM maps and satellite imagery we where able to generate interactive landscapes dynamically. @cleverfranke.com
#threejs #experiment #gpsdata #mapboxgl #tbt #datavisualization #dataviz #landscape
#threejs #experiment #gpsdata #mapboxgl #tbt #datavisualization #dataviz #landscape


September 19, 2025 at 10:33 AM
Back in 2018 we did an experiment with generating a landscapes based on GPS route data. By merging DEM maps and satellite imagery we where able to generate interactive landscapes dynamically. @cleverfranke.com
#threejs #experiment #gpsdata #mapboxgl #tbt #datavisualization #dataviz #landscape
#threejs #experiment #gpsdata #mapboxgl #tbt #datavisualization #dataviz #landscape
Just some random experiments. #creativecoding #threejs #generativeart #grid #algorithmicart #visualexperiment #sketch #experiment #3d #cityscape


July 26, 2025 at 6:17 PM
Just some random experiments. #creativecoding #threejs #generativeart #grid #algorithmicart #visualexperiment #sketch #experiment #3d #cityscape
Just some random experiments. #creativecoding #p5js #processing #generativeart #grid #algorithmicart #visualexperiment #sketch #experiment


July 16, 2025 at 2:44 PM
Just some random experiments. #creativecoding #p5js #processing #generativeart #grid #algorithmicart #visualexperiment #sketch #experiment
Back in 2013, we experimented with visualising data using ThreeJS, plotting over 10K weather stations around the world. The prototype smoothly morphs between a map and globe view. @cleverfranke.com
#threejs #experiment #data #geopgrahy #tbt #datavisualization #dataviz #data #creativecoding
#threejs #experiment #data #geopgrahy #tbt #datavisualization #dataviz #data #creativecoding


June 13, 2025 at 1:41 PM
Back in 2013, we experimented with visualising data using ThreeJS, plotting over 10K weather stations around the world. The prototype smoothly morphs between a map and globe view. @cleverfranke.com
#threejs #experiment #data #geopgrahy #tbt #datavisualization #dataviz #data #creativecoding
#threejs #experiment #data #geopgrahy #tbt #datavisualization #dataviz #data #creativecoding
In this experiment, I explored how simple rules, nested grids, and probabilistic algorithms can generate unique visual compositions, playing with shapes, structure, and color.
#creativecoding #p5js #processing #generativeart #grid #algorithmicart #visualexperiment #datavisualization #sketch
#creativecoding #p5js #processing #generativeart #grid #algorithmicart #visualexperiment #datavisualization #sketch


May 2, 2025 at 1:07 PM
In this experiment, I explored how simple rules, nested grids, and probabilistic algorithms can generate unique visual compositions, playing with shapes, structure, and color.
#creativecoding #p5js #processing #generativeart #grid #algorithmicart #visualexperiment #datavisualization #sketch
#creativecoding #p5js #processing #generativeart #grid #algorithmicart #visualexperiment #datavisualization #sketch
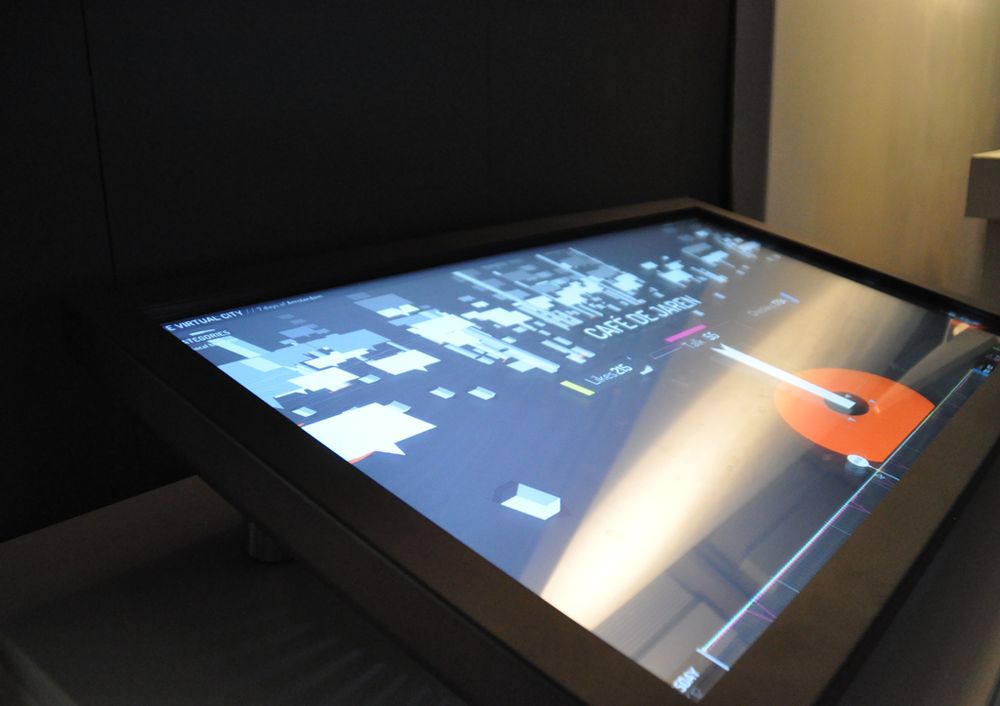
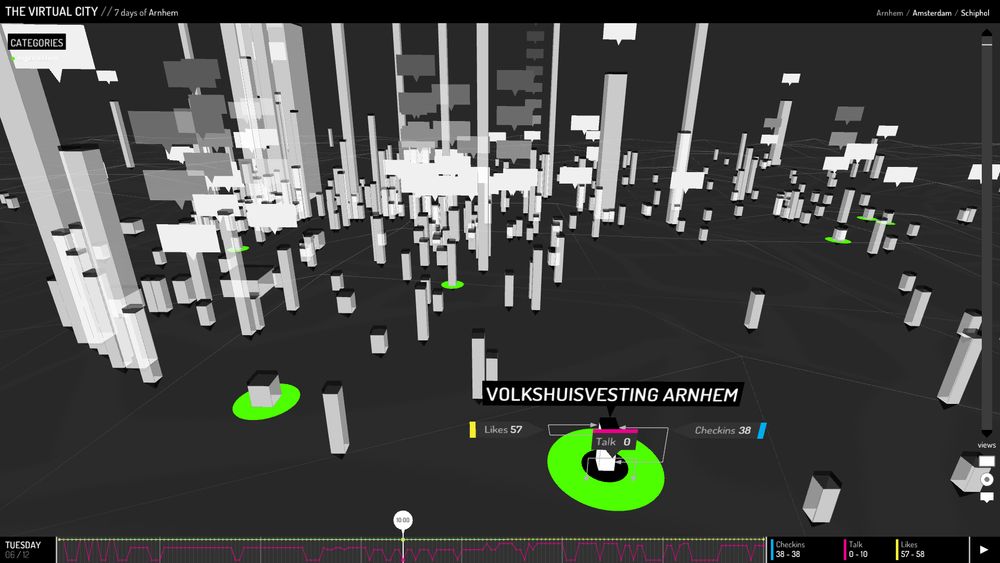
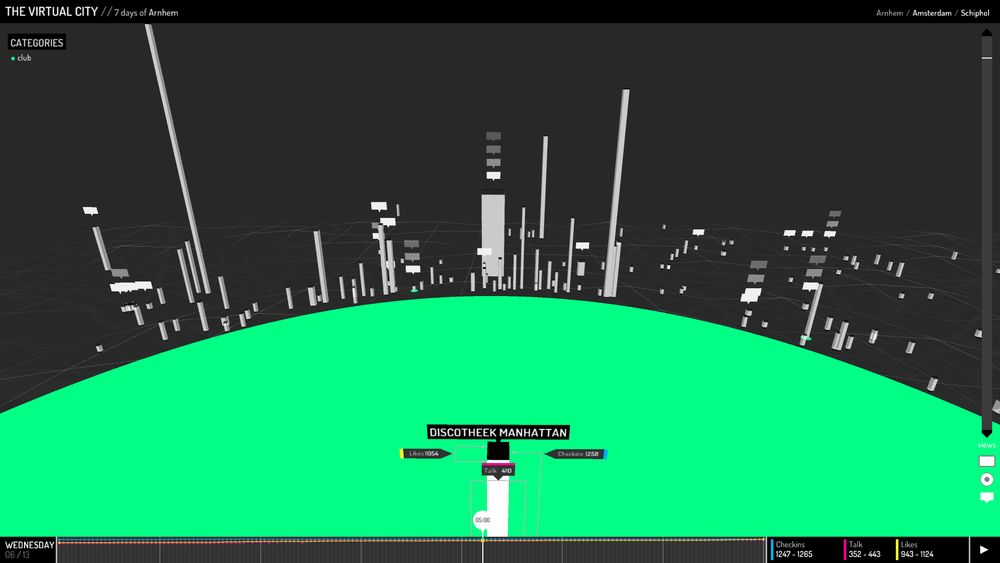
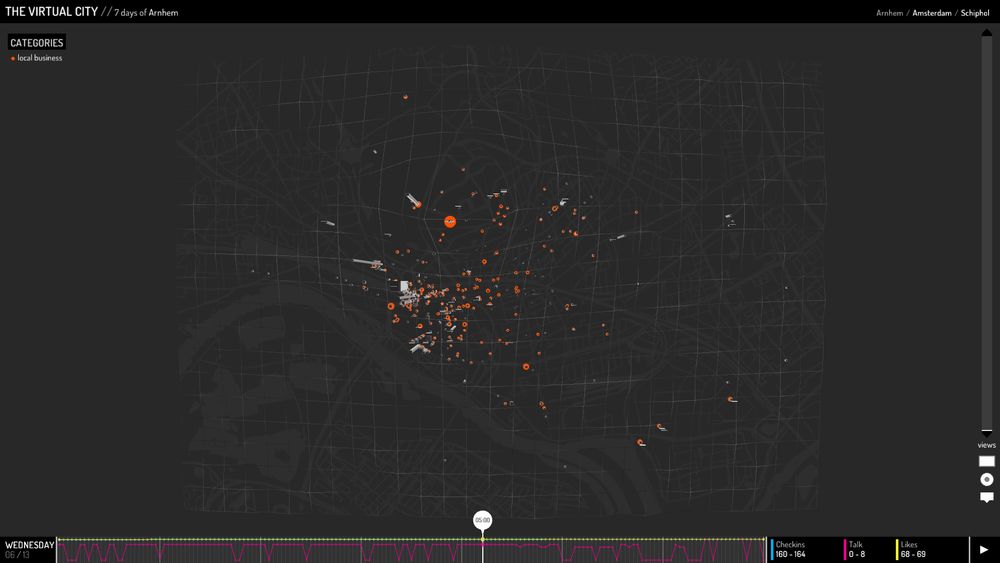
In 2012, I created The Virtual City, an interactive visualisation of Facebook user interactions taking place in specific cities. The installation invited visitors to explore through place and time. #processing #creativecoding #dataviz #datavisualization #tbt #data #timeline #explore #data #geography
April 18, 2025 at 10:41 AM
In 2012, I created The Virtual City, an interactive visualisation of Facebook user interactions taking place in specific cities. The installation invited visitors to explore through place and time. #processing #creativecoding #dataviz #datavisualization #tbt #data #timeline #explore #data #geography
In 2017, I created a tool to visualise Twitter trends and topics. By setting the URL, it could display any trend, growing over time as more tweets were added.
#generative #twitter-api #d3js #d3 #dataviz #data-visualisation #creative-coding #creativecoding #interactive #live-data #tbt #api
#generative #twitter-api #d3js #d3 #dataviz #data-visualisation #creative-coding #creativecoding #interactive #live-data #tbt #api


March 28, 2025 at 1:58 PM
In 2017, I created a tool to visualise Twitter trends and topics. By setting the URL, it could display any trend, growing over time as more tweets were added.
#generative #twitter-api #d3js #d3 #dataviz #data-visualisation #creative-coding #creativecoding #interactive #live-data #tbt #api
#generative #twitter-api #d3js #d3 #dataviz #data-visualisation #creative-coding #creativecoding #interactive #live-data #tbt #api
In 2016, I created a sunburst visualization that compares GDP and population across countries and continents over a 50-year period, incorporating key events that may have influenced these metrics.
#timeline #dataviz #visualization #data #d3js #d3 #world #tbt #experiment #geography #sunburst
#timeline #dataviz #visualization #data #d3js #d3 #world #tbt #experiment #geography #sunburst


March 12, 2025 at 9:13 PM
In 2016, I created a sunburst visualization that compares GDP and population across countries and continents over a 50-year period, incorporating key events that may have influenced these metrics.
#timeline #dataviz #visualization #data #d3js #d3 #world #tbt #experiment #geography #sunburst
#timeline #dataviz #visualization #data #d3js #d3 #world #tbt #experiment #geography #sunburst
In 2016 I created a simple map plotting over 2000 of the largest cities using the Peirce quincuncial projection with the size determined by the population count.
#dataviz #visualization #datavisualization #data #map #d3js #d3 #wiki #wikipedia #world #tbt #experiment #geography #world #creativecoding
#dataviz #visualization #datavisualization #data #map #d3js #d3 #wiki #wikipedia #world #tbt #experiment #geography #world #creativecoding


February 28, 2025 at 1:05 PM
In 2016 I created a simple map plotting over 2000 of the largest cities using the Peirce quincuncial projection with the size determined by the population count.
#dataviz #visualization #datavisualization #data #map #d3js #d3 #wiki #wikipedia #world #tbt #experiment #geography #world #creativecoding
#dataviz #visualization #datavisualization #data #map #d3js #d3 #wiki #wikipedia #world #tbt #experiment #geography #world #creativecoding
Back in 2015 I created Wiki Serendipity: a simple web app that generates random “facts” using the WikiPedia API to battle doomscrolling and to learn something new everyday.
#creativecoding #wikipedia #serendipity #random #experiment #generative #tbt #api #wiki #doomscrolling #education #voice-over
#creativecoding #wikipedia #serendipity #random #experiment #generative #tbt #api #wiki #doomscrolling #education #voice-over


February 14, 2025 at 12:04 PM
Back in 2015 I created Wiki Serendipity: a simple web app that generates random “facts” using the WikiPedia API to battle doomscrolling and to learn something new everyday.
#creativecoding #wikipedia #serendipity #random #experiment #generative #tbt #api #wiki #doomscrolling #education #voice-over
#creativecoding #wikipedia #serendipity #random #experiment #generative #tbt #api #wiki #doomscrolling #education #voice-over
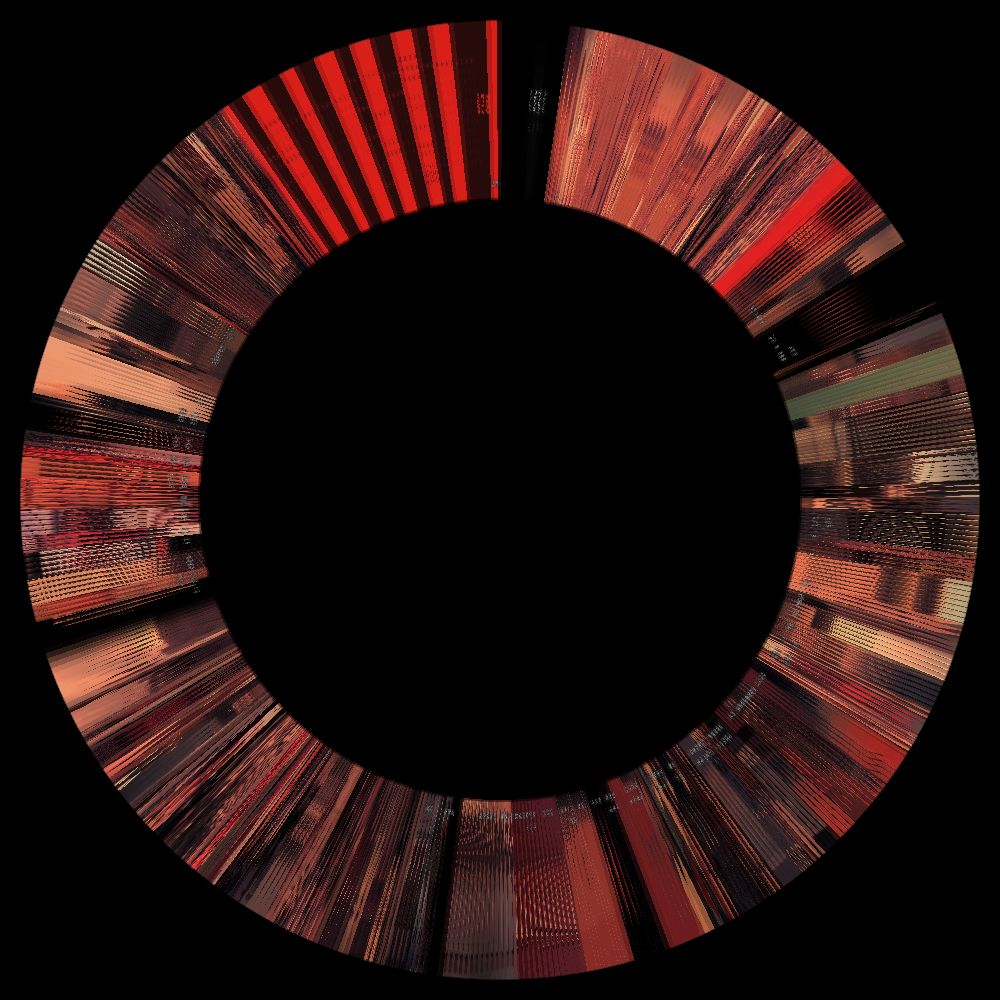
Some old work: Digital Pointillism (5/5)
#creativecoding #processing #p5js #colors #sketch #pointillism #experiment #photos #abstract #generative #tbt #slitscan #pixels #sorting #pixel-sorting
#creativecoding #processing #p5js #colors #sketch #pointillism #experiment #photos #abstract #generative #tbt #slitscan #pixels #sorting #pixel-sorting


February 9, 2025 at 2:11 PM
Some old work: Digital Pointillism (5/5)
#creativecoding #processing #p5js #colors #sketch #pointillism #experiment #photos #abstract #generative #tbt #slitscan #pixels #sorting #pixel-sorting
#creativecoding #processing #p5js #colors #sketch #pointillism #experiment #photos #abstract #generative #tbt #slitscan #pixels #sorting #pixel-sorting
Some old work: Digital Pointillism (4/5)
#creativecoding #processing #p5js #colors #sketch #pointillism #experiment #photos #abstract #generative #tbt #slitscan #pixels #sorting #pixel-sorting
#creativecoding #processing #p5js #colors #sketch #pointillism #experiment #photos #abstract #generative #tbt #slitscan #pixels #sorting #pixel-sorting


January 31, 2025 at 2:05 PM
Some old work: Digital Pointillism (4/5)
#creativecoding #processing #p5js #colors #sketch #pointillism #experiment #photos #abstract #generative #tbt #slitscan #pixels #sorting #pixel-sorting
#creativecoding #processing #p5js #colors #sketch #pointillism #experiment #photos #abstract #generative #tbt #slitscan #pixels #sorting #pixel-sorting
Some old work: Digital Pointillism (3/5) - Refinement and Details
#creativecoding #processing #p5js #colors #sketch #pointillism #experiment #photos #abstract #generative #tbt #slitscan #pixels #sorting #pixel-sorting
#creativecoding #processing #p5js #colors #sketch #pointillism #experiment #photos #abstract #generative #tbt #slitscan #pixels #sorting #pixel-sorting


January 25, 2025 at 2:25 PM
Some old work: Digital Pointillism (3/5) - Refinement and Details
#creativecoding #processing #p5js #colors #sketch #pointillism #experiment #photos #abstract #generative #tbt #slitscan #pixels #sorting #pixel-sorting
#creativecoding #processing #p5js #colors #sketch #pointillism #experiment #photos #abstract #generative #tbt #slitscan #pixels #sorting #pixel-sorting
Some old work: Digital Pointillism (2/5) - Layering Sketch
#creativecoding #processing #p5js #colors #sketch #pointillism #experiment #photos #abstract #generative #tbt #slitscan #pixels #sorting #pixel-sorting
#creativecoding #processing #p5js #colors #sketch #pointillism #experiment #photos #abstract #generative #tbt #slitscan #pixels #sorting #pixel-sorting


January 17, 2025 at 1:11 PM
Some old work: Digital Pointillism (2/5) - Layering Sketch
#creativecoding #processing #p5js #colors #sketch #pointillism #experiment #photos #abstract #generative #tbt #slitscan #pixels #sorting #pixel-sorting
#creativecoding #processing #p5js #colors #sketch #pointillism #experiment #photos #abstract #generative #tbt #slitscan #pixels #sorting #pixel-sorting
Some old work: Digital Pointillism (1/5) - Some initial sketches
#creativecoding #processing #p5js #colors #sketch #pointillism #experiment #photos #abstract #generative #tbt #slitscan #pixels #sorting #pixel-sorting


January 10, 2025 at 1:29 PM
Some old work: Digital Pointillism (1/5) - Some initial sketches
#creativecoding #processing #p5js #colors #sketch #pointillism #experiment #photos #abstract #generative #tbt #slitscan #pixels #sorting #pixel-sorting
Some old work: Abstract Cities (3/3) BONUS - Some Alternatives
#creativecoding #processing #p5js #grid #sketch #locationbased #experiment #cities #abstract #generative #geography #qgis #osm #tbt #data #data-visualization #data-visualisation


December 19, 2024 at 5:37 PM
Some old work: Abstract Cities (3/3) BONUS - Some Alternatives
#creativecoding #processing #p5js #grid #sketch #locationbased #experiment #cities #abstract #generative #geography #qgis #osm #tbt #data #data-visualization #data-visualisation
Some old work: Abstract Cities (3/3)
#creativecoding #processing #p5js #grid #sketch #locationbased #experiment #cities #abstract #generative #geography #qgis #osm #tbt
#creativecoding #processing #p5js #grid #sketch #locationbased #experiment #cities #abstract #generative #geography #qgis #osm #tbt


December 6, 2024 at 1:24 PM
Some old work: Abstract Cities (3/3)
#creativecoding #processing #p5js #grid #sketch #locationbased #experiment #cities #abstract #generative #geography #qgis #osm #tbt
#creativecoding #processing #p5js #grid #sketch #locationbased #experiment #cities #abstract #generative #geography #qgis #osm #tbt
Some old work: Abstract Cities (2/3)
#creativecoding #processing #p5js #grid #sketch #experiment #cities #abstract #generative #geography #qgis #simplification #osm #tbt
#creativecoding #processing #p5js #grid #sketch #experiment #cities #abstract #generative #geography #qgis #simplification #osm #tbt


December 1, 2024 at 1:12 PM
Some old work: Abstract Cities (2/3)
#creativecoding #processing #p5js #grid #sketch #experiment #cities #abstract #generative #geography #qgis #simplification #osm #tbt
#creativecoding #processing #p5js #grid #sketch #experiment #cities #abstract #generative #geography #qgis #simplification #osm #tbt
Some old work: Abstract Cities (1/3)
#creativecoding #processing #p5js #grid #sketch #experiment #cities #abstract #generative #geography #qgis #osm #tbt
#creativecoding #processing #p5js #grid #sketch #experiment #cities #abstract #generative #geography #qgis #osm #tbt


November 29, 2024 at 1:38 PM
Some old work: Abstract Cities (1/3)
#creativecoding #processing #p5js #grid #sketch #experiment #cities #abstract #generative #geography #qgis #osm #tbt
#creativecoding #processing #p5js #grid #sketch #experiment #cities #abstract #generative #geography #qgis #osm #tbt