


Jan Broder Engler
@jbengler.de
Scientist and software developer. Creator of tidyplots.org. Website jbengler.de.
Pinned
Jan Broder Engler
@jbengler.de
· Dec 6
Hey educators, tidyplots.org is great for teaching students data visualization because it is
🕊️ Free and open-source
🚀 Easy, intuitive and fast
💾 Loaded with demo datasets
🏆 Embracing best practices
🌈 Beautiful
#rstats #phd #dataviz #education
🕊️ Free and open-source
🚀 Easy, intuitive and fast
💾 Loaded with demo datasets
🏆 Embracing best practices
🌈 Beautiful
#rstats #phd #dataviz #education

December 28, 2025 at 4:41 PM

December 23, 2025 at 10:03 PM
Thank you for citing #tidyplots 🙏
Priyesh Patel et al. Post-translational modifications of collagen type I in osteogenesis imperfecta: Systematic review and meta-analysis. Bone Reports (2026).
doi.org/10.1016/j.bo...
#rstats #dataviz #phd
Priyesh Patel et al. Post-translational modifications of collagen type I in osteogenesis imperfecta: Systematic review and meta-analysis. Bone Reports (2026).
doi.org/10.1016/j.bo...
#rstats #dataviz #phd
December 23, 2025 at 9:59 PM
Thank you for citing #tidyplots 🙏
Priyesh Patel et al. Post-translational modifications of collagen type I in osteogenesis imperfecta: Systematic review and meta-analysis. Bone Reports (2026).
doi.org/10.1016/j.bo...
#rstats #dataviz #phd
Priyesh Patel et al. Post-translational modifications of collagen type I in osteogenesis imperfecta: Systematic review and meta-analysis. Bone Reports (2026).
doi.org/10.1016/j.bo...
#rstats #dataviz #phd
Thank you for citing #tidyplots 🙏
Changli Jia et al. From midlife emergence to old-age divergence: an empirical study on structural gendered ageism in health service utilization in Tibet. International Journal for Equity in Health (2025).
doi.org/10.1186/s129...
#rstats #dataviz #phd
Changli Jia et al. From midlife emergence to old-age divergence: an empirical study on structural gendered ageism in health service utilization in Tibet. International Journal for Equity in Health (2025).
doi.org/10.1186/s129...
#rstats #dataviz #phd

From midlife emergence to old-age divergence: an empirical study on structural gendered ageism in health service utilization in Tibet - International Journal for Equity in Health
International Journal for Equity in Health - Population aging on the Tibetan Plateau may marginalize older women through combined gender and age bias. We measured sex-specific gaps in medical...
doi.org
December 23, 2025 at 9:58 PM
Thank you for citing #tidyplots 🙏
Changli Jia et al. From midlife emergence to old-age divergence: an empirical study on structural gendered ageism in health service utilization in Tibet. International Journal for Equity in Health (2025).
doi.org/10.1186/s129...
#rstats #dataviz #phd
Changli Jia et al. From midlife emergence to old-age divergence: an empirical study on structural gendered ageism in health service utilization in Tibet. International Journal for Equity in Health (2025).
doi.org/10.1186/s129...
#rstats #dataviz #phd

December 21, 2025 at 12:30 PM

November 27, 2025 at 5:27 PM

November 26, 2025 at 4:42 PM
Thank you for citing #tidyplots 🙏
Steven E. Pilley et al. A metabolic atlas of mouse aging. Cell Metabolism (2025).
doi.org/10.1016/j.cm...
#rstats #dataviz #phd
Steven E. Pilley et al. A metabolic atlas of mouse aging. Cell Metabolism (2025).
doi.org/10.1016/j.cm...
#rstats #dataviz #phd

November 26, 2025 at 1:42 PM
Thank you for citing #tidyplots 🙏
Steven E. Pilley et al. A metabolic atlas of mouse aging. Cell Metabolism (2025).
doi.org/10.1016/j.cm...
#rstats #dataviz #phd
Steven E. Pilley et al. A metabolic atlas of mouse aging. Cell Metabolism (2025).
doi.org/10.1016/j.cm...
#rstats #dataviz #phd
Thank you for citing #tidyplots 🙏
Julio Cesar Santos-Pelaez et al. Synergistic effects of potassium and gibberellin on the yield and quality of yellow pitahaya fruits in the Peruvian Amazon, Frontiers in Agronomy (2025).
doi.org/10.3389/fagr...
#rstats #dataviz #phd
Julio Cesar Santos-Pelaez et al. Synergistic effects of potassium and gibberellin on the yield and quality of yellow pitahaya fruits in the Peruvian Amazon, Frontiers in Agronomy (2025).
doi.org/10.3389/fagr...
#rstats #dataviz #phd

Frontiers | Synergistic effects of potassium and gibberellin on the yield and quality of yellow pitahaya (Hylocereus megalanthus) fruits in the Peruvian Amazon
The cultivation of yellow pitahaya (Hylocereus megalanthus) is increasing in tropical regions due to its nutritional value and market potential. Yet, agronom...
doi.org
November 26, 2025 at 1:42 PM
Thank you for citing #tidyplots 🙏
Julio Cesar Santos-Pelaez et al. Synergistic effects of potassium and gibberellin on the yield and quality of yellow pitahaya fruits in the Peruvian Amazon, Frontiers in Agronomy (2025).
doi.org/10.3389/fagr...
#rstats #dataviz #phd
Julio Cesar Santos-Pelaez et al. Synergistic effects of potassium and gibberellin on the yield and quality of yellow pitahaya fruits in the Peruvian Amazon, Frontiers in Agronomy (2025).
doi.org/10.3389/fagr...
#rstats #dataviz #phd
This is how you can visualize gene expression data in #tidyheatmaps 🤩
jbengler.github.io/tidyheatmaps/
#rstats #dataviz #phd
jbengler.github.io/tidyheatmaps/
#rstats #dataviz #phd

November 21, 2025 at 5:16 PM
This is how you can visualize gene expression data in #tidyheatmaps 🤩
jbengler.github.io/tidyheatmaps/
#rstats #dataviz #phd
jbengler.github.io/tidyheatmaps/
#rstats #dataviz #phd
November 20, 2025 at 5:25 PM

November 19, 2025 at 2:49 PM

November 18, 2025 at 7:45 PM

November 17, 2025 at 6:17 PM

November 14, 2025 at 5:11 PM

November 13, 2025 at 11:12 PM
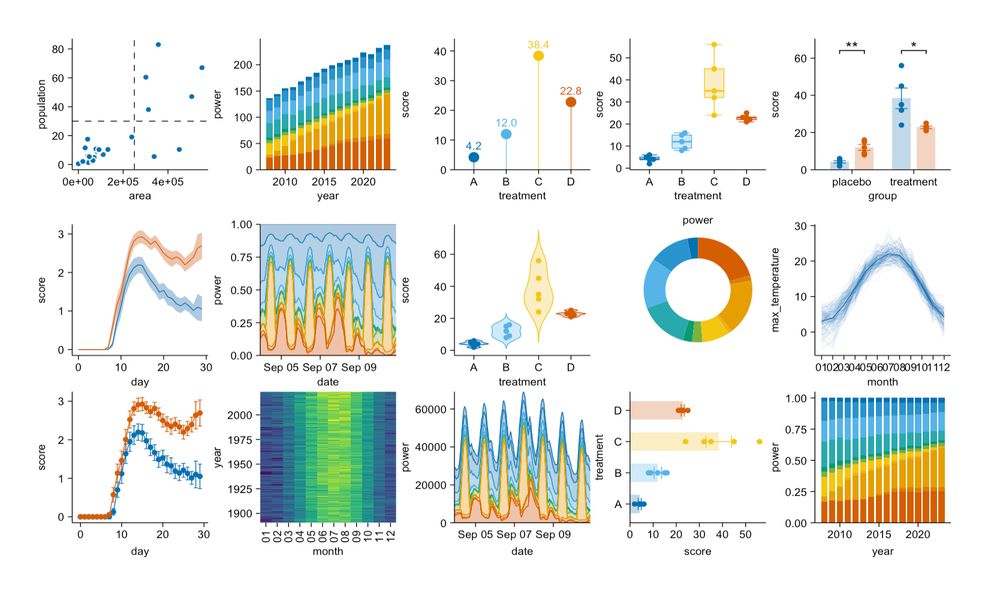
In its first year tidyplots.org has become the go-to data viz for many life science researchers, got 620+ stars on Github, ~30K CRAN downloads, and 11 citations. Thank you for using, sharing, citing, and feedback! There is more to come 🤩
#rstats #dataviz #phd
#rstats #dataviz #phd
November 8, 2025 at 9:24 AM
In its first year tidyplots.org has become the go-to data viz for many life science researchers, got 620+ stars on Github, ~30K CRAN downloads, and 11 citations. Thank you for using, sharing, citing, and feedback! There is more to come 🤩
#rstats #dataviz #phd
#rstats #dataviz #phd

October 21, 2025 at 4:11 PM

October 16, 2025 at 4:45 PM
October 14, 2025 at 3:58 PM
Thank you for citing #tidyplots 🙏
Marcel S Woo et al. Glia inflammation and cell death pathways drive disease progression in preclinical and early AD. EMBO Molecular Medicine (2025).
doi.org/10.1038/s443...
#rstats #dataviz #phd
Marcel S Woo et al. Glia inflammation and cell death pathways drive disease progression in preclinical and early AD. EMBO Molecular Medicine (2025).
doi.org/10.1038/s443...
#rstats #dataviz #phd

Glia inflammation and cell death pathways drive disease progression in preclinical and early AD | EMBO Molecular Medicine
imageimageGlia activation, inflammation, cell death pathways and neuronal pathologies are associated with disease progression in preclinical AD. Activation of glia cells and cell death pathways maintain a vicious cycle of neuroinflammation that ...
doi.org
October 14, 2025 at 3:03 PM
Thank you for citing #tidyplots 🙏
Marcel S Woo et al. Glia inflammation and cell death pathways drive disease progression in preclinical and early AD. EMBO Molecular Medicine (2025).
doi.org/10.1038/s443...
#rstats #dataviz #phd
Marcel S Woo et al. Glia inflammation and cell death pathways drive disease progression in preclinical and early AD. EMBO Molecular Medicine (2025).
doi.org/10.1038/s443...
#rstats #dataviz #phd

October 10, 2025 at 4:24 PM

October 10, 2025 at 4:21 PM
This is how you can set a default style in #tidyplots 🎨
jbengler.github.io/tidyplots/re...
#rstats #dataviz #phd
jbengler.github.io/tidyplots/re...
#rstats #dataviz #phd

October 9, 2025 at 3:48 PM
This is how you can set a default style in #tidyplots 🎨
jbengler.github.io/tidyplots/re...
#rstats #dataviz #phd
jbengler.github.io/tidyplots/re...
#rstats #dataviz #phd

October 7, 2025 at 2:37 PM