


@cyazici.bsky.social
What really drives people to leave their jobs? In our latest exploration, we dive into the Employee Turnover.
medium.com/@statstostor...
#DataScience #MachineLearning #ExplainableAI #PeopleAnalytics #EmployeeRetention #EmployeeTurnover#HRAnalytics
#DataStorytelling #AIForGood#HumanCenteredAI
medium.com/@statstostor...
#DataScience #MachineLearning #ExplainableAI #PeopleAnalytics #EmployeeRetention #EmployeeTurnover#HRAnalytics
#DataStorytelling #AIForGood#HumanCenteredAI

Predicting Employee Turnover with Random Forest
In the world of human resources, understanding why employees leave can be the key to building a more resilient and engaged workforce. The…
medium.com
July 25, 2025 at 12:49 PM
What really drives people to leave their jobs? In our latest exploration, we dive into the Employee Turnover.
medium.com/@statstostor...
#DataScience #MachineLearning #ExplainableAI #PeopleAnalytics #EmployeeRetention #EmployeeTurnover#HRAnalytics
#DataStorytelling #AIForGood#HumanCenteredAI
medium.com/@statstostor...
#DataScience #MachineLearning #ExplainableAI #PeopleAnalytics #EmployeeRetention #EmployeeTurnover#HRAnalytics
#DataStorytelling #AIForGood#HumanCenteredAI
Our new story is live! Not all sustainable fashion claims hold up under the surface.
#DataScience #DataAnalytics #dataVisualization #Rstars #ggplot2 #StoryTellingwithData #Statistics #StatsToStories #Fashion
#DataScience #DataAnalytics #dataVisualization #Rstars #ggplot2 #StoryTellingwithData #Statistics #StatsToStories #Fashion

May 28, 2025 at 10:37 AM
Our new story is live! Not all sustainable fashion claims hold up under the surface.
#DataScience #DataAnalytics #dataVisualization #Rstars #ggplot2 #StoryTellingwithData #Statistics #StatsToStories #Fashion
#DataScience #DataAnalytics #dataVisualization #Rstars #ggplot2 #StoryTellingwithData #Statistics #StatsToStories #Fashion
Still exploring the MDb's Top 1000 Movies. Let's look behind the numbers.
medium.com/@statstostor...
#DataScience #DataAnalytics #DataVisualization #Rstats #ggplot #StorytellingWithData #StatsToStories #IMDb
medium.com/@statstostor...
#DataScience #DataAnalytics #DataVisualization #Rstats #ggplot #StorytellingWithData #StatsToStories #IMDb

May 16, 2025 at 11:00 AM
Still exploring the MDb's Top 1000 Movies. Let's look behind the numbers.
medium.com/@statstostor...
#DataScience #DataAnalytics #DataVisualization #Rstats #ggplot #StorytellingWithData #StatsToStories #IMDb
medium.com/@statstostor...
#DataScience #DataAnalytics #DataVisualization #Rstats #ggplot #StorytellingWithData #StatsToStories #IMDb
Reposted
Exploring #data has become a creative way to make sense of the world around us—especially when it intersects with topics we already love, like movies and culture.
In our latest project, we turn to #movies.
medium.com/@statstostor...
All feedback is welcome.
More data stories coming soon!
In our latest project, we turn to #movies.
medium.com/@statstostor...
All feedback is welcome.
More data stories coming soon!

What IMDb Ratings Really Tell Us: A Data-Driven Story
In the age of online ratings and infinite content choices, platforms like IMDb shape what we watch — and how we feel about it. But what do…
medium.com
May 9, 2025 at 10:21 AM
Exploring #data has become a creative way to make sense of the world around us—especially when it intersects with topics we already love, like movies and culture.
In our latest project, we turn to #movies.
medium.com/@statstostor...
All feedback is welcome.
More data stories coming soon!
In our latest project, we turn to #movies.
medium.com/@statstostor...
All feedback is welcome.
More data stories coming soon!
What IMDb Ratings Really Tell Us: A Data-Driven Story
In the age of online ratings and infinite content choices, platforms like IMDb shape what we watch — and how we feel about it. But what do…
medium.com
May 9, 2025 at 10:21 AM
Exploring #data has become a creative way to make sense of the world around us—especially when it intersects with topics we already love, like movies and culture.
In our latest project, we turn to #movies.
medium.com/@statstostor...
All feedback is welcome.
More data stories coming soon!
In our latest project, we turn to #movies.
medium.com/@statstostor...
All feedback is welcome.
More data stories coming soon!
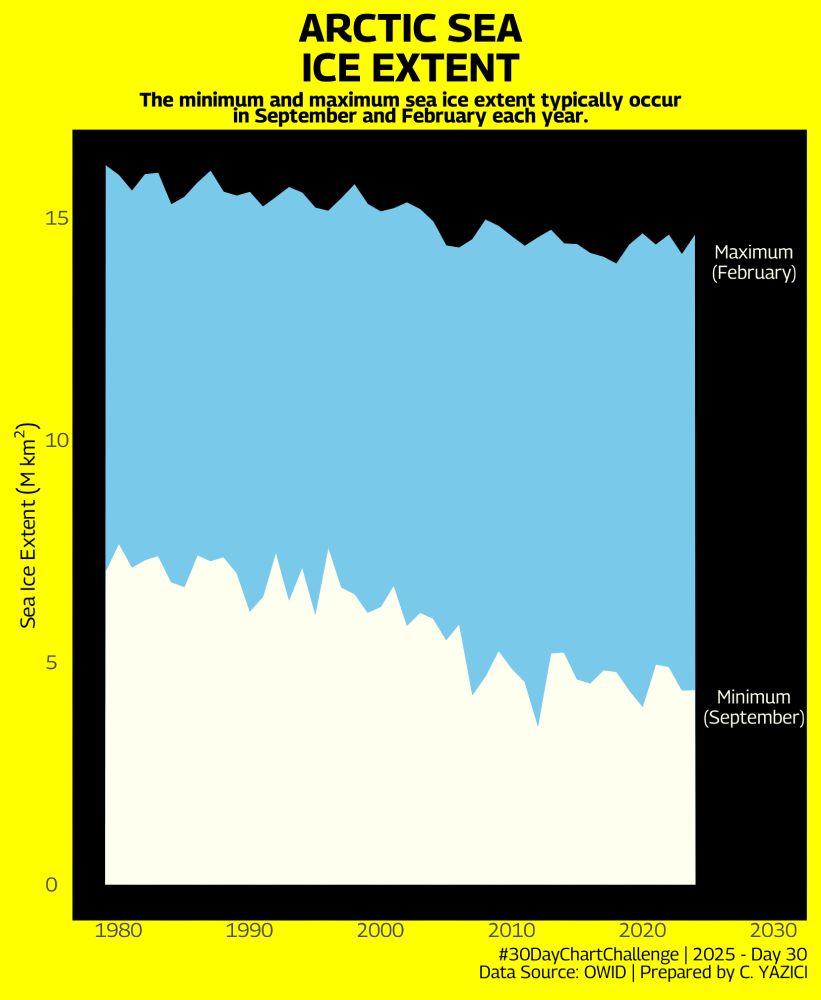
Another late and last submission to #30DayChartChallenge
Thanl you for all who organized and contributed this challenge.
#Rstats #ggplot #DataViz
@30daychartchall.bsky.social
Thanl you for all who organized and contributed this challenge.
#Rstats #ggplot #DataViz
@30daychartchall.bsky.social
May 2, 2025 at 9:08 PM
Another late and last submission to #30DayChartChallenge
Thanl you for all who organized and contributed this challenge.
#Rstats #ggplot #DataViz
@30daychartchall.bsky.social
Thanl you for all who organized and contributed this challenge.
#Rstats #ggplot #DataViz
@30daychartchall.bsky.social
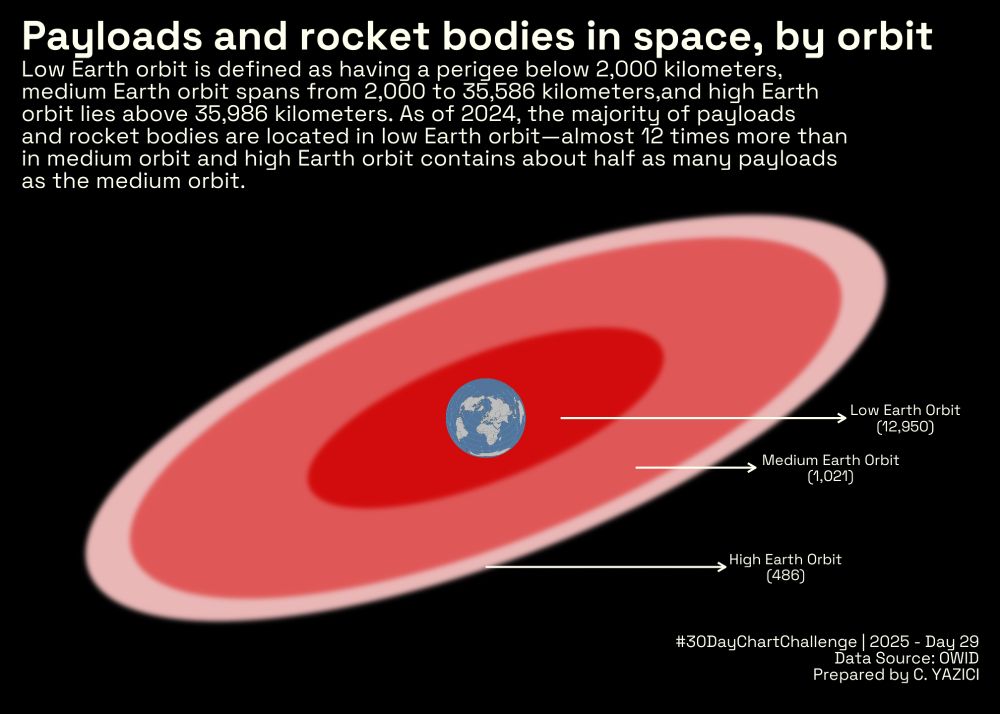
An experimental submission to #Day29 of #30DayChartChallenge
I studied the payloads and rocket bodies in space, by orbit.
#ggplot #Rstats #DataViz
@30daychartchall.bsky.social
I studied the payloads and rocket bodies in space, by orbit.
#ggplot #Rstats #DataViz
@30daychartchall.bsky.social
April 30, 2025 at 7:23 PM
An experimental submission to #Day29 of #30DayChartChallenge
I studied the payloads and rocket bodies in space, by orbit.
#ggplot #Rstats #DataViz
@30daychartchall.bsky.social
I studied the payloads and rocket bodies in space, by orbit.
#ggplot #Rstats #DataViz
@30daychartchall.bsky.social
#Day28 of #30DayChartChallenge with the prompt #inclusion
I studied the #ratings of #chocolates which include salt as the #ingredient
#DataViz #ggplot #Rstats
@30daychartchall.bsky.social
I studied the #ratings of #chocolates which include salt as the #ingredient
#DataViz #ggplot #Rstats
@30daychartchall.bsky.social

April 30, 2025 at 5:45 PM
#Day28 of #30DayChartChallenge with the prompt #inclusion
I studied the #ratings of #chocolates which include salt as the #ingredient
#DataViz #ggplot #Rstats
@30daychartchall.bsky.social
I studied the #ratings of #chocolates which include salt as the #ingredient
#DataViz #ggplot #Rstats
@30daychartchall.bsky.social
Prompt of #Day27 of #30DayChartChallenge is #noise
I studied the #coffee bean production in Brazil and Columbia
#Rstats #ggplot #DataViz
@30daychartchall.bsky.social
I studied the #coffee bean production in Brazil and Columbia
#Rstats #ggplot #DataViz
@30daychartchall.bsky.social

April 29, 2025 at 5:19 PM
Prompt of #Day27 of #30DayChartChallenge is #noise
I studied the #coffee bean production in Brazil and Columbia
#Rstats #ggplot #DataViz
@30daychartchall.bsky.social
I studied the #coffee bean production in Brazil and Columbia
#Rstats #ggplot #DataViz
@30daychartchall.bsky.social
#Day26 of #30DayChartChallenge has the prompt #monochrome
I studied the length of characters of animation movies in two time periods.
#Rstats #ggplot #DataViz
@30daychartchall.bsky.social
I studied the length of characters of animation movies in two time periods.
#Rstats #ggplot #DataViz
@30daychartchall.bsky.social

April 29, 2025 at 12:24 PM
#Day26 of #30DayChartChallenge has the prompt #monochrome
I studied the length of characters of animation movies in two time periods.
#Rstats #ggplot #DataViz
@30daychartchall.bsky.social
I studied the length of characters of animation movies in two time periods.
#Rstats #ggplot #DataViz
@30daychartchall.bsky.social
#Day25 of #30DayChartChallenge has the prompt #risk
I studied the death rates from cardiovascular diseases.
#ggplot #DataViz #Rstats
@30daychartchall.bsky.social
I studied the death rates from cardiovascular diseases.
#ggplot #DataViz #Rstats
@30daychartchall.bsky.social

April 28, 2025 at 7:46 PM
#Day25 of #30DayChartChallenge has the prompt #risk
I studied the death rates from cardiovascular diseases.
#ggplot #DataViz #Rstats
@30daychartchall.bsky.social
I studied the death rates from cardiovascular diseases.
#ggplot #DataViz #Rstats
@30daychartchall.bsky.social
#Day24 of #30DayChartChallenge is a data day. I studied the #maternal #mortality in Turkey.
#DataViz #ggplot #Rstats
@30daychartchall.bsky.social
#DataViz #ggplot #Rstats
@30daychartchall.bsky.social

April 27, 2025 at 8:32 PM
#Day24 of #30DayChartChallenge is a data day. I studied the #maternal #mortality in Turkey.
#DataViz #ggplot #Rstats
@30daychartchall.bsky.social
#DataViz #ggplot #Rstats
@30daychartchall.bsky.social
#Day23 of #30DayChartChallenge with #logscale
I used the data of same fossil fuel consumption with a longer time period.
#Rstats #ggplot #DataViz
@30daychartchall.bsky.social
I used the data of same fossil fuel consumption with a longer time period.
#Rstats #ggplot #DataViz
@30daychartchall.bsky.social

April 26, 2025 at 6:58 PM
#Day23 of #30DayChartChallenge with #logscale
I used the data of same fossil fuel consumption with a longer time period.
#Rstats #ggplot #DataViz
@30daychartchall.bsky.social
I used the data of same fossil fuel consumption with a longer time period.
#Rstats #ggplot #DataViz
@30daychartchall.bsky.social
#Day22 of #30DayChartChallenge with the prompt #stars
I studied the winners of #NBA #All-Stars for the 2000-2017 period.
#DataViz #ggplot #Rstats
@30daychartchall.bsky.social
I studied the winners of #NBA #All-Stars for the 2000-2017 period.
#DataViz #ggplot #Rstats
@30daychartchall.bsky.social
April 26, 2025 at 2:58 PM
#Day22 of #30DayChartChallenge with the prompt #stars
I studied the winners of #NBA #All-Stars for the 2000-2017 period.
#DataViz #ggplot #Rstats
@30daychartchall.bsky.social
I studied the winners of #NBA #All-Stars for the 2000-2017 period.
#DataViz #ggplot #Rstats
@30daychartchall.bsky.social
#Day21 of #30DayChartChallenge has the prompt of #fossils
I studied the fossil fuel consumption with #ggstream
#Rstats #ggplot #DataViz
@30daychartchall.bsky.social
I studied the fossil fuel consumption with #ggstream
#Rstats #ggplot #DataViz
@30daychartchall.bsky.social

April 25, 2025 at 8:51 PM
#Day21 of #30DayChartChallenge has the prompt of #fossils
I studied the fossil fuel consumption with #ggstream
#Rstats #ggplot #DataViz
@30daychartchall.bsky.social
I studied the fossil fuel consumption with #ggstream
#Rstats #ggplot #DataViz
@30daychartchall.bsky.social
#Day20 of #30DayChartChallenge with the #urbanization prompt
I studied the population of urban and rural areas in teh last 20 years.
#Rstats #ggplot #DataViz
@30daychartchall.bsky.social
I studied the population of urban and rural areas in teh last 20 years.
#Rstats #ggplot #DataViz
@30daychartchall.bsky.social
April 24, 2025 at 5:48 PM
#Day20 of #30DayChartChallenge with the #urbanization prompt
I studied the population of urban and rural areas in teh last 20 years.
#Rstats #ggplot #DataViz
@30daychartchall.bsky.social
I studied the population of urban and rural areas in teh last 20 years.
#Rstats #ggplot #DataViz
@30daychartchall.bsky.social
Late submission for #day19 with the theme #smooth
I visualized the number of deaths from natural disasters in Asia.
#DataViz #ggplot #Rstats #30DayChartChallenge
@30daychartchall.bsky.social
I visualized the number of deaths from natural disasters in Asia.
#DataViz #ggplot #Rstats #30DayChartChallenge
@30daychartchall.bsky.social

April 24, 2025 at 2:19 PM
Late submission for #day19 with the theme #smooth
I visualized the number of deaths from natural disasters in Asia.
#DataViz #ggplot #Rstats #30DayChartChallenge
@30daychartchall.bsky.social
I visualized the number of deaths from natural disasters in Asia.
#DataViz #ggplot #Rstats #30DayChartChallenge
@30daychartchall.bsky.social
#Day18 of #30DayChartChallenge is a theme day of #ElPais
I replicated the meat supply vs GDP plot of #OWID for regions
#Rstats #ggplot #DataViz
@30daychartchall.bsky.social
I replicated the meat supply vs GDP plot of #OWID for regions
#Rstats #ggplot #DataViz
@30daychartchall.bsky.social

April 18, 2025 at 2:22 PM
#Day18 of #30DayChartChallenge is a theme day of #ElPais
I replicated the meat supply vs GDP plot of #OWID for regions
#Rstats #ggplot #DataViz
@30daychartchall.bsky.social
I replicated the meat supply vs GDP plot of #OWID for regions
#Rstats #ggplot #DataViz
@30daychartchall.bsky.social
I tried and animated version for #Day17 of #30DayChartChallenge to show the ranks of habitats that the birds like.
#Rstats #ggplot #DataViz
@30daychartchall.bsky.social
#Rstats #ggplot #DataViz
@30daychartchall.bsky.social
April 18, 2025 at 12:18 PM
I tried and animated version for #Day17 of #30DayChartChallenge to show the ranks of habitats that the birds like.
#Rstats #ggplot #DataViz
@30daychartchall.bsky.social
#Rstats #ggplot #DataViz
@30daychartchall.bsky.social
#Day16 of #30DayChartChallenge is #negative
I studied the relationship between rainfall and sunshine duration in Ankara, TURKEY.
#Rstats #DataViz #ggplot @30daychartchall.bsky.social
I studied the relationship between rainfall and sunshine duration in Ankara, TURKEY.
#Rstats #DataViz #ggplot @30daychartchall.bsky.social

April 17, 2025 at 1:10 PM
#Day16 of #30DayChartChallenge is #negative
I studied the relationship between rainfall and sunshine duration in Ankara, TURKEY.
#Rstats #DataViz #ggplot @30daychartchall.bsky.social
I studied the relationship between rainfall and sunshine duration in Ankara, TURKEY.
#Rstats #DataViz #ggplot @30daychartchall.bsky.social
The #prompt for #Day15 is #complicated
I studied the total points received and given to countries in Eurovision.
#Rstats #ggplot #DataViz
@30daychartchall.bsky.social
I studied the total points received and given to countries in Eurovision.
#Rstats #ggplot #DataViz
@30daychartchall.bsky.social

April 16, 2025 at 10:37 AM
The #prompt for #Day15 is #complicated
I studied the total points received and given to countries in Eurovision.
#Rstats #ggplot #DataViz
@30daychartchall.bsky.social
I studied the total points received and given to countries in Eurovision.
#Rstats #ggplot #DataViz
@30daychartchall.bsky.social
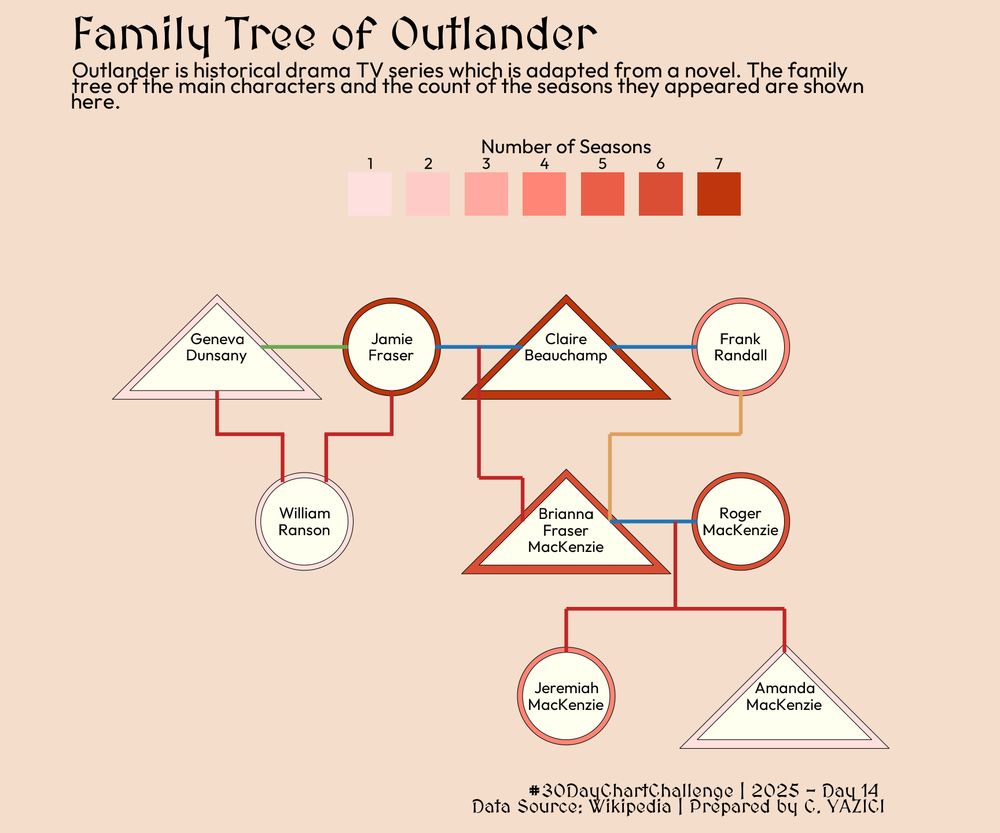
The #prompt for #day14 of #30DayChartChallenge is #kinship
I studied the basic family tree of #Outlander
#ggplot #DataViz #Rstats
@30daychartchall.bsky.social
I studied the basic family tree of #Outlander
#ggplot #DataViz #Rstats
@30daychartchall.bsky.social
April 15, 2025 at 2:56 PM
The #prompt for #day14 of #30DayChartChallenge is #kinship
I studied the basic family tree of #Outlander
#ggplot #DataViz #Rstats
@30daychartchall.bsky.social
I studied the basic family tree of #Outlander
#ggplot #DataViz #Rstats
@30daychartchall.bsky.social
The prompt for #day13 is #clusters and I again studied the #starbucks data. This time beverages are grouped into three clusters according to their nutritions.
#Rstats #ggplot #DataViz #30DayChartChallenge
@30daychartchall.bsky.social
#Rstats #ggplot #DataViz #30DayChartChallenge
@30daychartchall.bsky.social

April 14, 2025 at 2:49 PM
The prompt for #day13 is #clusters and I again studied the #starbucks data. This time beverages are grouped into three clusters according to their nutritions.
#Rstats #ggplot #DataViz #30DayChartChallenge
@30daychartchall.bsky.social
#Rstats #ggplot #DataViz #30DayChartChallenge
@30daychartchall.bsky.social
#Day12 of #30DayChartChallenge is data day. I used rounded stacked bar charts to visualize the film permits in boroughs of New York.
#DataViz #Rstats #ggplot
@30daychartchall.bsky.social
#DataViz #Rstats #ggplot
@30daychartchall.bsky.social

April 14, 2025 at 1:01 PM
#Day12 of #30DayChartChallenge is data day. I used rounded stacked bar charts to visualize the film permits in boroughs of New York.
#DataViz #Rstats #ggplot
@30daychartchall.bsky.social
#DataViz #Rstats #ggplot
@30daychartchall.bsky.social
#stripes for #day11 of #30DayChartChallenge
I used the same data set for precipitation anomalies from #owid
#DataViz #ggplot #Rstats
@30daychartchall.bsky.social
I used the same data set for precipitation anomalies from #owid
#DataViz #ggplot #Rstats
@30daychartchall.bsky.social

April 11, 2025 at 3:34 PM
#stripes for #day11 of #30DayChartChallenge
I used the same data set for precipitation anomalies from #owid
#DataViz #ggplot #Rstats
@30daychartchall.bsky.social
I used the same data set for precipitation anomalies from #owid
#DataViz #ggplot #Rstats
@30daychartchall.bsky.social