


CO2.Earth
@co2earth.bsky.social
The latest measurements of the most important GHG in the Earth’s air--3400 metres above sea level near the top of the Earth's largest mountain & the middle of its largest ocean.
Posts by Michael McGee, b. 318 ppm, creator of CO2.Earth.
Posts by Michael McGee, b. 318 ppm, creator of CO2.Earth.
428.44 ppm #CO2 in OUR PLANET'S AIR on Mar. 8 2025
📈 Up 2.34 ppm from 426.10 a year ago 📈
🌎 @NOAA Mauna Loa data: buff.ly/WzraZfS 🌎
🌎 Brought to you by CO2.Earth at buff.ly/GZJ8mbe 🌎
🙏 Let's keep this 350 overshoot brief 🙏
📈 Up 2.34 ppm from 426.10 a year ago 📈
🌎 @NOAA Mauna Loa data: buff.ly/WzraZfS 🌎
🌎 Brought to you by CO2.Earth at buff.ly/GZJ8mbe 🌎
🙏 Let's keep this 350 overshoot brief 🙏

March 9, 2025 at 3:24 PM
428.44 ppm #CO2 in OUR PLANET'S AIR on Mar. 8 2025
📈 Up 2.34 ppm from 426.10 a year ago 📈
🌎 @NOAA Mauna Loa data: buff.ly/WzraZfS 🌎
🌎 Brought to you by CO2.Earth at buff.ly/GZJ8mbe 🌎
🙏 Let's keep this 350 overshoot brief 🙏
📈 Up 2.34 ppm from 426.10 a year ago 📈
🌎 @NOAA Mauna Loa data: buff.ly/WzraZfS 🌎
🌎 Brought to you by CO2.Earth at buff.ly/GZJ8mbe 🌎
🙏 Let's keep this 350 overshoot brief 🙏
🏆📈🏆 FIRST TIME #CO2 SURPASSES 430 🏆📈🏆 430.60 ppm is the HIGHEST EVER CO2 in Earth’s atmosphere as of March 7, 2025 🏆 Up 5.24 ppm from 425.36 ppm a year ago 🏆 #NOAA Mauna Loa Obervatory data & graphic: gml.noaa.gov/ccgg/trends/... 🏆 Daily CO2.Earth records at: www.co2.earth/co2-records


March 9, 2025 at 5:44 AM
🏆📈🏆 FIRST TIME #CO2 SURPASSES 430 🏆📈🏆 430.60 ppm is the HIGHEST EVER CO2 in Earth’s atmosphere as of March 7, 2025 🏆 Up 5.24 ppm from 425.36 ppm a year ago 🏆 #NOAA Mauna Loa Obervatory data & graphic: gml.noaa.gov/ccgg/trends/... 🏆 Daily CO2.Earth records at: www.co2.earth/co2-records
Reposted by CO2.Earth
428.49 parts per million (ppm) CO2 in air 07-Mar-2025 keelingcurve.ucsd.edu

The Keeling Curve
The Keeling Curve is a daily record of global atmospheric carbon dioxide concentration maintained by Scripps Institution of Oceanography at UC San Diego.
keelingcurve.ucsd.edu
March 8, 2025 at 6:58 PM
428.49 parts per million (ppm) CO2 in air 07-Mar-2025 keelingcurve.ucsd.edu
Reposted by CO2.Earth
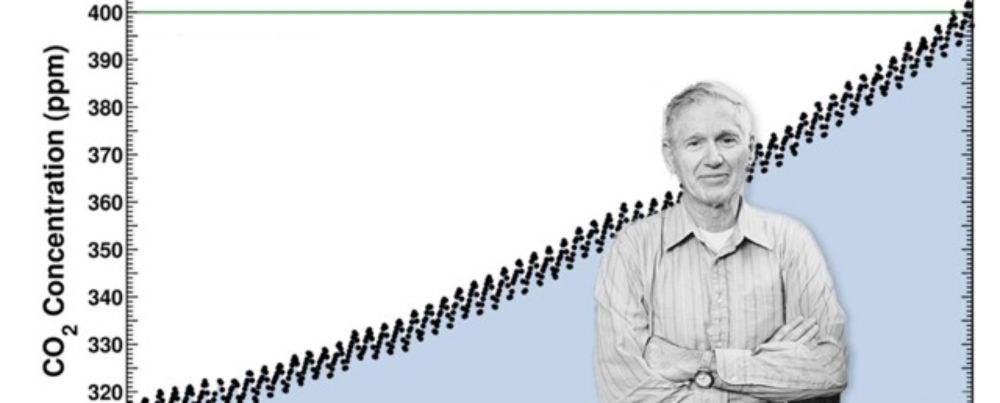
Our Ralph Keeling explains to @deutschewelle.bsky.social how CO2 measurements got started and why they are important in the new podcast 'What does 1 ton of CO2 look like' now available on the Living Planet #podcast. pod.link/livingplanet...
Living Planet
Looking to reconnect with nature? Want to make better decisions for the health of the planet? Every Friday, Living Planet brings you the stories, facts and debates on the key environmental issues of o...
pod.link
March 7, 2025 at 10:51 PM
Our Ralph Keeling explains to @deutschewelle.bsky.social how CO2 measurements got started and why they are important in the new podcast 'What does 1 ton of CO2 look like' now available on the Living Planet #podcast. pod.link/livingplanet...
Reposted by CO2.Earth
427.16 parts per million (ppm) CO2 in air 06-Mar-2025 keelingcurve.ucsd.edu
The Keeling Curve
The Keeling Curve is a daily record of global atmospheric carbon dioxide concentration maintained by Scripps Institution of Oceanography at UC San Diego.
keelingcurve.ucsd.edu
March 7, 2025 at 5:22 PM
427.16 parts per million (ppm) CO2 in air 06-Mar-2025 keelingcurve.ucsd.edu
Reposted by CO2.Earth
If you're in Austin, come visit!

Heading to #SXSW? Check out this panel featuring @keelingcurve.bsky.social PI Ralph Keeling that explores how scientists track CO2, developing tools designed to ‘bend the curve’ toward sustainability and the curiosity and collective action needed to get us there.
schedule.sxsw.com/2025/events/...
schedule.sxsw.com/2025/events/...

The Quest to Capture Carbon and Bend the Curve
SXSW 2025 Schedule | Carbon dioxide levels have been rising since the burning of fossil fuels began during the Industrial Revolution. This greenhouse gas is raising temperatures around the planet, alt...
schedule.sxsw.com
March 6, 2025 at 5:29 PM
If you're in Austin, come visit!
Reposted by CO2.Earth
427.43 parts per million (ppm) CO2 in air 05-Mar-2025 keelingcurve.ucsd.edu
The Keeling Curve
The Keeling Curve is a daily record of global atmospheric carbon dioxide concentration maintained by Scripps Institution of Oceanography at UC San Diego.
keelingcurve.ucsd.edu
March 6, 2025 at 5:20 PM
427.43 parts per million (ppm) CO2 in air 05-Mar-2025 keelingcurve.ucsd.edu
Reposted by CO2.Earth
427.38 parts per million (ppm) CO2 in air 03-Mar-2025
keelingcurve.ucsd.edu
keelingcurve.ucsd.edu
The Keeling Curve
The Keeling Curve is a daily record of global atmospheric carbon dioxide concentration maintained by Scripps Institution of Oceanography at UC San Diego.
keelingcurve.ucsd.edu
March 4, 2025 at 5:06 PM
427.38 parts per million (ppm) CO2 in air 03-Mar-2025
keelingcurve.ucsd.edu
keelingcurve.ucsd.edu
Reposted by CO2.Earth
426.97 parts per million (ppm) CO2 in air 02-Mar-2025 keelingcurve.ucsd.edu
The Keeling Curve
The Keeling Curve is a daily record of global atmospheric carbon dioxide concentration maintained by Scripps Institution of Oceanography at UC San Diego.
keelingcurve.ucsd.edu
March 3, 2025 at 5:12 PM
426.97 parts per million (ppm) CO2 in air 02-Mar-2025 keelingcurve.ucsd.edu
Reposted by CO2.Earth
426.64 parts per million (ppm) CO2 in air 01-Mar-2025
keelingcurve.ucsd.edu
keelingcurve.ucsd.edu
The Keeling Curve
The Keeling Curve is a daily record of global atmospheric carbon dioxide concentration maintained by Scripps Institution of Oceanography at UC San Diego.
keelingcurve.ucsd.edu
March 2, 2025 at 5:46 PM
426.64 parts per million (ppm) CO2 in air 01-Mar-2025
keelingcurve.ucsd.edu
keelingcurve.ucsd.edu
Reposted by CO2.Earth
Kudos to Bill McKibben for this piece on the story behind one of the icons of @scrippsocean.bsky.social science. www.newyorker.com/news/the-led...

Trump’s E.P.A. Seeks to Deny Science That Americans Discovered
It’s in this country that scientists, funded by or working for the government, came to understand the role of carbon in our atmosphere.
www.newyorker.com
March 2, 2025 at 5:38 PM
Kudos to Bill McKibben for this piece on the story behind one of the icons of @scrippsocean.bsky.social science. www.newyorker.com/news/the-led...
426.41 ppm #CO2 in OUR PLANET'S AIR on Jan. 5 2025
📈 Up 3.80 ppm from 422.61 a year ago 📈
🌎 NOAA Mauna Loa data: gml.noaa.gov/ccgg/trends/... 🌎
🌎 Brought to you by CO2.Earth at www.co2.earth/daily-co2 🌎
🙏 Let's keep this 350 overshoot brief 🙏

January 7, 2025 at 6:46 AM
426.41 ppm #CO2 in OUR PLANET'S AIR on Jan. 5 2025
📈 Up 3.80 ppm from 422.61 a year ago 📈
🌎 NOAA Mauna Loa data: gml.noaa.gov/ccgg/trends/... 🌎
🌎 Brought to you by CO2.Earth at www.co2.earth/daily-co2 🌎
🙏 Let's keep this 350 overshoot brief 🙏
Reposted by CO2.Earth
425.87 parts per million (ppm) CO2 in air 05-Jan-2025 keelingcurve.ucsd.edu
The Keeling Curve
The Keeling Curve is a daily record of global atmospheric carbon dioxide concentration maintained by Scripps Institution of Oceanography at UC San Diego.
keelingcurve.ucsd.edu
January 6, 2025 at 5:06 PM
425.87 parts per million (ppm) CO2 in air 05-Jan-2025 keelingcurve.ucsd.edu
Reposted by CO2.Earth
425.87 parts per million (ppm) CO2 in air 04-Jan-2025 keelingcurve.ucsd.edu
The Keeling Curve
The Keeling Curve is a daily record of global atmospheric carbon dioxide concentration maintained by Scripps Institution of Oceanography at UC San Diego.
keelingcurve.ucsd.edu
January 5, 2025 at 9:33 PM
425.87 parts per million (ppm) CO2 in air 04-Jan-2025 keelingcurve.ucsd.edu
426.03 ppm #CO2 in OUR PLANET'S AIR on Jan. 4 2025
📈 Up 3.66 ppm from 422.37 a year ago 📈
🌎 NOAA Mauna Loa data: gml.noaa.gov/ccgg/trends/... 🌎
🌎 Brought to you by CO2.Earth at www.co2.earth/daily-co2 🌎
🙏 Let's keep this 350 overshoot brief 🙏

January 5, 2025 at 7:09 PM
426.03 ppm #CO2 in OUR PLANET'S AIR on Jan. 4 2025
📈 Up 3.66 ppm from 422.37 a year ago 📈
🌎 NOAA Mauna Loa data: gml.noaa.gov/ccgg/trends/... 🌎
🌎 Brought to you by CO2.Earth at www.co2.earth/daily-co2 🌎
🙏 Let's keep this 350 overshoot brief 🙏
426.13 ppm #CO2 in OUR PLANET'S AIR on Jan. 3 2025
📈 Up 3.76 ppm from 422.37 a year ago 📈
🌎 NOAA Mauna Loa data: gml.noaa.gov/ccgg/trends/... 🌎
🌎 Brought to you by CO2.Earth at www.co2.earth/daily-co2 🌎
🙏 Let's keep this 350 overshoot brief 🙏
📈 Up 3.76 ppm from 422.37 a year ago 📈
🌎 NOAA Mauna Loa data: gml.noaa.gov/ccgg/trends/... 🌎
🌎 Brought to you by CO2.Earth at www.co2.earth/daily-co2 🌎
🙏 Let's keep this 350 overshoot brief 🙏

January 5, 2025 at 5:30 AM
426.13 ppm #CO2 in OUR PLANET'S AIR on Jan. 3 2025
📈 Up 3.76 ppm from 422.37 a year ago 📈
🌎 NOAA Mauna Loa data: gml.noaa.gov/ccgg/trends/... 🌎
🌎 Brought to you by CO2.Earth at www.co2.earth/daily-co2 🌎
🙏 Let's keep this 350 overshoot brief 🙏
📈 Up 3.76 ppm from 422.37 a year ago 📈
🌎 NOAA Mauna Loa data: gml.noaa.gov/ccgg/trends/... 🌎
🌎 Brought to you by CO2.Earth at www.co2.earth/daily-co2 🌎
🙏 Let's keep this 350 overshoot brief 🙏
Reposted by CO2.Earth
426.16 parts per million (ppm) CO2 in air 02-Jan-2025 keelingcurve.UCSD.edu
The Keeling Curve
The Keeling Curve is a daily record of global atmospheric carbon dioxide concentration maintained by Scripps Institution of Oceanography at UC San Diego.
keelingcurve.UCSD.edu
January 3, 2025 at 9:01 PM
426.16 parts per million (ppm) CO2 in air 02-Jan-2025 keelingcurve.UCSD.edu
Reposted by CO2.Earth
425.78 parts per million (ppm) CO2 in air 03-Jan-2025 keelingcurve.ucsd.edu
The Keeling Curve
The Keeling Curve is a daily record of global atmospheric carbon dioxide concentration maintained by Scripps Institution of Oceanography at UC San Diego.
keelingcurve.ucsd.edu
January 4, 2025 at 5:33 PM
425.78 parts per million (ppm) CO2 in air 03-Jan-2025 keelingcurve.ucsd.edu
427.16 ppm #CO2 in OUR PLANET'S AIR on Dec. 31 2024
📈 Up 4.83 ppm from 422.33 a year ago 📈
🌎 NOAA Mauna Loa data: gml.noaa.gov/ccgg/trends/... 🌎
🌎 Brought to you by CO2.Earth at www.co2.earth/daily-co2 🌎
🙏 Let's keep this 350 overshoot brief 🙏
📈 Up 4.83 ppm from 422.33 a year ago 📈
🌎 NOAA Mauna Loa data: gml.noaa.gov/ccgg/trends/... 🌎
🌎 Brought to you by CO2.Earth at www.co2.earth/daily-co2 🌎
🙏 Let's keep this 350 overshoot brief 🙏

January 2, 2025 at 4:52 AM
427.16 ppm #CO2 in OUR PLANET'S AIR on Dec. 31 2024
📈 Up 4.83 ppm from 422.33 a year ago 📈
🌎 NOAA Mauna Loa data: gml.noaa.gov/ccgg/trends/... 🌎
🌎 Brought to you by CO2.Earth at www.co2.earth/daily-co2 🌎
🙏 Let's keep this 350 overshoot brief 🙏
📈 Up 4.83 ppm from 422.33 a year ago 📈
🌎 NOAA Mauna Loa data: gml.noaa.gov/ccgg/trends/... 🌎
🌎 Brought to you by CO2.Earth at www.co2.earth/daily-co2 🌎
🙏 Let's keep this 350 overshoot brief 🙏
Reposted by CO2.Earth
425.74 parts per million (ppm) CO2 in air 30-Dec-2024 keelingcurve.ucsd.edu
The Keeling Curve
The Keeling Curve is a daily record of global atmospheric carbon dioxide concentration maintained by Scripps Institution of Oceanography at UC San Diego.
keelingcurve.ucsd.edu
December 31, 2024 at 8:13 PM
425.74 parts per million (ppm) CO2 in air 30-Dec-2024 keelingcurve.ucsd.edu
Reposted by CO2.Earth
Readings for the past several days have been unavailable because of a problem with a server. Technicians are troubleshooting the issue now and we hope to resume reporting of daily readings as soon as possible.
December 30, 2024 at 7:42 PM
Readings for the past several days have been unavailable because of a problem with a server. Technicians are troubleshooting the issue now and we hope to resume reporting of daily readings as soon as possible.
🌎 425.59 ppm #CO2 in the planet's air in the last week of 2024 🌎
📈 Up from 421.75 for the week one year ago📈
🔗 NOAA Mauna Loa weekly data: gml.noaa.gov/ccgg/trends/... 🔗
🔄 CO2.Earth distribution: www.co2.earth/weekly-co2 & www.show.earth/the-weekly-co2-tracker-for-web 🔄
📈 Up from 421.75 for the week one year ago📈
🔗 NOAA Mauna Loa weekly data: gml.noaa.gov/ccgg/trends/... 🔗
🔄 CO2.Earth distribution: www.co2.earth/weekly-co2 & www.show.earth/the-weekly-co2-tracker-for-web 🔄

December 30, 2024 at 2:57 PM
🌎 425.59 ppm #CO2 in the planet's air in the last week of 2024 🌎
📈 Up from 421.75 for the week one year ago📈
🔗 NOAA Mauna Loa weekly data: gml.noaa.gov/ccgg/trends/... 🔗
🔄 CO2.Earth distribution: www.co2.earth/weekly-co2 & www.show.earth/the-weekly-co2-tracker-for-web 🔄
📈 Up from 421.75 for the week one year ago📈
🔗 NOAA Mauna Loa weekly data: gml.noaa.gov/ccgg/trends/... 🔗
🔄 CO2.Earth distribution: www.co2.earth/weekly-co2 & www.show.earth/the-weekly-co2-tracker-for-web 🔄
425.33 ppm #CO2 in OUR PLANET'S AIR on Dec. 29 2024
📈 Up 3.88 ppm from 421.55 a year ago 📈
🌎 NOAA Mauna Loa data: gml.noaa.gov/ccgg/trends/... 🌎
🌎 Brought to you by CO2.Earth at www.co2.earth/daily-co2 🌎
🙏 Let's keep this 350 overshoot brief 🙏

December 30, 2024 at 2:40 PM
425.33 ppm #CO2 in OUR PLANET'S AIR on Dec. 29 2024
📈 Up 3.88 ppm from 421.55 a year ago 📈
🌎 NOAA Mauna Loa data: gml.noaa.gov/ccgg/trends/... 🌎
🌎 Brought to you by CO2.Earth at www.co2.earth/daily-co2 🌎
🙏 Let's keep this 350 overshoot brief 🙏
Reposted by CO2.Earth
425.23 parts per million (ppm) CO2 in air 24-Dec-2024 keelingcurve.ucsd.edu
The Keeling Curve
The Keeling Curve is a daily record of global atmospheric carbon dioxide concentration maintained by Scripps Institution of Oceanography at UC San Diego.
keelingcurve.ucsd.edu
December 25, 2024 at 9:13 PM
425.23 parts per million (ppm) CO2 in air 24-Dec-2024 keelingcurve.ucsd.edu
Reposted by CO2.Earth
425.21 parts per million (ppm) CO2 in air 23-Dec-2024 keelingcurve.ucsd.edu
The Keeling Curve
The Keeling Curve is a daily record of global atmospheric carbon dioxide concentration maintained by Scripps Institution of Oceanography at UC San Diego.
keelingcurve.ucsd.edu
December 24, 2024 at 5:08 PM
425.21 parts per million (ppm) CO2 in air 23-Dec-2024 keelingcurve.ucsd.edu