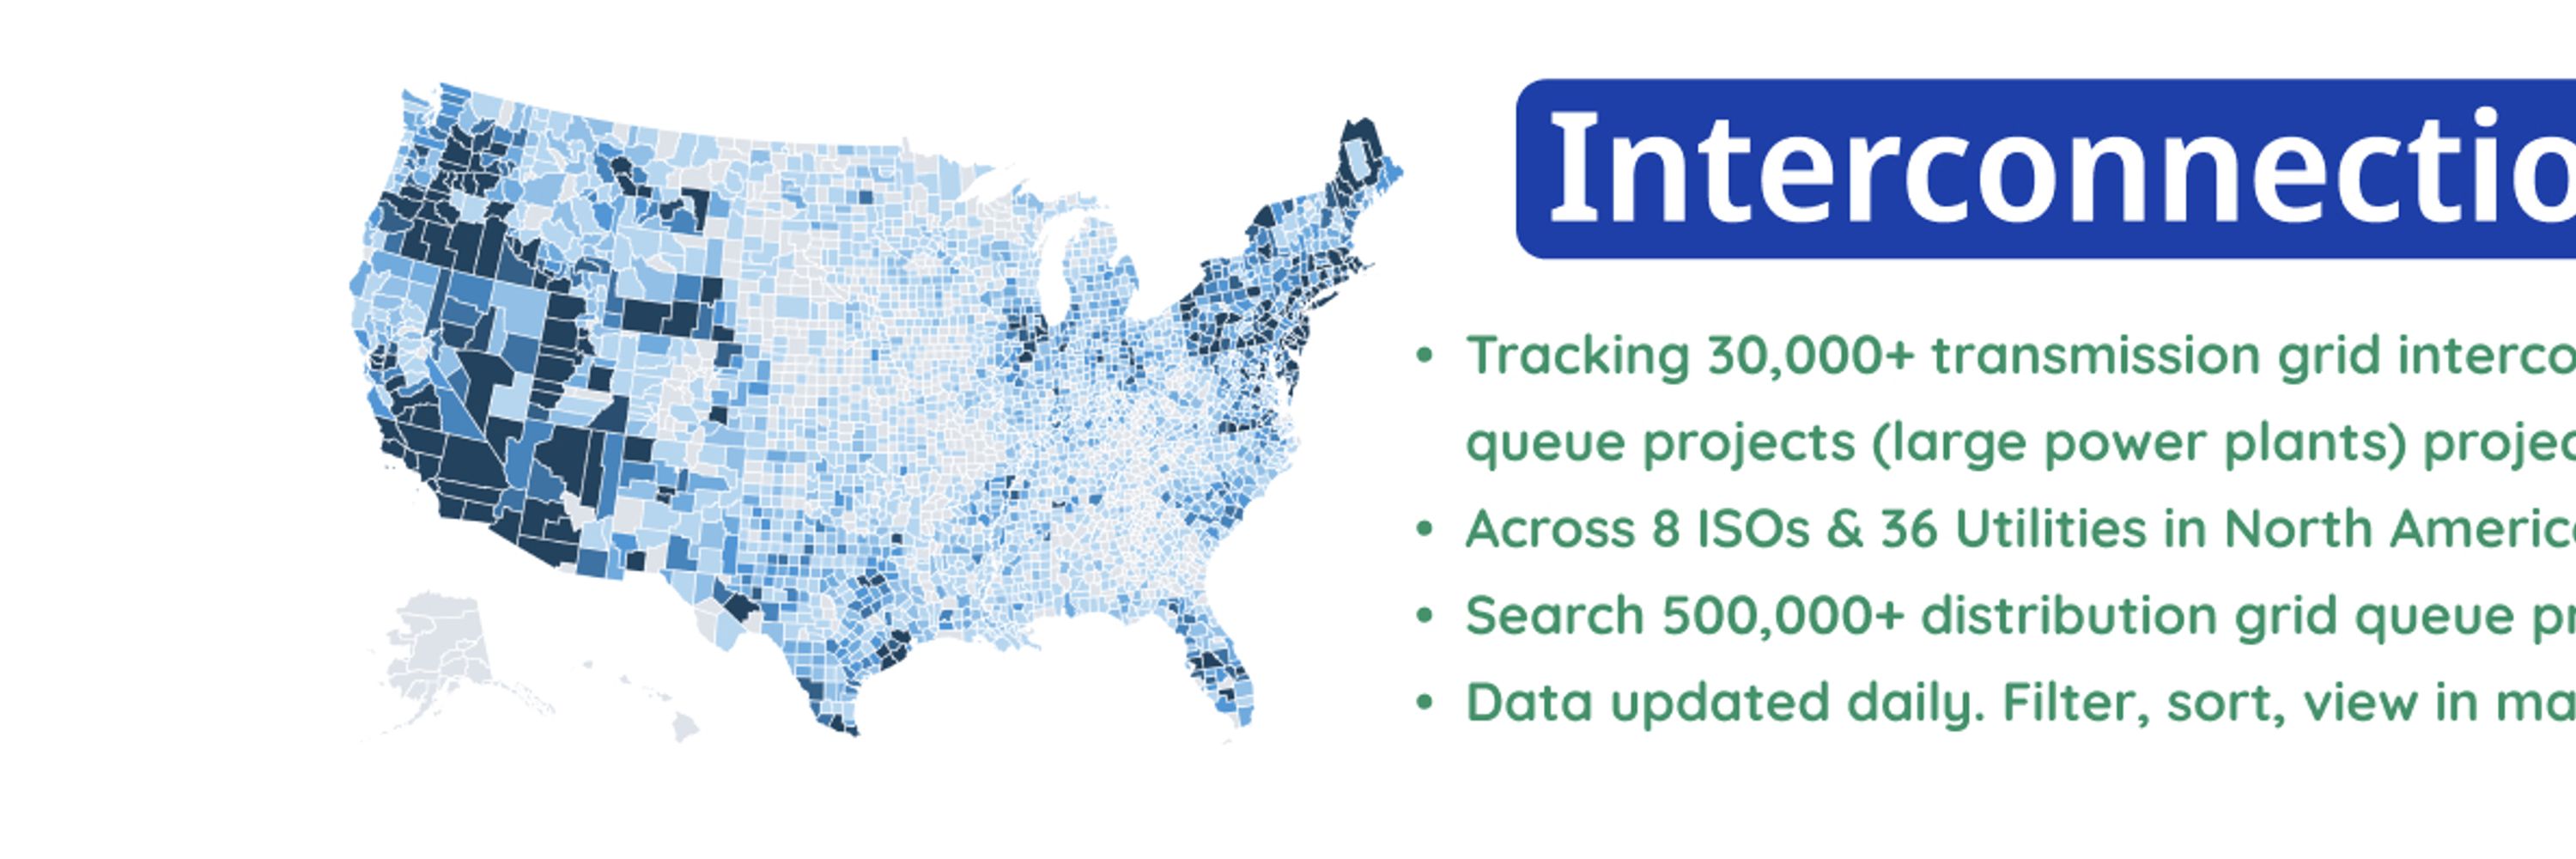
Steven Zhang
@climatetech.bsky.social
Creator of ClimateTechList.com, interconnection.fyi , BostonClimateTech.com, WARNtracker.com
Previously: @Airtable, @Tableau, @FulbrightPrgrm
researching factories & environment.
https://twitter.com/steven_q_zhang
https://linkedin.com/in/stevenqzhang
Previously: @Airtable, @Tableau, @FulbrightPrgrm
researching factories & environment.
https://twitter.com/steven_q_zhang
https://linkedin.com/in/stevenqzhang
Reposted by Steven Zhang
This is fantastic news. Congratulations to all the activists who have fought so hard for this for so many years! This means positive transformations not just for Cambridge but for the entire region. If you had a hand in this, cheers.
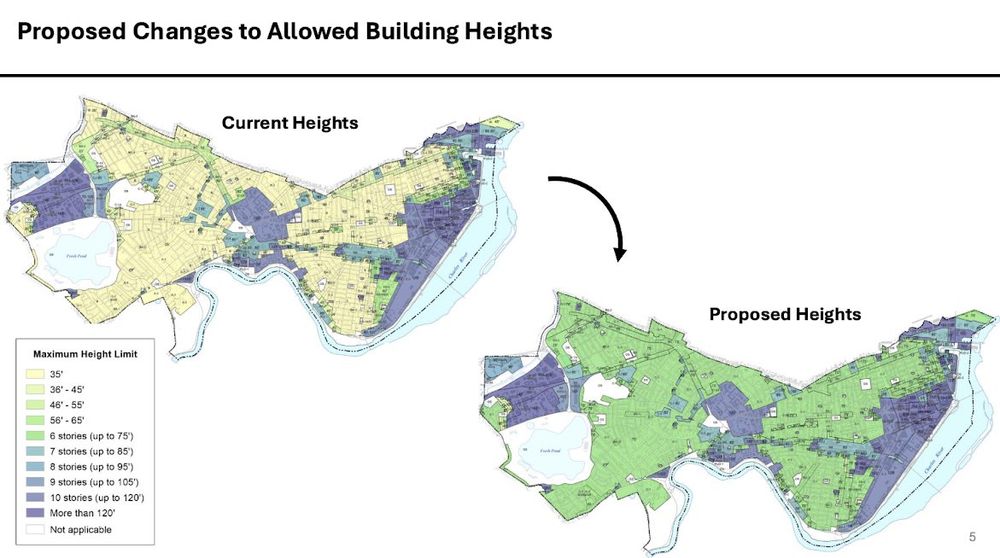
Cambridge, MA, has just made it legal to build housing anywhere in the city as tall as a typical Parisian building (6 floors), potentially allowing the city to grow by 170%!
February 11, 2025 at 4:38 AM
This is fantastic news. Congratulations to all the activists who have fought so hard for this for so many years! This means positive transformations not just for Cambridge but for the entire region. If you had a hand in this, cheers.
Reposted by Steven Zhang
I can’t believe it - after years of advocacy, exclusionary zoning has ended in Cambridge.
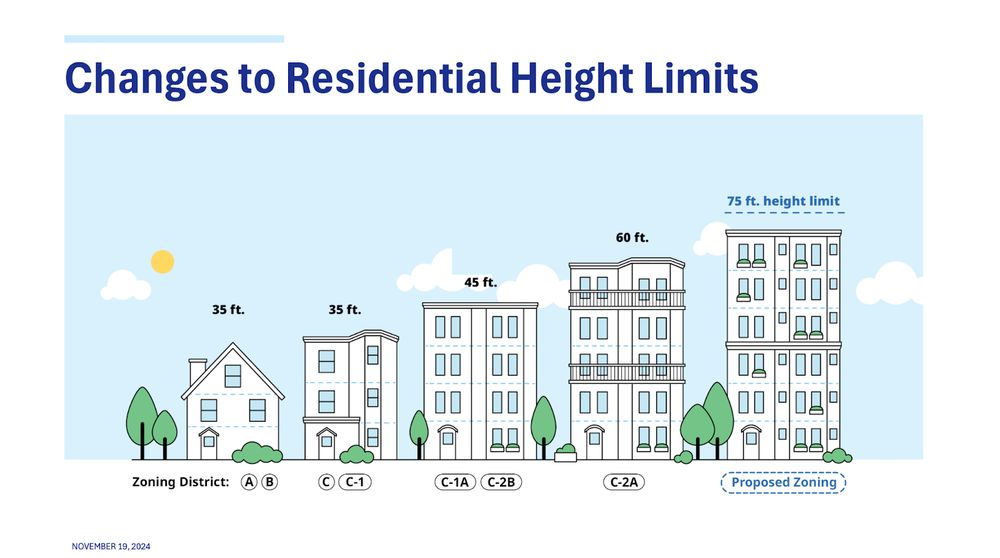
We just passed the single most comprehensive rezoning in the US—legalizing multifamily housing up to 6 stories citywide in a Paris style
Here’s the details 🧵
We just passed the single most comprehensive rezoning in the US—legalizing multifamily housing up to 6 stories citywide in a Paris style
Here’s the details 🧵
February 11, 2025 at 1:46 AM
I can’t believe it - after years of advocacy, exclusionary zoning has ended in Cambridge.
We just passed the single most comprehensive rezoning in the US—legalizing multifamily housing up to 6 stories citywide in a Paris style
Here’s the details 🧵
We just passed the single most comprehensive rezoning in the US—legalizing multifamily housing up to 6 stories citywide in a Paris style
Here’s the details 🧵
My @snipd.bsky.social unwrapped for this year: Can you tell it was an election year 😬😬😬?
P.S. In case you are curious, this is my workflow for using snipd as my main podcast player -> double tapping airpods to take a note -> sending notes to Readwise: www.quora.com/How-do-you-t...
P.S. In case you are curious, this is my workflow for using snipd as my main podcast player -> double tapping airpods to take a note -> sending notes to Readwise: www.quora.com/How-do-you-t...


December 19, 2024 at 2:27 PM
My @snipd.bsky.social unwrapped for this year: Can you tell it was an election year 😬😬😬?
P.S. In case you are curious, this is my workflow for using snipd as my main podcast player -> double tapping airpods to take a note -> sending notes to Readwise: www.quora.com/How-do-you-t...
P.S. In case you are curious, this is my workflow for using snipd as my main podcast player -> double tapping airpods to take a note -> sending notes to Readwise: www.quora.com/How-do-you-t...
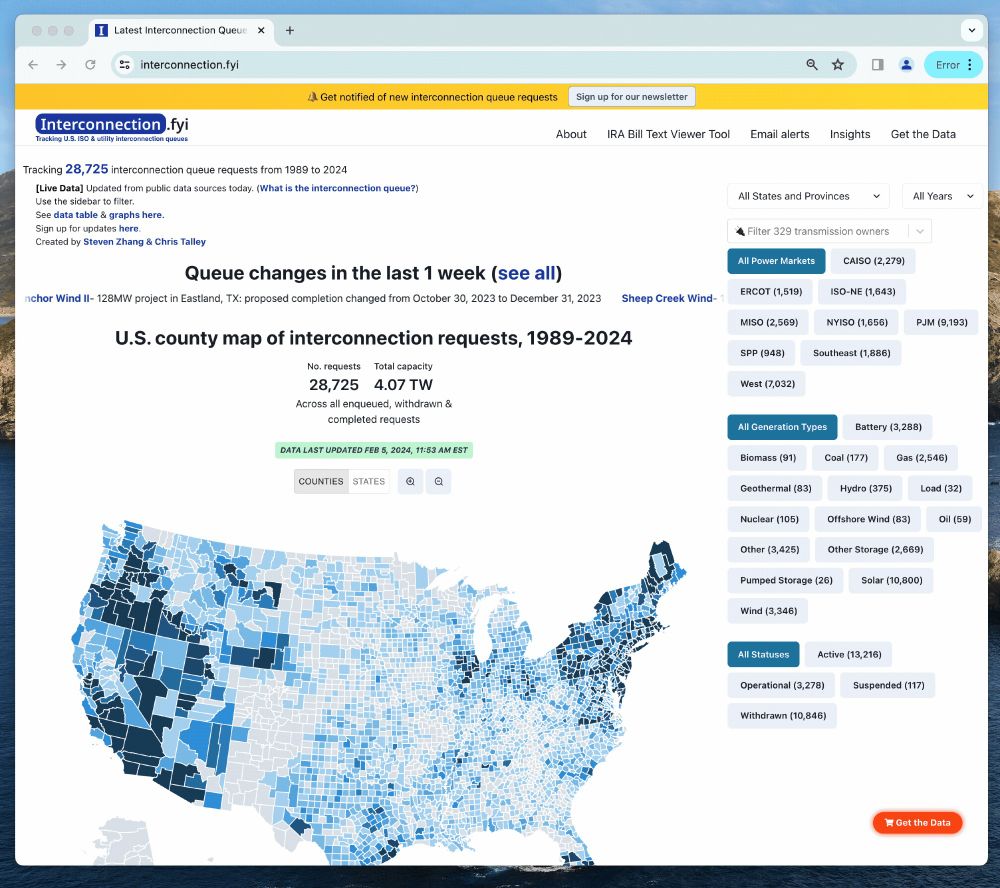
✨ Feature announcement ✨ - interconnection.fyi now shows all queue changes within the last week. We already pull data from all ISOs and 20 utilities at least once a day, this feature will allow you to see the most recent changes as well.
February 5, 2024 at 7:42 PM
✨ Feature announcement ✨ - interconnection.fyi now shows all queue changes within the last week. We already pull data from all ISOs and 20 utilities at least once a day, this feature will allow you to see the most recent changes as well.
See more charts (and interactive charts) at
our "State of Interconnection queue, Jane 2024" blog post here: www.interconnection.fyi/blog/state-o...
Ping me if you want to see a specific chart created!
our "State of Interconnection queue, Jane 2024" blog post here: www.interconnection.fyi/blog/state-o...
Ping me if you want to see a specific chart created!
State of interconnection queues — January 2024 - WARNTracker.com Blog
An analysis of the state of interconnection queues across 6 RTOs/ISOs and 20 utilities in the U.S.
www.interconnection.fyi
January 22, 2024 at 4:46 PM
See more charts (and interactive charts) at
our "State of Interconnection queue, Jane 2024" blog post here: www.interconnection.fyi/blog/state-o...
Ping me if you want to see a specific chart created!
our "State of Interconnection queue, Jane 2024" blog post here: www.interconnection.fyi/blog/state-o...
Ping me if you want to see a specific chart created!
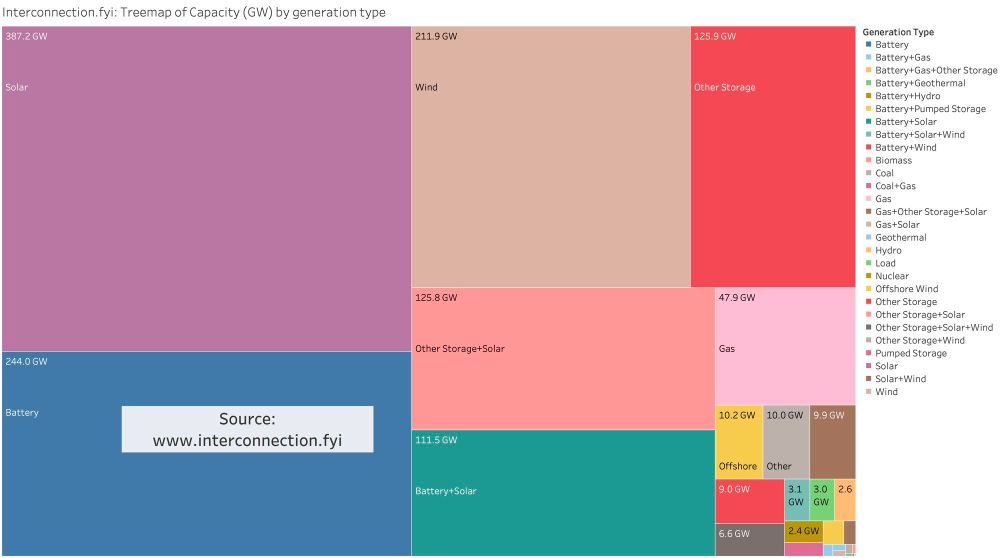
- Breakdown by generation type of in-queue capacity
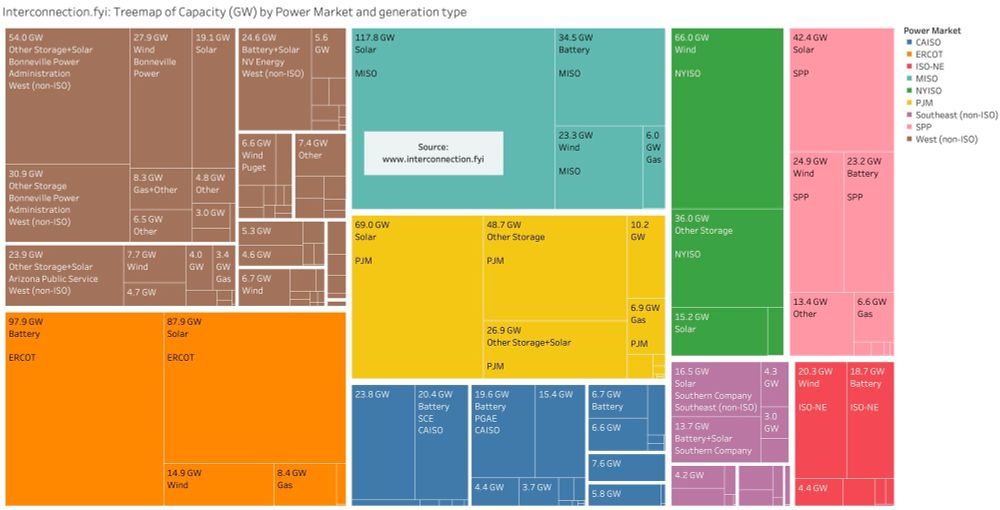
- Breakdown by generation type and power market
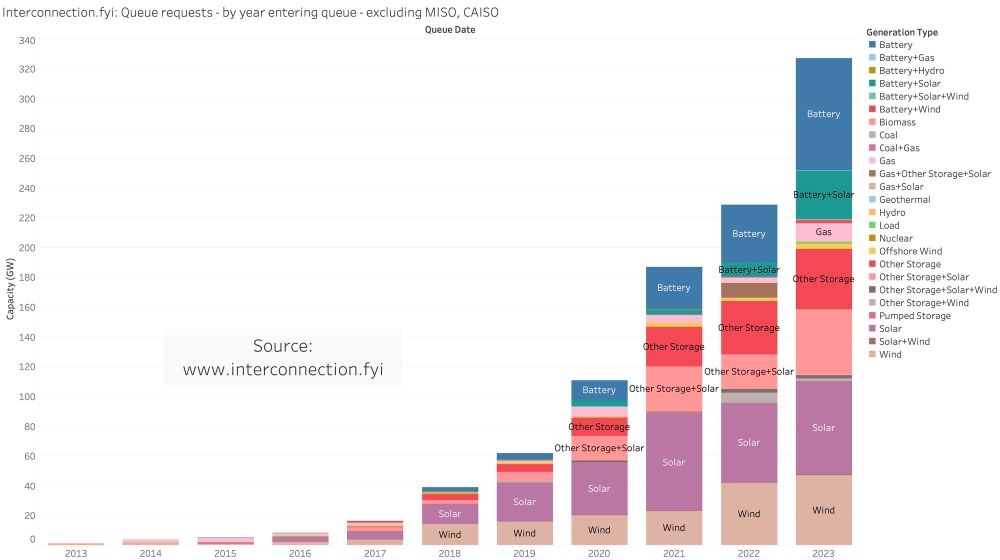
- Planned capacity entering the queue in 2023 declined after several years of growth (most of this can be attributed to MISO and CAISO's stopping taking requests)
- Breakdown by generation type and power market
- Planned capacity entering the queue in 2023 declined after several years of growth (most of this can be attributed to MISO and CAISO's stopping taking requests)
January 22, 2024 at 4:44 PM
- Breakdown by generation type of in-queue capacity
- Breakdown by generation type and power market
- Planned capacity entering the queue in 2023 declined after several years of growth (most of this can be attributed to MISO and CAISO's stopping taking requests)
- Breakdown by generation type and power market
- Planned capacity entering the queue in 2023 declined after several years of growth (most of this can be attributed to MISO and CAISO's stopping taking requests)
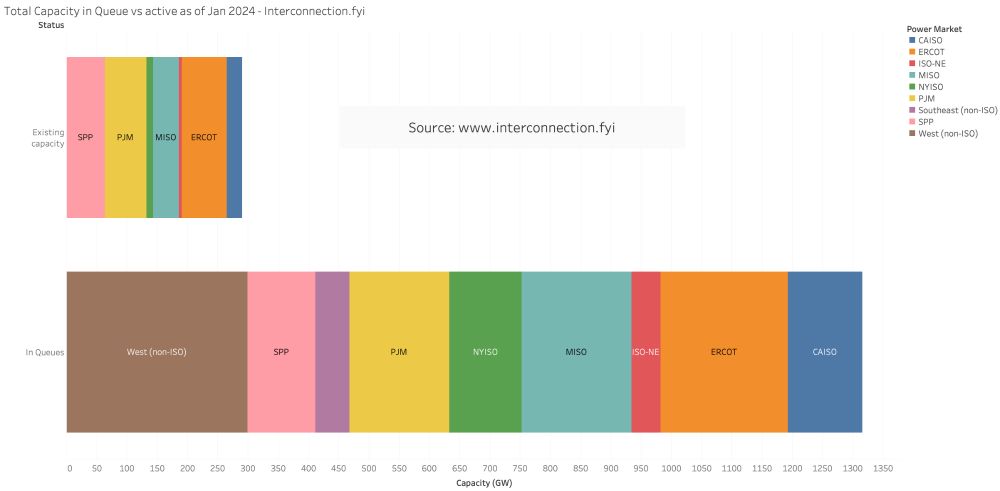
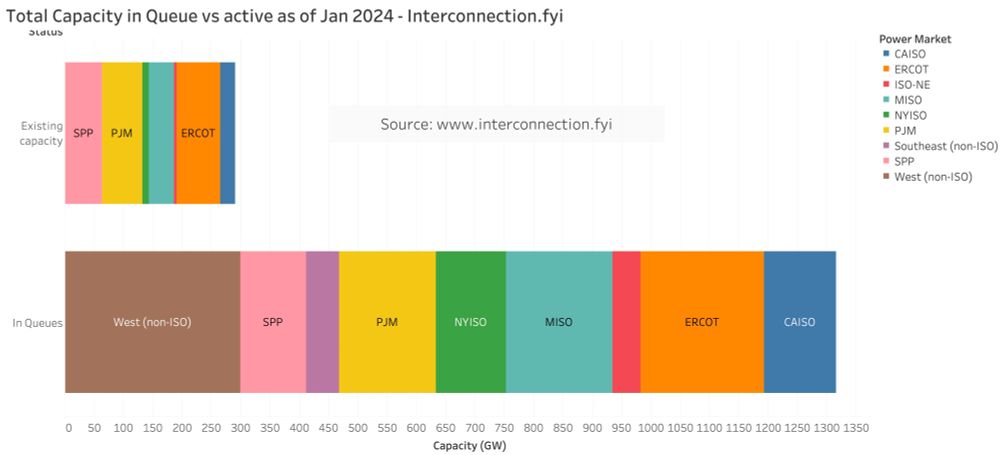
State of interconnection queues- Jan 2024
At least 1.3 TW of capacity in queues (300 GW currently in operation).
Source: interconnection.fyi aggregates interconnection queue data across all the major RTOS and 20 utilities in the U.S. with daily updates.
(more charts follow)
At least 1.3 TW of capacity in queues (300 GW currently in operation).
Source: interconnection.fyi aggregates interconnection queue data across all the major RTOS and 20 utilities in the U.S. with daily updates.
(more charts follow)
January 22, 2024 at 4:43 PM
State of interconnection queues- Jan 2024
At least 1.3 TW of capacity in queues (300 GW currently in operation).
Source: interconnection.fyi aggregates interconnection queue data across all the major RTOS and 20 utilities in the U.S. with daily updates.
(more charts follow)
At least 1.3 TW of capacity in queues (300 GW currently in operation).
Source: interconnection.fyi aggregates interconnection queue data across all the major RTOS and 20 utilities in the U.S. with daily updates.
(more charts follow)
Reposted by Steven Zhang
Energysky, check out this cool tool my friend Steven made - see interconnect queues in real time!
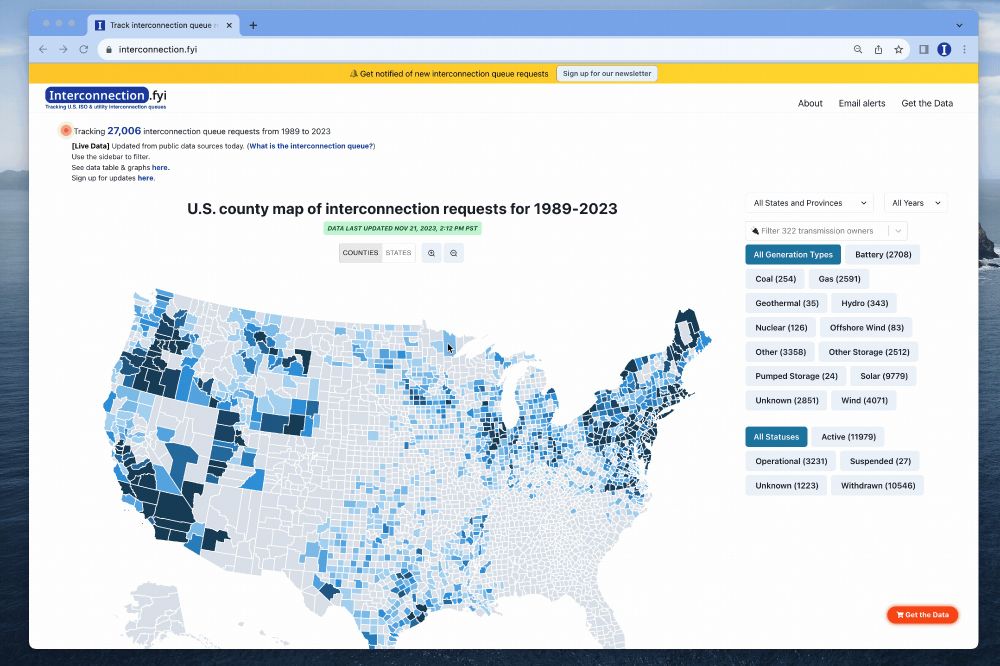
I keep reading about how interconnection queues are a big impediment to clean energy deployment. I made a site to track interconnection queues across all the ISOs and a few utilities as well. Data is updated daily.
LMK what you think! interconnection.fyi
#interconnection #energy #climate
LMK what you think! interconnection.fyi
#interconnection #energy #climate
November 22, 2023 at 4:30 PM
Energysky, check out this cool tool my friend Steven made - see interconnect queues in real time!
I keep reading about how interconnection queues are a big impediment to clean energy deployment. I made a site to track interconnection queues across all the ISOs and a few utilities as well. Data is updated daily.
LMK what you think! interconnection.fyi
#interconnection #energy #climate
LMK what you think! interconnection.fyi
#interconnection #energy #climate

November 22, 2023 at 4:19 PM
I keep reading about how interconnection queues are a big impediment to clean energy deployment. I made a site to track interconnection queues across all the ISOs and a few utilities as well. Data is updated daily.
LMK what you think! interconnection.fyi
#interconnection #energy #climate
LMK what you think! interconnection.fyi
#interconnection #energy #climate

