Cathy Clerbaux
banner
cathyclerbaux.bsky.social
Cathy Clerbaux
@cathyclerbaux.bsky.social

Physicist; Senior Scientist @ CNRS; Invited professor @ ULB
Satellite remote sensing expert

Environmental science 47%
Geology 19%

Hurricane Melissa passing over the Caribbean, as seen by the IASI satellite, which “observes” cloud temperatures. Winds exceeded 250 mph!

Methane (CH4) is a greenhouse gas. You've all heard that cow farts contribute to global warming, but it's actually cow burps that release CH4...

There you go, the ozone hole that returns every year, but is no longer growing. Proof that international environmental regulations work!
On the left are temperatures in the polar vortex, on the right are ozone concentrations for the last 30 days.

IASI-NG - Day 8: Engineers found this image in the launch videos! The raptor survived 😀

Hi Corwin. Yes ! Phoebe gave a GREAT seminar. I am still in Boulder. Will contact you when my new PhD starts, in October. He already worked on GW during its intership, with IASI. IASI-NG will be better as it has an improved S/N. But it will take months (9?) before we get the data. We keep in touch.

Metop-SG was launched last night by Ariane 6, with the IASI-NG infrared remote sensor onboard !

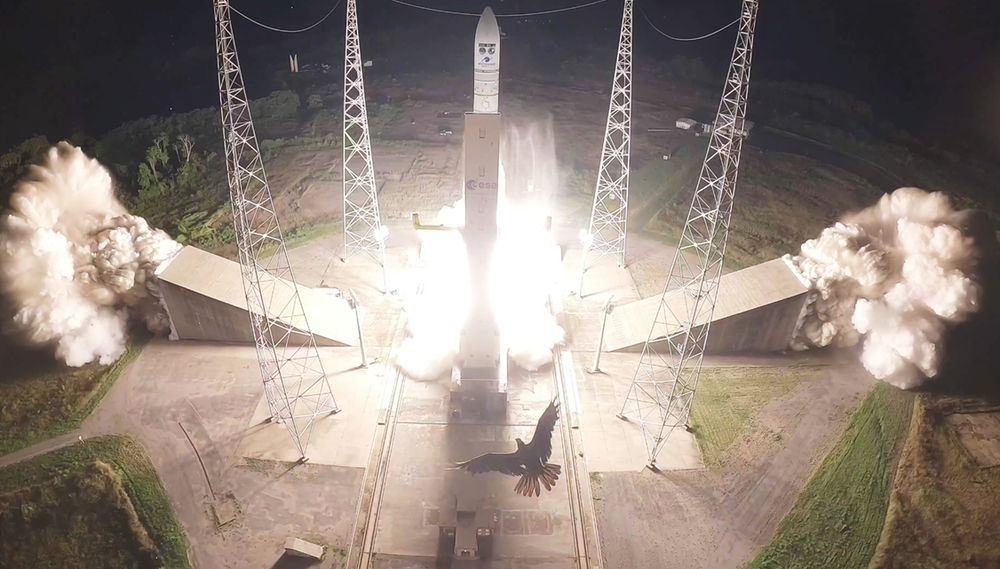
It is the continuation of the IASI program launched 18 years ago. See our best-of here : youtu.be/87LoUXFBjx8
New discoveries to be expected, as the instrument has better instrumental specifications.
IASI Best of [2025]
YouTube video by Cathy Clerbaux
youtu.be

Reposted by Cathy Clerbaux

Why are Europe and the Arctic warming twice as fast as the global average? Explore the science behind these regional trends in our latest article.
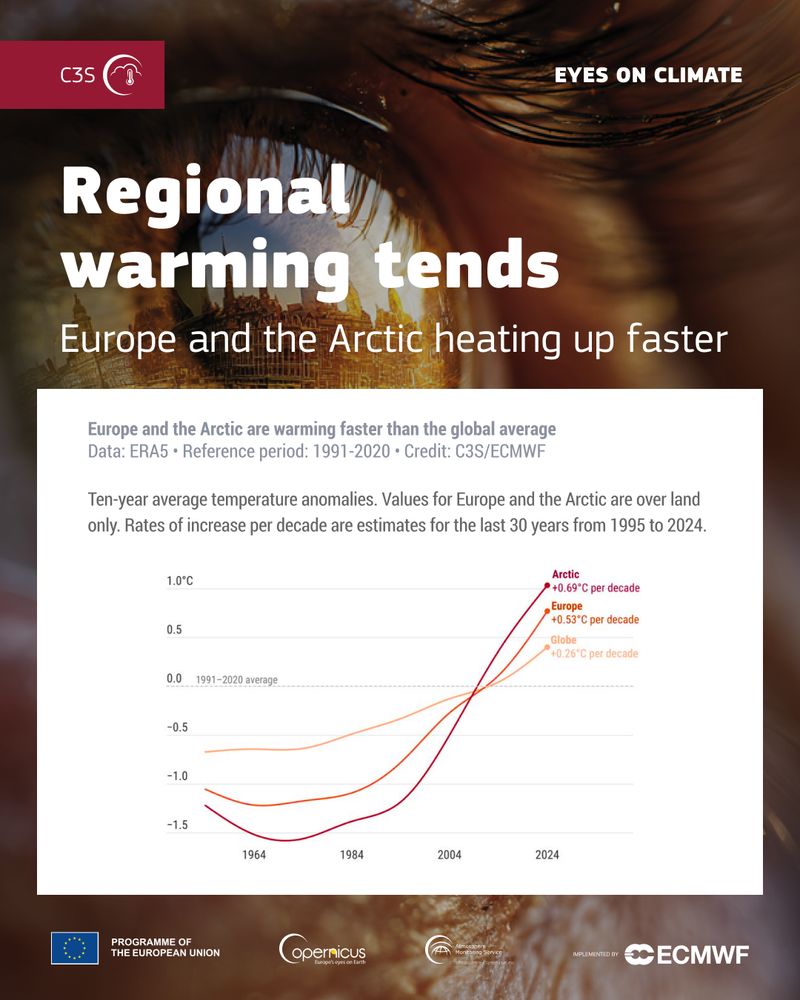
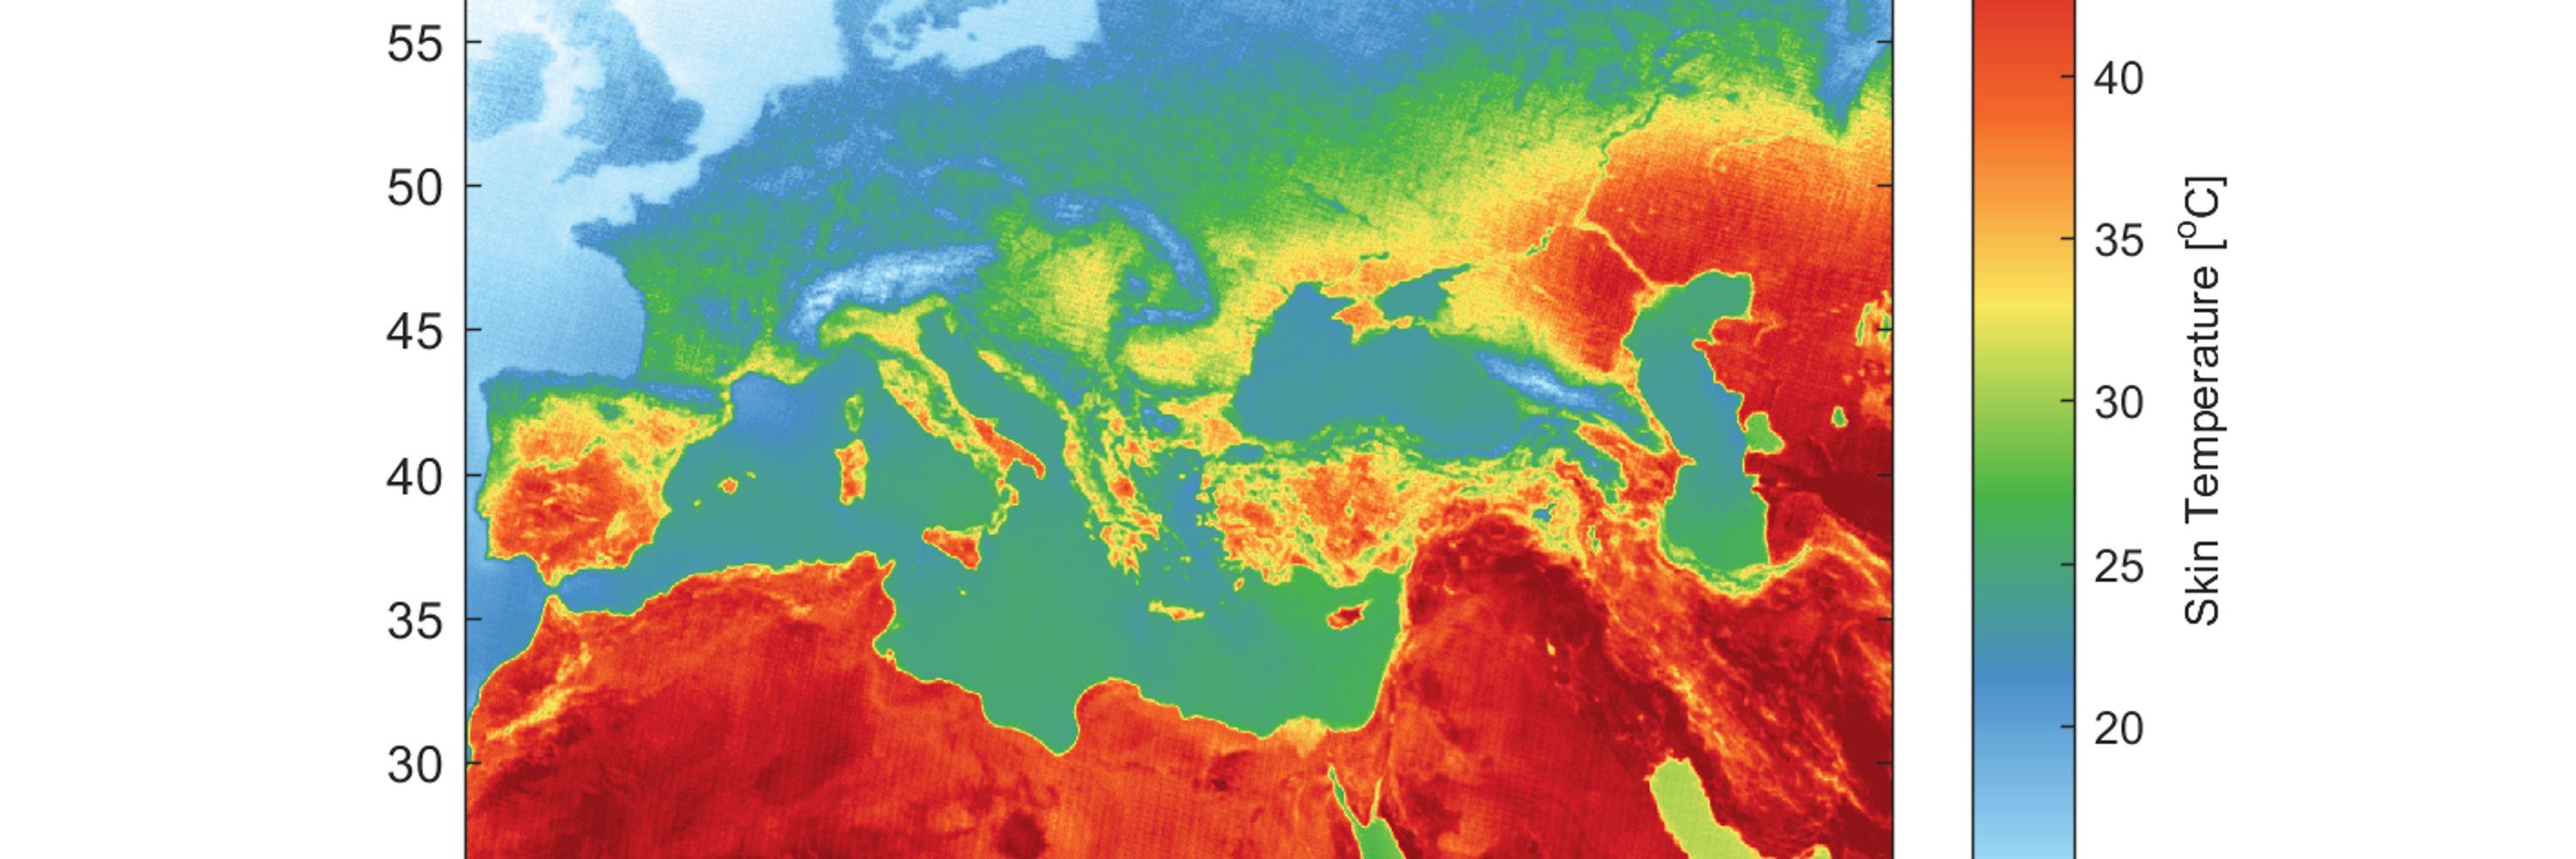
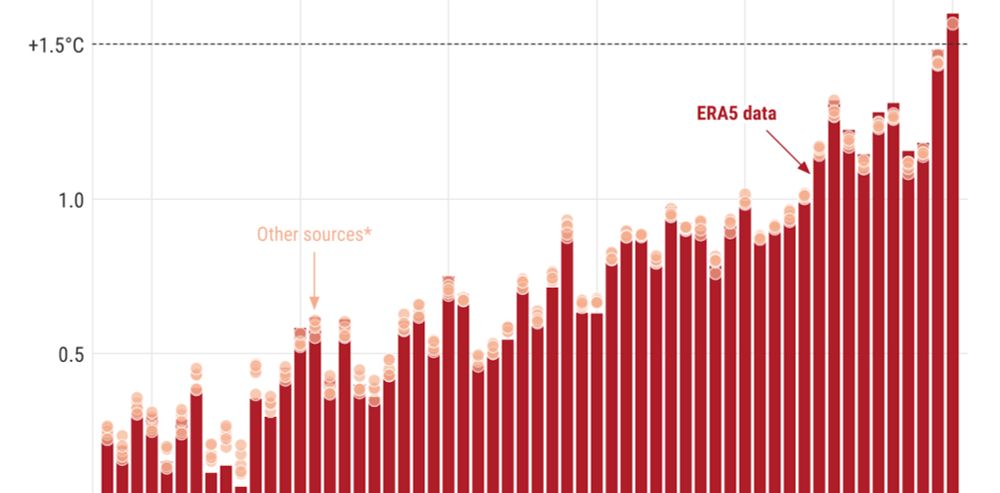
climate.copernicus.eu/why-are-euro...

#CopernicusClimate

A look back at the exceptional heatwave at the end of June/beginning of July in France and Belgium: > 35°C measured at ground level for a week, that's 6-8°C higher than the average for the previous 15 years on the same dates.

A very sunny June in Europe, as seen from space

Guess how much of the ocean floor humans have visually explored?

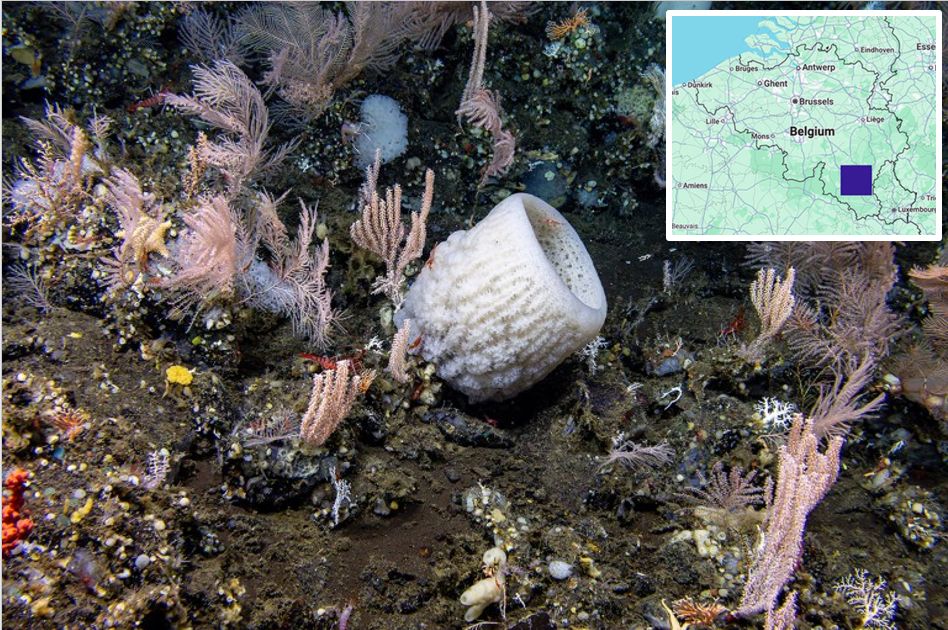
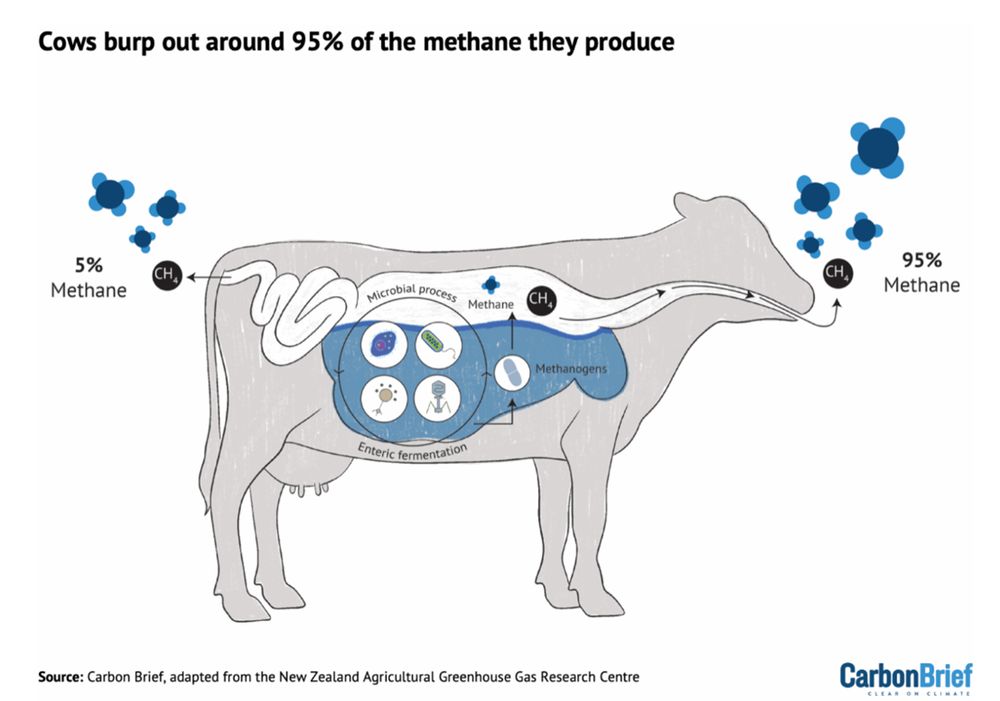
Less than 0.001%, the size of the blue square shown on the map of Belgium in the image below. More in this paper : www.science.org/doi/10.1126/...

A good summary of the media speculations for the recent electricity black out here : www.carbonbrief.org/qa-what-we-d...

These 2 maps compare mortality in urban areas in Europe, between 2015 and 2099, for an “optimistic” and a “pessimistic” scenario. In green, the lives gained where it will be less cold; in purple, the excess mortality due to heat peaks. It's the Mediterranean region that's taking the biggest hit.

It's not moving fast enough, but it's heading in the right direction...

The 1.6°C temperature increase recorded in 2024 is a bit puzzling... more in this paper (in French): theconversation.com/pourquoi-le-...
Pourquoi le record de températures en 2024 est une surprise pour les scientifiques
Les températures records mesurées en 2024 ne s’expliquent que partiellement par les activités humaines émettrices de gaz à effet de serre. Celles-ci surprennent jusqu’aux scientifiques.
theconversation.com

There are around 600 active volcanoes, with some 60 eruptions recorded every year. This image shows the sulfur dioxide (SO2) emitted by 4 volcanoes and carried by the winds, as observed by satellite in November.

Reposted by Cathy Clerbaux

[RDV 16h !] #Ozone, molécule paradoxale. Stratosphérique, elle protège des rayons UV. Troposphérique, elle nuit à la santé humaine. Comment l’étudie-t-on dans ces différentes couches ? Où en est le fameux "trou" ? tinyurl.com/232uqj5n avec Sophie Godin-Beekmann et @cathyclerbaux.bsky.social

Cold drop in Valencia, as seen by the IASI thermal infrared satellite