


@adamplatform.bsky.social
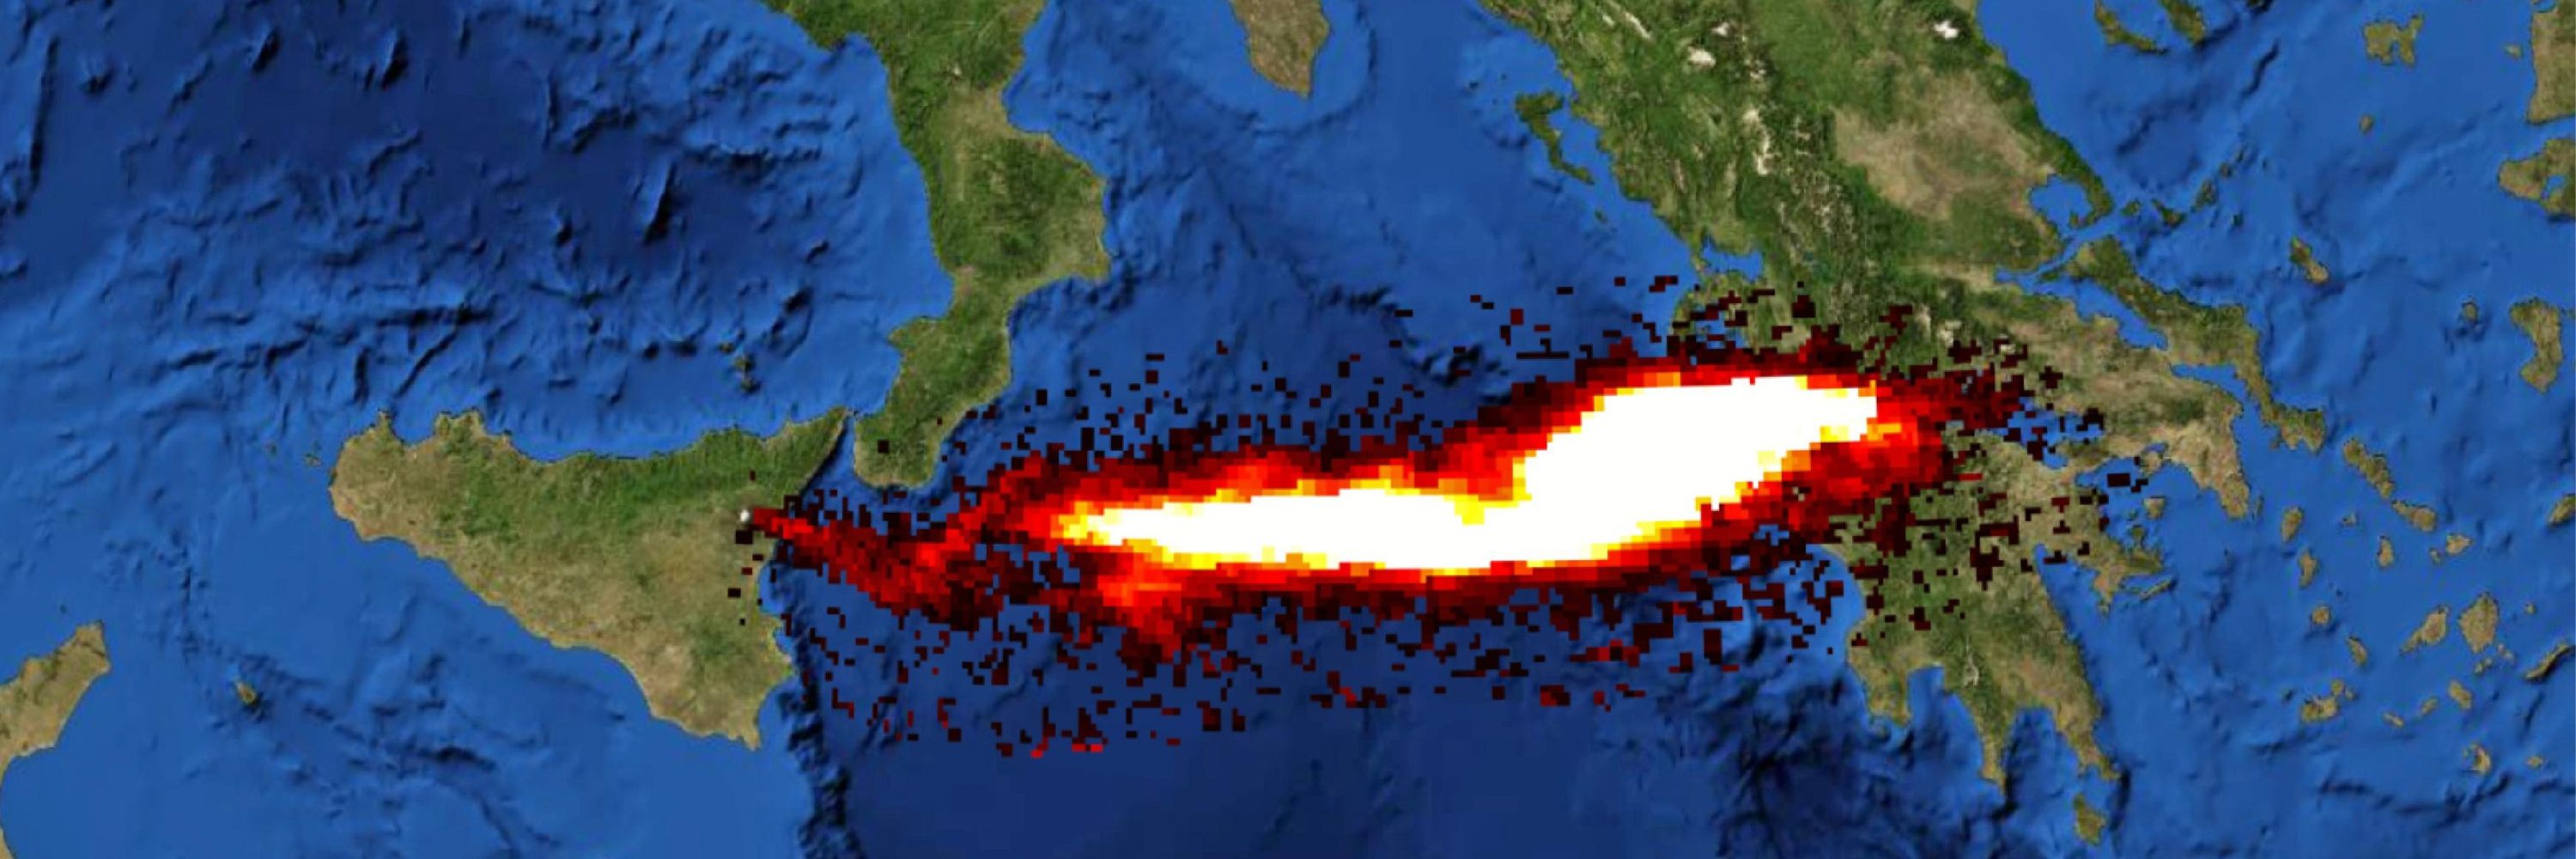
A high-load dust plume from #Africa moved eastward toward #Europe.
The transport was reinforced by the system’s dynamics and peaked on Feb. 15th, affecting parts of #Greece. The #Copernicus #Sentinel3 image shows the dust transport during the event. #Airquality #SaharanDust
The transport was reinforced by the system’s dynamics and peaked on Feb. 15th, affecting parts of #Greece. The #Copernicus #Sentinel3 image shows the dust transport during the event. #Airquality #SaharanDust

February 16, 2026 at 3:09 PM
A high-load dust plume from #Africa moved eastward toward #Europe.
The transport was reinforced by the system’s dynamics and peaked on Feb. 15th, affecting parts of #Greece. The #Copernicus #Sentinel3 image shows the dust transport during the event. #Airquality #SaharanDust
The transport was reinforced by the system’s dynamics and peaked on Feb. 15th, affecting parts of #Greece. The #Copernicus #Sentinel3 image shows the dust transport during the event. #Airquality #SaharanDust
Spectacular view of the #Alps during the Winter #Olympics2026!
The first cloud free image from the #Copernicus #Sentinel3 shows a breathtaking perspective with the difference in #snow cover on the peaks between east and west, after the recent snowfalls. #Olimpiadilnvernali2026
The first cloud free image from the #Copernicus #Sentinel3 shows a breathtaking perspective with the difference in #snow cover on the peaks between east and west, after the recent snowfalls. #Olimpiadilnvernali2026

February 13, 2026 at 6:24 PM
Spectacular view of the #Alps during the Winter #Olympics2026!
The first cloud free image from the #Copernicus #Sentinel3 shows a breathtaking perspective with the difference in #snow cover on the peaks between east and west, after the recent snowfalls. #Olimpiadilnvernali2026
The first cloud free image from the #Copernicus #Sentinel3 shows a breathtaking perspective with the difference in #snow cover on the peaks between east and west, after the recent snowfalls. #Olimpiadilnvernali2026
#ERA5 data show January 2026 was wetter than average across much of west/south/east #Europe. Heavy rainfall caused flooding and major disruption in #Spain and #Portugal because of the cyclones, #Italy, west. Balkans & #Ireland. The map highlights the monthly anomaly. #Copernicus

February 11, 2026 at 4:01 PM
#Mozambique is facing its worst #floods in decades. Nearly 700,000 people have been affected, over 100 are dead and many remain missing. Homes and critical infrastructure have been destroyed.
The video shows #Copernicus #Sentinel2 before and after the #flood. #climateemergency
The video shows #Copernicus #Sentinel2 before and after the #flood. #climateemergency
February 2, 2026 at 3:52 PM
#Mozambique is facing its worst #floods in decades. Nearly 700,000 people have been affected, over 100 are dead and many remain missing. Homes and critical infrastructure have been destroyed.
The video shows #Copernicus #Sentinel2 before and after the #flood. #climateemergency
The video shows #Copernicus #Sentinel2 before and after the #flood. #climateemergency
Aftermath of #Storm #Harry along the coast of #Catania, #Italy.
The video shows the coastline before and after the event seen by #Copernicus #Sentinel2: the seafront devastated, massive discharges into the sea, and powerful waves reshaping the shore. #climateemergency #Sicilia
The video shows the coastline before and after the event seen by #Copernicus #Sentinel2: the seafront devastated, massive discharges into the sea, and powerful waves reshaping the shore. #climateemergency #Sicilia
January 24, 2026 at 2:19 PM
Aftermath of #Storm #Harry along the coast of #Catania, #Italy.
The video shows the coastline before and after the event seen by #Copernicus #Sentinel2: the seafront devastated, massive discharges into the sea, and powerful waves reshaping the shore. #climateemergency #Sicilia
The video shows the coastline before and after the event seen by #Copernicus #Sentinel2: the seafront devastated, massive discharges into the sea, and powerful waves reshaping the shore. #climateemergency #Sicilia
#Storm #Harry, which devastated parts of #Sicily, #Calabria and #Sardinia causing damage and evacuations, seen from space.
On 20 January, #Copernicus #Sentinel3 captured the #cyclone’s arrival over southern #Italy, along with a significant transport of #Saharandust from #Africa. #severeweather
On 20 January, #Copernicus #Sentinel3 captured the #cyclone’s arrival over southern #Italy, along with a significant transport of #Saharandust from #Africa. #severeweather

January 21, 2026 at 6:16 PM
#Storm #Harry, which devastated parts of #Sicily, #Calabria and #Sardinia causing damage and evacuations, seen from space.
On 20 January, #Copernicus #Sentinel3 captured the #cyclone’s arrival over southern #Italy, along with a significant transport of #Saharandust from #Africa. #severeweather
On 20 January, #Copernicus #Sentinel3 captured the #cyclone’s arrival over southern #Italy, along with a significant transport of #Saharandust from #Africa. #severeweather
#Chile has declared a state of catastrophe as #wildfires killed already 18 people.
The #Copernicus #Sentinel5P Aerosol Index map shows a huge smoke plume of more than 1200 km, fueled by strong winds and extreme heat. #ClimateEmergency #incendioforestales
The #Copernicus #Sentinel5P Aerosol Index map shows a huge smoke plume of more than 1200 km, fueled by strong winds and extreme heat. #ClimateEmergency #incendioforestales

January 19, 2026 at 4:41 PM
#Chile has declared a state of catastrophe as #wildfires killed already 18 people.
The #Copernicus #Sentinel5P Aerosol Index map shows a huge smoke plume of more than 1200 km, fueled by strong winds and extreme heat. #ClimateEmergency #incendioforestales
The #Copernicus #Sentinel5P Aerosol Index map shows a huge smoke plume of more than 1200 km, fueled by strong winds and extreme heat. #ClimateEmergency #incendioforestales
Red globe! According to #ERA5 data, 2025 was the third warmest year on record. The @CopernicusECMWF report confirms that the world is experiencing the warmest decade ever.
The average surface temperature in #Europe was 1.17°C above the reference periode. #ClimateEmergency
The average surface temperature in #Europe was 1.17°C above the reference periode. #ClimateEmergency

January 15, 2026 at 3:07 PM
Red globe! According to #ERA5 data, 2025 was the third warmest year on record. The @CopernicusECMWF report confirms that the world is experiencing the warmest decade ever.
The average surface temperature in #Europe was 1.17°C above the reference periode. #ClimateEmergency
The average surface temperature in #Europe was 1.17°C above the reference periode. #ClimateEmergency
Recent severe weather events, including the latest storm Goretti has blanketed most of Northern #Europe.
On Jan 11, #Copernicus #Sentinel3 captured this amazing (almost) cloud-free view from space, with whole #Germany on stage. #stormGoretti #severeweather
On Jan 11, #Copernicus #Sentinel3 captured this amazing (almost) cloud-free view from space, with whole #Germany on stage. #stormGoretti #severeweather

January 12, 2026 at 5:40 PM
Recent severe weather events, including the latest storm Goretti has blanketed most of Northern #Europe.
On Jan 11, #Copernicus #Sentinel3 captured this amazing (almost) cloud-free view from space, with whole #Germany on stage. #stormGoretti #severeweather
On Jan 11, #Copernicus #Sentinel3 captured this amazing (almost) cloud-free view from space, with whole #Germany on stage. #stormGoretti #severeweather
A stunning image of snow in #EmiliaRomagna and #Tuscany.
#Copernicus #Sentinel2 captured on Jan. 7th this view, wich also reveals a glimpse of the Tyrrhenian coast. #Italy #snow #Toscana
#Copernicus #Sentinel2 captured on Jan. 7th this view, wich also reveals a glimpse of the Tyrrhenian coast. #Italy #snow #Toscana

January 8, 2026 at 6:07 PM
A stunning image of snow in #EmiliaRomagna and #Tuscany.
#Copernicus #Sentinel2 captured on Jan. 7th this view, wich also reveals a glimpse of the Tyrrhenian coast. #Italy #snow #Toscana
#Copernicus #Sentinel2 captured on Jan. 7th this view, wich also reveals a glimpse of the Tyrrhenian coast. #Italy #snow #Toscana
Satellite view of a snow-covered #Europe, almost entirely cloud-free and gripped by freezing temperatures. ❄️
#Copernicus #Sentinel3 captured this spectacular scene yesterday, January 6th. #snowfall #severeweather #France #England #Netherland
#Copernicus #Sentinel3 captured this spectacular scene yesterday, January 6th. #snowfall #severeweather #France #England #Netherland

January 7, 2026 at 6:13 PM
Satellite view of a snow-covered #Europe, almost entirely cloud-free and gripped by freezing temperatures. ❄️
#Copernicus #Sentinel3 captured this spectacular scene yesterday, January 6th. #snowfall #severeweather #France #England #Netherland
#Copernicus #Sentinel3 captured this spectacular scene yesterday, January 6th. #snowfall #severeweather #France #England #Netherland
Floods in #Indonesia.
The animation shows the impact of severe inundation in the northeastern part of #Sumatra, comparing #Copernicus #Sentinel2 images from Aug. and Dec. 1, 2025.
Relentless monsoon rains and tropical cyclones have devastated parts of Asia. #ClimateEmergency
The animation shows the impact of severe inundation in the northeastern part of #Sumatra, comparing #Copernicus #Sentinel2 images from Aug. and Dec. 1, 2025.
Relentless monsoon rains and tropical cyclones have devastated parts of Asia. #ClimateEmergency
December 3, 2025 at 2:17 PM
Floods in #Indonesia.
The animation shows the impact of severe inundation in the northeastern part of #Sumatra, comparing #Copernicus #Sentinel2 images from Aug. and Dec. 1, 2025.
Relentless monsoon rains and tropical cyclones have devastated parts of Asia. #ClimateEmergency
The animation shows the impact of severe inundation in the northeastern part of #Sumatra, comparing #Copernicus #Sentinel2 images from Aug. and Dec. 1, 2025.
Relentless monsoon rains and tropical cyclones have devastated parts of Asia. #ClimateEmergency
An impressive view of the long SO₂ plume from the #HayliGubbi #volcano eruption in #Ethiopia.
The #Copernicus #Sentinel5P map of Nov. 25th shows its trajectory stretching from #Africa all the way across #India and #China for more than 6000 km. #AirQuality
The #Copernicus #Sentinel5P map of Nov. 25th shows its trajectory stretching from #Africa all the way across #India and #China for more than 6000 km. #AirQuality

November 26, 2025 at 3:43 PM
An impressive view of the long SO₂ plume from the #HayliGubbi #volcano eruption in #Ethiopia.
The #Copernicus #Sentinel5P map of Nov. 25th shows its trajectory stretching from #Africa all the way across #India and #China for more than 6000 km. #AirQuality
The #Copernicus #Sentinel5P map of Nov. 25th shows its trajectory stretching from #Africa all the way across #India and #China for more than 6000 km. #AirQuality
The eruption after thousand of years of #HayliGubbi #volcano in #Ethiopia.
According to analyses, part of the eruptive column from the eruption may have reached an altitude between 18 and 20 km.
The #Copernicus #Sentinel5p image on Nov. 23 shows the big plume moving eastward.
According to analyses, part of the eruptive column from the eruption may have reached an altitude between 18 and 20 km.
The #Copernicus #Sentinel5p image on Nov. 23 shows the big plume moving eastward.

November 24, 2025 at 5:29 PM
The eruption after thousand of years of #HayliGubbi #volcano in #Ethiopia.
According to analyses, part of the eruptive column from the eruption may have reached an altitude between 18 and 20 km.
The #Copernicus #Sentinel5p image on Nov. 23 shows the big plume moving eastward.
According to analyses, part of the eruptive column from the eruption may have reached an altitude between 18 and 20 km.
The #Copernicus #Sentinel5p image on Nov. 23 shows the big plume moving eastward.
Impressive view of the floods in #FriuliVeneziaGiulia.
Severe flooding has hit parts of #Udine and #Gorizia.
The #Copernicus #Sentinel2 image on Nov. 18 shows the aftermath of the recent events: large amounts of debris flowing from the Isonzo River into the Adriatic Sea. #climateemergency
Severe flooding has hit parts of #Udine and #Gorizia.
The #Copernicus #Sentinel2 image on Nov. 18 shows the aftermath of the recent events: large amounts of debris flowing from the Isonzo River into the Adriatic Sea. #climateemergency

November 20, 2025 at 4:37 PM
Impressive view of the floods in #FriuliVeneziaGiulia.
Severe flooding has hit parts of #Udine and #Gorizia.
The #Copernicus #Sentinel2 image on Nov. 18 shows the aftermath of the recent events: large amounts of debris flowing from the Isonzo River into the Adriatic Sea. #climateemergency
Severe flooding has hit parts of #Udine and #Gorizia.
The #Copernicus #Sentinel2 image on Nov. 18 shows the aftermath of the recent events: large amounts of debris flowing from the Isonzo River into the Adriatic Sea. #climateemergency
Sunshine and above-average temperatures over #Italy but worsening #airquality.
According to @copernicusecmwf.bsky.social (CAMS), high PM₂․₅ levels are expected this afternoon across the #PoValley, with peaks above 75 µg/m³ — about four times higher than the WHO daily limit (15 µg/m³).
According to @copernicusecmwf.bsky.social (CAMS), high PM₂․₅ levels are expected this afternoon across the #PoValley, with peaks above 75 µg/m³ — about four times higher than the WHO daily limit (15 µg/m³).

November 12, 2025 at 1:36 PM
Sunshine and above-average temperatures over #Italy but worsening #airquality.
According to @copernicusecmwf.bsky.social (CAMS), high PM₂․₅ levels are expected this afternoon across the #PoValley, with peaks above 75 µg/m³ — about four times higher than the WHO daily limit (15 µg/m³).
According to @copernicusecmwf.bsky.social (CAMS), high PM₂․₅ levels are expected this afternoon across the #PoValley, with peaks above 75 µg/m³ — about four times higher than the WHO daily limit (15 µg/m³).
Emergency #drought in #Iran: water levels in the Amir Kabir Dam — supplying drinking water to #Tehran — is below 8%. The country is suffering after months of drought and record heat. The video shows the #Copernicus #Sentinel2 image on Nov. 2 2024 and Nov. 9 2025. #climateemergency
November 10, 2025 at 5:20 PM
Emergency #drought in #Iran: water levels in the Amir Kabir Dam — supplying drinking water to #Tehran — is below 8%. The country is suffering after months of drought and record heat. The video shows the #Copernicus #Sentinel2 image on Nov. 2 2024 and Nov. 9 2025. #climateemergency
Massive dust plume crosses the Persian Gulf! Captured on Nov. 4 by #Copernicus #Sentinel3, this amazing image shows the enormous dust cloud from southern #Iran and #Pakistan making its way to #Oman and #UAE. #AirQuality

November 7, 2025 at 4:41 PM
Massive dust plume crosses the Persian Gulf! Captured on Nov. 4 by #Copernicus #Sentinel3, this amazing image shows the enormous dust cloud from southern #Iran and #Pakistan making its way to #Oman and #UAE. #AirQuality
The aftermath of Hurricane #Melissa in central/eastern #Jamaica observed from space.
The #Copernicus #Sentinel2 captured on October 31st this remarkable image highlighting the discharge of fluvial sediments into the marine environment. #ClimateEmergency
The #Copernicus #Sentinel2 captured on October 31st this remarkable image highlighting the discharge of fluvial sediments into the marine environment. #ClimateEmergency

November 1, 2025 at 4:51 PM
The aftermath of Hurricane #Melissa in central/eastern #Jamaica observed from space.
The #Copernicus #Sentinel2 captured on October 31st this remarkable image highlighting the discharge of fluvial sediments into the marine environment. #ClimateEmergency
The #Copernicus #Sentinel2 captured on October 31st this remarkable image highlighting the discharge of fluvial sediments into the marine environment. #ClimateEmergency
#Hurricane #Melissa has intensified to a Category 5 system while moving northwest through the #Caribbean Sea toward Jamaica, per the latest NHC Atlantic update. The #Copernicus #Sentinel3 image collected on Oct. 26 shows the eye of storm heading to #Jamaica.
#HurricaneMelissa
#HurricaneMelissa

October 27, 2025 at 10:56 AM
#Hurricane #Melissa has intensified to a Category 5 system while moving northwest through the #Caribbean Sea toward Jamaica, per the latest NHC Atlantic update. The #Copernicus #Sentinel3 image collected on Oct. 26 shows the eye of storm heading to #Jamaica.
#HurricaneMelissa
#HurricaneMelissa
The incredible 'brightness' of #Diwali celebrations also extends to the sky.
The #Copernicus #Sentinel5p NO2 map in the video shows the increased presence of thick smog over #NewDehli, during and after the #Hindu festival, as fireworks fill the air with pollutants. #AirQuality
The #Copernicus #Sentinel5p NO2 map in the video shows the increased presence of thick smog over #NewDehli, during and after the #Hindu festival, as fireworks fill the air with pollutants. #AirQuality
October 23, 2025 at 10:52 AM
The incredible 'brightness' of #Diwali celebrations also extends to the sky.
The #Copernicus #Sentinel5p NO2 map in the video shows the increased presence of thick smog over #NewDehli, during and after the #Hindu festival, as fireworks fill the air with pollutants. #AirQuality
The #Copernicus #Sentinel5p NO2 map in the video shows the increased presence of thick smog over #NewDehli, during and after the #Hindu festival, as fireworks fill the air with pollutants. #AirQuality
Northern #Vietnam has been hit by extreme weather, facing its worst #floods in 60 years and devastating landslides.
📹 The video shows #Nguyencity and the Song Gau River before and after Storm #Matmo, captured by #Copernicus #Sentinel2 on July 31 and October 9. #climateemergency
📹 The video shows #Nguyencity and the Song Gau River before and after Storm #Matmo, captured by #Copernicus #Sentinel2 on July 31 and October 9. #climateemergency
October 11, 2025 at 7:18 AM
Northern #Vietnam has been hit by extreme weather, facing its worst #floods in 60 years and devastating landslides.
📹 The video shows #Nguyencity and the Song Gau River before and after Storm #Matmo, captured by #Copernicus #Sentinel2 on July 31 and October 9. #climateemergency
📹 The video shows #Nguyencity and the Song Gau River before and after Storm #Matmo, captured by #Copernicus #Sentinel2 on July 31 and October 9. #climateemergency
Stunning image of Hurricanes #Humberto and #Imelda ‘dancing’ over #Atlantic threating #Bermuda.
The #Copernicus #Sentinel3 image was captured on September 30.
#Hurricane #climateemergency
The #Copernicus #Sentinel3 image was captured on September 30.
#Hurricane #climateemergency

October 1, 2025 at 3:59 PM
Stunning image of Hurricanes #Humberto and #Imelda ‘dancing’ over #Atlantic threating #Bermuda.
The #Copernicus #Sentinel3 image was captured on September 30.
#Hurricane #climateemergency
The #Copernicus #Sentinel3 image was captured on September 30.
#Hurricane #climateemergency
Wildfires in #Canada are still burning in September, fueled by extreme heat and lightning strikes.
In British Columbia, around 150 fires remain active, marking one of the worst #wildfire seasons on record. #ClimateEmergency #BCwildfire
In British Columbia, around 150 fires remain active, marking one of the worst #wildfire seasons on record. #ClimateEmergency #BCwildfire

September 10, 2025 at 3:50 PM
Wildfires in #Canada are still burning in September, fueled by extreme heat and lightning strikes.
In British Columbia, around 150 fires remain active, marking one of the worst #wildfire seasons on record. #ClimateEmergency #BCwildfire
In British Columbia, around 150 fires remain active, marking one of the worst #wildfire seasons on record. #ClimateEmergency #BCwildfire
From #Canada to #Europe! The huge plume from the Canadian #wildfires has reached #France, the #UK and Northern European Countries, as shown in the #Copernicus #Sentinel5p CO map on Aug. the 5th. #AirQuality

August 6, 2025 at 10:45 AM
From #Canada to #Europe! The huge plume from the Canadian #wildfires has reached #France, the #UK and Northern European Countries, as shown in the #Copernicus #Sentinel5p CO map on Aug. the 5th. #AirQuality