


David Keller, CMT
@dkellercmt.bsky.social
Market Behaviorist | President @ Sierra Alpha Research | Host @ Market Misbehavior podcast | CNBC Contributor | Former StockCharts, Fidelity, Bloomberg | For educational purposes only.
Market at highs, breadth lagging—what then?
Two-time Dow Award winner Andrew Thrasher joins me to discuss volatility “tsunamis,” the 5% canary, and the routines that keep us aligned with trend (not headlines).
Watch: youtu.be/dKWPQHpSBf0
#Investing #TechnicalAnalysis #Breadth
Two-time Dow Award winner Andrew Thrasher joins me to discuss volatility “tsunamis,” the 5% canary, and the routines that keep us aligned with trend (not headlines).
Watch: youtu.be/dKWPQHpSBf0
#Investing #TechnicalAnalysis #Breadth

Andrew Thrasher on Market Breadth, Volatility “Tsunamis,” and Risk: Building a Process That Works
YouTube video by Market Misbehavior with David Keller, CMT
youtu.be
November 13, 2025 at 3:00 PM
Market at highs, breadth lagging—what then?
Two-time Dow Award winner Andrew Thrasher joins me to discuss volatility “tsunamis,” the 5% canary, and the routines that keep us aligned with trend (not headlines).
Watch: youtu.be/dKWPQHpSBf0
#Investing #TechnicalAnalysis #Breadth
Two-time Dow Award winner Andrew Thrasher joins me to discuss volatility “tsunamis,” the 5% canary, and the routines that keep us aligned with trend (not headlines).
Watch: youtu.be/dKWPQHpSBf0
#Investing #TechnicalAnalysis #Breadth
One of the biggest changes we've observed in recent weeks has been the dispersion in the Mag7 stocks. $META still looking all kinds of bad as it has broken support levels. Now $AVGO is testing the 50-day moving average. Previous tests in August and October have held...

November 13, 2025 at 1:06 PM
One of the biggest changes we've observed in recent weeks has been the dispersion in the Mag7 stocks. $META still looking all kinds of bad as it has broken support levels. Now $AVGO is testing the 50-day moving average. Previous tests in August and October have held...
Choppy session: S&P flat, Dow up, Nasdaq down. Gold and silver pushed higher (miners strong) while energy slipped. I walk through S&P Fibonacci levels, healthcare/financials leadership, and setups like PODD, TJX, CME—and what confirms a durable turn. Watch: youtu.be/bZwmGr1iW_Y

Gold Shines, Tech Wobbles: Value Tops Growth | CHART THIS (Nov 12, 2025)
YouTube video by Market Misbehavior with David Keller, CMT
youtu.be
November 13, 2025 at 4:36 AM
Choppy session: S&P flat, Dow up, Nasdaq down. Gold and silver pushed higher (miners strong) while energy slipped. I walk through S&P Fibonacci levels, healthcare/financials leadership, and setups like PODD, TJX, CME—and what confirms a durable turn. Watch: youtu.be/bZwmGr1iW_Y
Hey friends- I'm on a plane, heading over the East Coast for a college tour with my daughter 👀. Will be a bit late with today's episode of CHART THIS with Dave Keller, but it will be on my YouTube channel marketmisbehavior.com/chartthis as soon as I can swing it! Cheers and thanks 📈📉😃

CHART THIS with David Keller, CMT
Join Dave every trading day after the close for a review of key market indicators, a breakdown of key stocks on the move, and a focus on technical analysis a...
marketmisbehavior.com
November 12, 2025 at 10:02 PM
Hey friends- I'm on a plane, heading over the East Coast for a college tour with my daughter 👀. Will be a bit late with today's episode of CHART THIS with Dave Keller, but it will be on my YouTube channel marketmisbehavior.com/chartthis as soon as I can swing it! Cheers and thanks 📈📉😃
Market breadth continues to improve this week! Back above 50% of $SPX sitting above their 50-day MA. Also we haven't dipped below 50% of $SPX above their 200-day MA since May. #notbearish

November 12, 2025 at 8:04 PM
Market breadth continues to improve this week! Back above 50% of $SPX sitting above their 50-day MA. Also we haven't dipped below 50% of $SPX above their 200-day MA since May. #notbearish
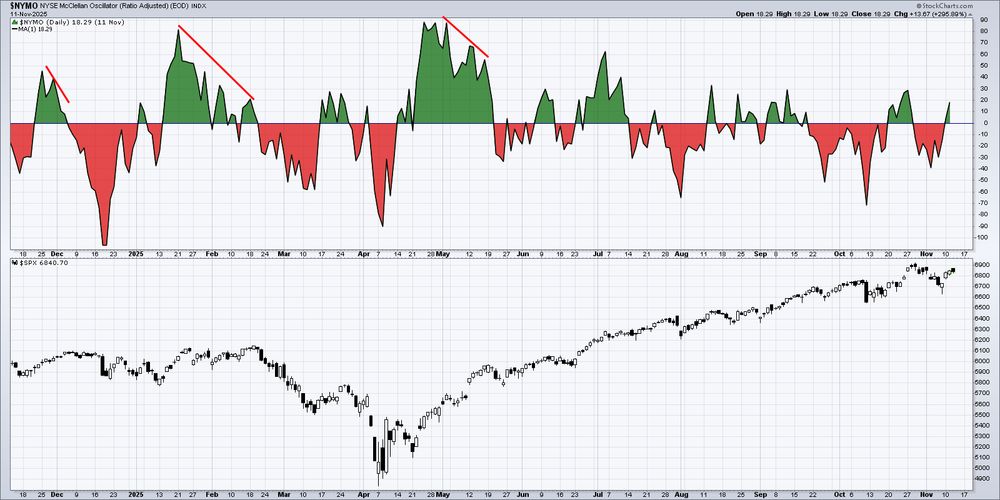
Definitely noting some improved breadth readings this week, with the McClellan Oscillator pushing back above the crucial zero level. Still very few breadth indicators confirming the most recent new highs for $SPX and $QQQ though...
November 12, 2025 at 7:06 PM
Definitely noting some improved breadth readings this week, with the McClellan Oscillator pushing back above the crucial zero level. Still very few breadth indicators confirming the most recent new highs for $SPX and $QQQ though...
Pretty sure the only chart we need right now is the daily $SPX chart with a clear uptrend channel. Recent pullback tested the lower trendline but now right back at the midpoint. Remember, a trend channel on a log scale chart represents a consistent percentage gain over a period of time!

November 12, 2025 at 6:04 PM
Pretty sure the only chart we need right now is the daily $SPX chart with a clear uptrend channel. Recent pullback tested the lower trendline but now right back at the midpoint. Remember, a trend channel on a log scale chart represents a consistent percentage gain over a period of time!
Mixed tape: Dow up, NASDAQ down, S&P in-between. Healthcare led while some tech areas faded—echoing value over growth. I walk through leadership, trend/momentum signals, and what confirms a real turn. Watch: youtu.be/8hHS75qoYuo

Value Strikes Back: Dow Up, NASDAQ Down | CHART THIS (Nov 11, 2025)
YouTube video by Market Misbehavior with David Keller, CMT
youtu.be
November 11, 2025 at 10:39 PM
Mixed tape: Dow up, NASDAQ down, S&P in-between. Healthcare led while some tech areas faded—echoing value over growth. I walk through leadership, trend/momentum signals, and what confirms a real turn. Watch: youtu.be/8hHS75qoYuo
Markets rallied on shutdown headlines—but can it stick without fresh data? In today’s episode, I analyze a Wells Fargo list of potential “tariff unwind” winners and show how to turn any article into a chart list (performance, RRG, chart review).
Watch here: www.youtube.com/watch?v=nLbL...
Watch here: www.youtube.com/watch?v=nLbL...

The Tariff Relief Playbook: 10 Stocks with Upside Potential
YouTube video by StockCharts TV
www.youtube.com
November 11, 2025 at 5:51 PM
Markets rallied on shutdown headlines—but can it stick without fresh data? In today’s episode, I analyze a Wells Fargo list of potential “tariff unwind” winners and show how to turn any article into a chart list (performance, RRG, chart review).
Watch here: www.youtube.com/watch?v=nLbL...
Watch here: www.youtube.com/watch?v=nLbL...
A wave of optimism hit the markets today as shutdown talks seemed to move toward resolution. The NASDAQ jumped 2%, the S&P reversed higher, and momentum improved.
Full breakdown on CHART THIS → youtu.be/ADkBdOvpIV0
Full breakdown on CHART THIS → youtu.be/ADkBdOvpIV0

Markets Rally on Shutdown Optimism: NASDAQ Up 2% | CHART THIS with Dave Keller (Nov 10, 2025)
YouTube video by Market Misbehavior with David Keller, CMT
youtu.be
November 10, 2025 at 11:11 PM
A wave of optimism hit the markets today as shutdown talks seemed to move toward resolution. The NASDAQ jumped 2%, the S&P reversed higher, and momentum improved.
Full breakdown on CHART THIS → youtu.be/ADkBdOvpIV0
Full breakdown on CHART THIS → youtu.be/ADkBdOvpIV0
Had an awesome conversation with Jerry Robinson of FollowTheMoney.com about trend following, position trading, diversification, and mindful investing.
We cover tools, timeframes & turning down the noise.
🎧 Watch/Listen: youtu.be/hjF-mobzrWs
We cover tools, timeframes & turning down the noise.
🎧 Watch/Listen: youtu.be/hjF-mobzrWs

Trend Following Secrets w/ Jerry Robinson: Follow the Money, Not the Noise
YouTube video by Market Misbehavior with David Keller, CMT
youtu.be
November 10, 2025 at 6:28 PM
Had an awesome conversation with Jerry Robinson of FollowTheMoney.com about trend following, position trading, diversification, and mindful investing.
We cover tools, timeframes & turning down the noise.
🎧 Watch/Listen: youtu.be/hjF-mobzrWs
We cover tools, timeframes & turning down the noise.
🎧 Watch/Listen: youtu.be/hjF-mobzrWs
Choppy week for the markets, but Friday brought a twist. The S&P 500 dipped under its 50-day, then clawed back to finish positive. A good sign—or just a head fake? Full thoughts on CHART THIS: youtu.be/Q_9yTjVd__Q

S&P 500 Rebounds Above 50-Day After Volatile Week | CHART THIS with Dave Keller (Nov 7, 2025)
YouTube video by Market Misbehavior with David Keller, CMT
youtu.be
November 7, 2025 at 10:47 PM
Choppy week for the markets, but Friday brought a twist. The S&P 500 dipped under its 50-day, then clawed back to finish positive. A good sign—or just a head fake? Full thoughts on CHART THIS: youtu.be/Q_9yTjVd__Q
Reposted by David Keller, CMT

We really don’t want these lines to get much closer.
(via FEDWATCH) 👀
(via FEDWATCH) 👀

November 7, 2025 at 7:10 PM
We really don’t want these lines to get much closer.
(via FEDWATCH) 👀
(via FEDWATCH) 👀
Most investors chase price. Steven Bavaria says focus on income! In our latest Market Misbehavior podcast episode, he shares how his “Income Factory” approach builds steady returns through credit, yield & reinvestment. 🎧 Watch here: youtu.be/doYlxF56rRY

Steven Bavaria on The “Income Factory”: How to Build Steady Returns in Any Market
YouTube video by Market Misbehavior with David Keller, CMT
youtu.be
November 7, 2025 at 6:16 PM
Most investors chase price. Steven Bavaria says focus on income! In our latest Market Misbehavior podcast episode, he shares how his “Income Factory” approach builds steady returns through credit, yield & reinvestment. 🎧 Watch here: youtu.be/doYlxF56rRY
Big intraday swings again today. Stocks up early, then fade into the close. Are institutions quietly selling into strength? Let’s chart it out together 👉 CHART THIS: youtu.be/UA1admDqun8

Late-Day Selloff But Semiconductors Surge | CHART THIS with Dave Keller (Nov 5, 2025)
In this midweek edition of CHART THIS, host Dave Keller recaps a volatile Wednesday session as stocks recovered early losses before fading into the close. Despite the S&P 500 and NASDAQ finishing in…
youtu.be
November 5, 2025 at 10:59 PM
Big intraday swings again today. Stocks up early, then fade into the close. Are institutions quietly selling into strength? Let’s chart it out together 👉 CHART THIS: youtu.be/UA1admDqun8
#Bitcoin $GBTC teasing the "red light" portion of our traffic light setup with a break below the 200-day MA. For a pattern like this, I'd look for a close below the 200-day and then confirmation with some follow-through to signal a bearish configuration.

November 4, 2025 at 6:04 PM
#Bitcoin $GBTC teasing the "red light" portion of our traffic light setup with a break below the 200-day MA. For a pattern like this, I'd look for a close below the 200-day and then confirmation with some follow-through to signal a bearish configuration.
$SPX Bullish Percent Index now below 50% for the first time since the April market low. Market has undeniably bad breadth here...

November 4, 2025 at 5:06 PM
$SPX Bullish Percent Index now below 50% for the first time since the April market low. Market has undeniably bad breadth here...
We're going live this Thursday 11/6 for TICKER TANTRUM- a live Q&A featuring your tickers, my charts, and lots of great insights on using technical analysis to identify opportunities and manage risk. Should be fun! marketmisbehavior.com/ticker

Ticker Tantrum: Live Q&A and You Choose the Tickers!
Dave hosts a LIVE Q&A on Thursday, November 6th 2025. Drop your tickers into the live chat and Dave will review the charts, identify key levels and signals, and share plenty of insights and education...
marketmisbehavior.com
November 4, 2025 at 4:24 PM
We're going live this Thursday 11/6 for TICKER TANTRUM- a live Q&A featuring your tickers, my charts, and lots of great insights on using technical analysis to identify opportunities and manage risk. Should be fun! marketmisbehavior.com/ticker
Only 39% of $SPX members currently remain above their 50-day moving average. Can the major indexes keep going higher, despite this crazy weak breadth? Apparently so...

November 4, 2025 at 4:05 PM
Only 39% of $SPX members currently remain above their 50-day moving average. Can the major indexes keep going higher, despite this crazy weak breadth? Apparently so...
Thanks to Mike Dickson @ Horizon Investments for a fantastic interview on the Market Misbehavior podcast! We talked top heavy benchmarks, building factor models, and why the path of returns matters as much as the destination. Solid quant insights and market perspective!

November 3, 2025 at 11:56 PM
Thanks to Mike Dickson @ Horizon Investments for a fantastic interview on the Market Misbehavior podcast! We talked top heavy benchmarks, building factor models, and why the path of returns matters as much as the destination. Solid quant insights and market perspective!
Not sure how the breadth could look much worse than this. Every new ATH for $SPX since June has been marked by less S&P 500 members regaining their 50-day moving average. "Healthy bull markets are marked by an expansion in breadth."

October 31, 2025 at 4:08 PM
Not sure how the breadth could look much worse than this. Every new ATH for $SPX since June has been marked by less S&P 500 members regaining their 50-day moving average. "Healthy bull markets are marked by an expansion in breadth."
I'm seeing this as the second Hindenburg Omen signal in October. And that's not bullish for $SPX $QQQ! Not the world's most ideal timing tool, but does tell me to diligently look for signs of distribution. Discussed in detail on yesterday's show: www.youtube.com/live/1OjdBLk...

October 31, 2025 at 4:02 PM
I'm seeing this as the second Hindenburg Omen signal in October. And that's not bullish for $SPX $QQQ! Not the world's most ideal timing tool, but does tell me to diligently look for signs of distribution. Discussed in detail on yesterday's show: www.youtube.com/live/1OjdBLk...
We're going live at 5pm ET / 2pm PT on our YouTube channel for a market recap.
Topics to include:
* Risk-off move for the $SPX
* Mag7 earnings causing all the disruption $AAPL $AMZN
* The Hindenburg Omen firing up again!
Don't miss it. bit.ly/MarketMisbeh...
Topics to include:
* Risk-off move for the $SPX
* Mag7 earnings causing all the disruption $AAPL $AMZN
* The Hindenburg Omen firing up again!
Don't miss it. bit.ly/MarketMisbeh...

Market Misbehavior with David Keller, CMT
President and Chief Strategist at Sierra Alpha Research LLC. Former Fidelity, StockCharts, Bloomberg, CMT Association. I help active investors and financial advisors make more informed investment…
bit.ly
October 30, 2025 at 8:51 PM
We're going live at 5pm ET / 2pm PT on our YouTube channel for a market recap.
Topics to include:
* Risk-off move for the $SPX
* Mag7 earnings causing all the disruption $AAPL $AMZN
* The Hindenburg Omen firing up again!
Don't miss it. bit.ly/MarketMisbeh...
Topics to include:
* Risk-off move for the $SPX
* Mag7 earnings causing all the disruption $AAPL $AMZN
* The Hindenburg Omen firing up again!
Don't miss it. bit.ly/MarketMisbeh...
$SPX is hovering near record highs — but the real story lies beneath the surface. Time to break down three key charts — Alphabet ($GOOGL), Nvidia ($NVDA), and Meta ($META) — to uncover what they’re telling us about where the market is heading next!
youtu.be/YwDTyErMjz0
youtu.be/YwDTyErMjz0

Can Big Tech Keep the Market Rally Alive? | GOOGL, NVDA & META Charts Explained
🎓 Take Dave’s FREE course on behavioral investing: https://www.marketmisbehavior.com/freecourse
📘 Check out Dave’s recommended reading list: https://www.marketmisbehavior.com/readinglist
🎯 Upgrade…
youtu.be
October 30, 2025 at 5:22 PM
$SPX is hovering near record highs — but the real story lies beneath the surface. Time to break down three key charts — Alphabet ($GOOGL), Nvidia ($NVDA), and Meta ($META) — to uncover what they’re telling us about where the market is heading next!
youtu.be/YwDTyErMjz0
youtu.be/YwDTyErMjz0
Behold the powerful "traffic light" approach applied to $V:
$V over $355 = green light
$V between 335-355 = yellow light
$V below 335 = red light
Don't swing just to swing. Wait for the good pitches! ⚾️
$V over $355 = green light
$V between 335-355 = yellow light
$V below 335 = red light
Don't swing just to swing. Wait for the good pitches! ⚾️

October 30, 2025 at 12:06 PM
Behold the powerful "traffic light" approach applied to $V:
$V over $355 = green light
$V between 335-355 = yellow light
$V below 335 = red light
Don't swing just to swing. Wait for the good pitches! ⚾️
$V over $355 = green light
$V between 335-355 = yellow light
$V below 335 = red light
Don't swing just to swing. Wait for the good pitches! ⚾️