


Jumping 🕴️ now into "Practical session 4: Behavior Modeling" with @kevinyamauchi.bsky.social online! First things first, students are getting to know how to do #bioimage visualization in Python 🖥️🐍 using @napari.org👇


September 16, 2025 at 12:52 PM
Jumping 🕴️ now into "Practical session 4: Behavior Modeling" with @kevinyamauchi.bsky.social online! First things first, students are getting to know how to do #bioimage visualization in Python 🖥️🐍 using @napari.org👇

Genome-wide analysis and visualization of copy number with CNVpytor in igv.js academic.oup.com/bioinformati... 🧬🖥️ github.com/igvteam/igv....

Genome-wide analysis and visualization of copy number with CNVpytor in igv.js
AbstractSummary. Copy number variation (CNV) and alteration (CNA) analysis is a crucial component in many genomic studies and its applications span from ba
academic.oup.com
July 26, 2024 at 1:15 PM
Genome-wide analysis and visualization of copy number with CNVpytor in igv.js academic.oup.com/bioinformati... 🧬🖥️ github.com/igvteam/igv....

Blastn2dotplots: multiple dot-plot visualizer for genome comparisons. #DotPlot #Visualization #GenomeComparison #Genomics #Bioinformatics #BMCbioinformatics 🧬 🖥️
bmcbioinformatics.biomedcentral.com/articles/10....
bmcbioinformatics.biomedcentral.com/articles/10....

Blastn2dotplots: multiple dot-plot visualizer for genome comparisons - BMC Bioinformatics
Background Dot-plots, along with linear comparisons, are fundamental visualization methods in genome comparisons, widely used for analyzing structural variations, repeat regions, and sequence…
bmcbioinformatics.biomedcentral.com
June 5, 2025 at 10:30 AM
Blastn2dotplots: multiple dot-plot visualizer for genome comparisons. #DotPlot #Visualization #GenomeComparison #Genomics #Bioinformatics #BMCbioinformatics 🧬 🖥️
bmcbioinformatics.biomedcentral.com/articles/10....
bmcbioinformatics.biomedcentral.com/articles/10....

shinyUMAP: an online tool for promoting understanding of single cell omics data visualization #SingleCell 🧪🧬🖥️
https://www.biorxiv.org/content/10.1101/2025.08.27.672621v1
https://www.biorxiv.org/content/10.1101/2025.08.27.672621v1
September 2, 2025 at 7:00 AM
shinyUMAP: an online tool for promoting understanding of single cell omics data visualization #SingleCell 🧪🧬🖥️
https://www.biorxiv.org/content/10.1101/2025.08.27.672621v1
https://www.biorxiv.org/content/10.1101/2025.08.27.672621v1

Real-time visualization of ligand-specific conformational dynamics of GPCR C-terminal domain in living cells #SingleCell 🧪🧬🖥️
https://www.biorxiv.org/content/10.1101/2025.07.17.665247v1
https://www.biorxiv.org/content/10.1101/2025.07.17.665247v1
July 21, 2025 at 4:00 PM
Real-time visualization of ligand-specific conformational dynamics of GPCR C-terminal domain in living cells #SingleCell 🧪🧬🖥️
https://www.biorxiv.org/content/10.1101/2025.07.17.665247v1
https://www.biorxiv.org/content/10.1101/2025.07.17.665247v1
scMEDAL for the interpretable analysis of single-cell transcriptomics data with batch effect visualization using a deep mixed effects autoencoder #SingleCell 🧪🧬🖥️
https://arxiv.org/abs/2411.06635
https://arxiv.org/abs/2411.06635
March 14, 2025 at 2:12 PM
scMEDAL for the interpretable analysis of single-cell transcriptomics data with batch effect visualization using a deep mixed effects autoencoder #SingleCell 🧪🧬🖥️
https://arxiv.org/abs/2411.06635
https://arxiv.org/abs/2411.06635
EasyPubPlot: a shiny web application for rapid omics data exploration and visualization. #EasyPublishablePlotting #Shiny #R #DataExploration @biorxivpreprint.bsky.social 🧬 🖥️
www.biorxiv.org/content/10.1...
www.biorxiv.org/content/10.1...

December 1, 2024 at 7:48 PM
EasyPubPlot: a shiny web application for rapid omics data exploration and visualization. #EasyPublishablePlotting #Shiny #R #DataExploration @biorxivpreprint.bsky.social 🧬 🖥️
www.biorxiv.org/content/10.1...
www.biorxiv.org/content/10.1...
Scafari: Exploring scDNA-seq data. #scRNAseq #Bioconductor #QC #VariantAnalysis #Visualization #Bioinformatics 🧬 🖥️
academic.oup.com/bioinformati...
academic.oup.com/bioinformati...


September 21, 2025 at 5:05 PM
Scafari: Exploring scDNA-seq data. #scRNAseq #Bioconductor #QC #VariantAnalysis #Visualization #Bioinformatics 🧬 🖥️
academic.oup.com/bioinformati...
academic.oup.com/bioinformati...

Sweet, blow5 is the archival format of choice for all internal ONT raw data around here. IMHO slow5 output also makes it easy to look at the raw signal data and play around with it for learning & analysis purposes. I should really write up some visualization tutorials soon.
🧪🧬🖥️
🧪🧬🖥️

Benchmark comparing SLOW5 and POD5 for nanopore raw signal data has now been published at
@GigaScience
academic.oup.com/gigascience/....
Some plots required a log scale - RAM usage and random access time.
@GigaScience
academic.oup.com/gigascience/....
Some plots required a log scale - RAM usage and random access time.

October 17, 2025 at 12:01 PM
Sweet, blow5 is the archival format of choice for all internal ONT raw data around here. IMHO slow5 output also makes it easy to look at the raw signal data and play around with it for learning & analysis purposes. I should really write up some visualization tutorials soon.
🧪🧬🖥️
🧪🧬🖥️
(2021) A global metagenomic map of urban microbiomes and antimicrobial resistance www.cell.com/cell/fulltex... 🧬🖥️🦠https://github.com/metasub/metasub_utils interactive visualization metasub.org/map/

A global metagenomic map of urban microbiomes and antimicrobial resistance
This systematic, worldwide catalog of urban microbiomes represents a metagenomic atlas
important for understanding the ecology, virulence, and antibiotic resistance of city-specific
microbial communit...
www.cell.com
July 31, 2024 at 8:44 PM
(2021) A global metagenomic map of urban microbiomes and antimicrobial resistance www.cell.com/cell/fulltex... 🧬🖥️🦠https://github.com/metasub/metasub_utils interactive visualization metasub.org/map/
JOB: Japan Omics Browser (japan-omics.jp) provides integrative visualization of multi-omics data bmcgenomics.biomedcentral.com/articles/10.... 🧬🖥️🧪 github.com/ytakahashi-s...


May 13, 2025 at 8:01 PM
JOB: Japan Omics Browser (japan-omics.jp) provides integrative visualization of multi-omics data bmcgenomics.biomedcentral.com/articles/10.... 🧬🖥️🧪 github.com/ytakahashi-s...

JAX's Charles Lee has been awarded an $8.9 million grant by the National Human Genome Research Institute (NHGRI) to build new visualization and analysis tools that can accurately and comprehensively decipher hard-to-sequence areas of the human genome: 🧪🤝🖥️ 🧬 ⑂
www.jax.org/news-and-ins...
www.jax.org/news-and-ins...

Charles Lee continues to sequence the 'hard-to-reach' areas of the human genome
Charles Lee co-leads the Human Genome Structural Variation Consortium and is uncovering structural variations in the human genome.
www.jax.org
July 15, 2024 at 12:51 PM
JAX's Charles Lee has been awarded an $8.9 million grant by the National Human Genome Research Institute (NHGRI) to build new visualization and analysis tools that can accurately and comprehensively decipher hard-to-sequence areas of the human genome: 🧪🤝🖥️ 🧬 ⑂
www.jax.org/news-and-ins...
www.jax.org/news-and-ins...

Fiber #tractography: Linear versus Planar b-Tensor encoding DWI • by Steven Baete &al., p1423
8:15a, 🖥️ 51
Authors report that "tract visualization can potentially be improved by using Planar instead of Linear b-Tensor Encoding DWI."
8:15a, 🖥️ 51
Authors report that "tract visualization can potentially be improved by using Planar instead of Linear b-Tensor Encoding DWI."

May 12, 2025 at 6:46 PM
Fiber #tractography: Linear versus Planar b-Tensor encoding DWI • by Steven Baete &al., p1423
8:15a, 🖥️ 51
Authors report that "tract visualization can potentially be improved by using Planar instead of Linear b-Tensor Encoding DWI."
8:15a, 🖥️ 51
Authors report that "tract visualization can potentially be improved by using Planar instead of Linear b-Tensor Encoding DWI."
CAdir: Fast Clustering and Visualization of Single-Cell Transcriptomics Data by Direction in CA Space #SingleCell 🧪🧬🖥️
https://www.biorxiv.org/content/10.1101/2025.03.14.643234v1
https://www.biorxiv.org/content/10.1101/2025.03.14.643234v1
March 18, 2025 at 8:04 AM
CAdir: Fast Clustering and Visualization of Single-Cell Transcriptomics Data by Direction in CA Space #SingleCell 🧪🧬🖥️
https://www.biorxiv.org/content/10.1101/2025.03.14.643234v1
https://www.biorxiv.org/content/10.1101/2025.03.14.643234v1

📔 Book vs Screen 🖥️
This study suggests printed text boosts cognitive engagement in young readers.
Higher theta-beta ratio during screen-based vs. printed paper is related to lower attention in children: An EEG study 🏺🧪
journals.plos.org/plosone/arti...
This study suggests printed text boosts cognitive engagement in young readers.
Higher theta-beta ratio during screen-based vs. printed paper is related to lower attention in children: An EEG study 🏺🧪
journals.plos.org/plosone/arti...

April 17, 2024 at 6:19 PM
📔 Book vs Screen 🖥️
This study suggests printed text boosts cognitive engagement in young readers.
Higher theta-beta ratio during screen-based vs. printed paper is related to lower attention in children: An EEG study 🏺🧪
journals.plos.org/plosone/arti...
This study suggests printed text boosts cognitive engagement in young readers.
Higher theta-beta ratio during screen-based vs. printed paper is related to lower attention in children: An EEG study 🏺🧪
journals.plos.org/plosone/arti...
The NCBI Comparative Genome Viewer (CGV) is an interactive visualization tool for the analysis of whole-genome eukaryotic alignments journals.plos.org/plosbiology/... 🧬🖥️

The NCBI Comparative Genome Viewer (CGV) is an interactive visualization tool for the analysis of whole-genome eukaryotic alignments
Commonly used genome browsers only show one genome assembly at a time and cannot show comparisons between multiple genomes. This study develops a new visualization tool called the Comparative Genome V...
journals.plos.org
May 17, 2024 at 9:06 AM
The NCBI Comparative Genome Viewer (CGV) is an interactive visualization tool for the analysis of whole-genome eukaryotic alignments journals.plos.org/plosbiology/... 🧬🖥️
Inference and visualization of multi-scale cell tree for decoding functional diversity with scMustree #SingleCell 🧪🧬🖥️
https://www.biorxiv.org/content/10.1101/2025.04.22.649953v1
https://www.biorxiv.org/content/10.1101/2025.04.22.649953v1
April 29, 2025 at 4:00 PM
Inference and visualization of multi-scale cell tree for decoding functional diversity with scMustree #SingleCell 🧪🧬🖥️
https://www.biorxiv.org/content/10.1101/2025.04.22.649953v1
https://www.biorxiv.org/content/10.1101/2025.04.22.649953v1
OrthoBrowser: Gene Family Analysis and Visualization. #GeneFamilies #OrthologousGenesVisualization #Bioinformatics @bioinfoadv.bsky.social 🧬 🖥️
academic.oup.com/bioinformati...
academic.oup.com/bioinformati...

OrthoBrowser: Gene Family Analysis and Visualization
AbstractMotivation. The analysis of gene families across diverse species is pivotal in elucidating evolutionary dynamics and functional genomic landscapes.
academic.oup.com
February 10, 2025 at 10:50 PM
OrthoBrowser: Gene Family Analysis and Visualization. #GeneFamilies #OrthologousGenesVisualization #Bioinformatics @bioinfoadv.bsky.social 🧬 🖥️
academic.oup.com/bioinformati...
academic.oup.com/bioinformati...
Generative cerebral vasculature visualization using spatialtranscriptomic data #SingleCell 🧪🧬🖥️
https://www.biorxiv.org/content/10.1101/2025.07.10.664153v1
https://www.biorxiv.org/content/10.1101/2025.07.10.664153v1
July 16, 2025 at 7:00 AM
Generative cerebral vasculature visualization using spatialtranscriptomic data #SingleCell 🧪🧬🖥️
https://www.biorxiv.org/content/10.1101/2025.07.10.664153v1
https://www.biorxiv.org/content/10.1101/2025.07.10.664153v1
Datavzrd: Rapid programming- and maintenance-free interactive visualization and communication of tabular data www.biorxiv.org/content/10.1... 🧬🖥️🧪

April 14, 2025 at 8:01 PM
Datavzrd: Rapid programming- and maintenance-free interactive visualization and communication of tabular data www.biorxiv.org/content/10.1... 🧬🖥️🧪
RiboSeq.Org: an integrated suite of resources for ribosome profiling data analysis and visualization. #RiboSeq #RibosomeProfiling #Genomics #NAR 🧬 🖥️
academic.oup.com/nar/advance-...
academic.oup.com/nar/advance-...
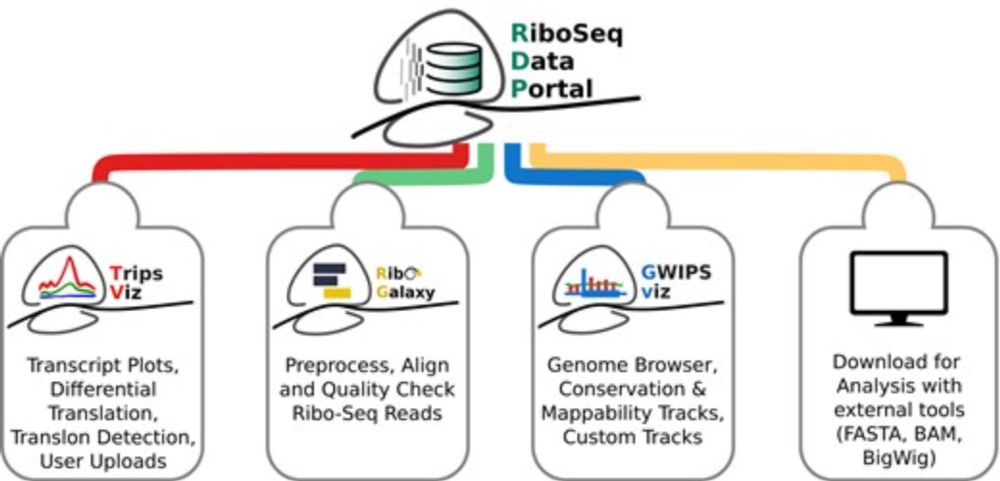
RiboSeq.Org: an integrated suite of resources for ribosome profiling data analysis and visualization
Abstract. Ribosome profiling (Ribo-Seq) has revolutionised our understanding of translation, but the increasing complexity and volume of Ribo-Seq data pres
academic.oup.com
November 26, 2024 at 12:09 AM
RiboSeq.Org: an integrated suite of resources for ribosome profiling data analysis and visualization. #RiboSeq #RibosomeProfiling #Genomics #NAR 🧬 🖥️
academic.oup.com/nar/advance-...
academic.oup.com/nar/advance-...
XVCF: Exquisite Visualization of VCF Data from Genomic Experiments www.biorxiv.org/content/10.1... 🧬🖥️🧪

May 7, 2025 at 3:30 PM
XVCF: Exquisite Visualization of VCF Data from Genomic Experiments www.biorxiv.org/content/10.1... 🧬🖥️🧪
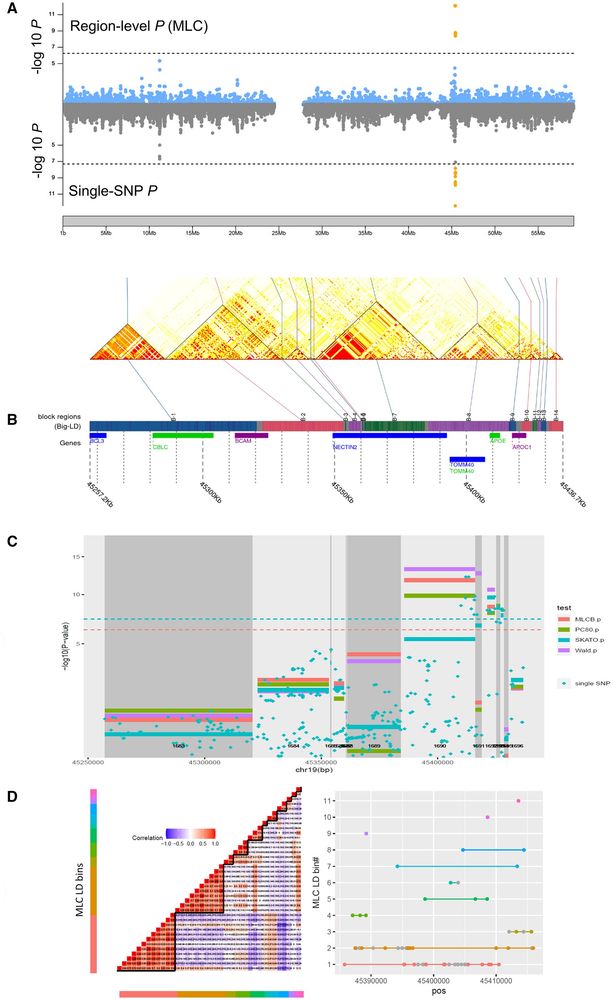
RegionScan: #Rstats package for region-level genome-wide association testing with integration and visualization academic.oup.com/bioinformati... 🧬🖥️🧪

April 1, 2025 at 8:00 PM
RegionScan: #Rstats package for region-level genome-wide association testing with integration and visualization academic.oup.com/bioinformati... 🧬🖥️🧪

🖥️ Improved Result Views
Better visualization for LC-MS preprocessing and spectral library matches makes interpretation faster and more intuitive.
Better visualization for LC-MS preprocessing and spectral library matches makes interpretation faster and more intuitive.
August 20, 2025 at 7:48 AM
🖥️ Improved Result Views
Better visualization for LC-MS preprocessing and spectral library matches makes interpretation faster and more intuitive.
Better visualization for LC-MS preprocessing and spectral library matches makes interpretation faster and more intuitive.