


More hotkeys are added on Tools toolbar in Origin 2025b to make scal in, data reading, adding annotation, drawing shapes, etc. more efficient.Learn more and download a free trial at www.originlab.com/2025b
#scientificgraphing #OriginPro #Originpro2025b #originlab #DataAnalysis #DataVisualization
#scientificgraphing #OriginPro #Originpro2025b #originlab #DataAnalysis #DataVisualization

More Hotkeys for Tools Toolbar
YouTube video by OriginLab Corp.
youtu.be
November 10, 2025 at 5:47 PM
More hotkeys are added on Tools toolbar in Origin 2025b to make scal in, data reading, adding annotation, drawing shapes, etc. more efficient.Learn more and download a free trial at www.originlab.com/2025b
#scientificgraphing #OriginPro #Originpro2025b #originlab #DataAnalysis #DataVisualization
#scientificgraphing #OriginPro #Originpro2025b #originlab #DataAnalysis #DataVisualization
Origin2025b introduced a mini dialog to insert multiple reference lines, including statistics lines to graph. There are also new mini toolbar buttons on reference lines for further customization.
#scientificgraphing #statistics #OriginPro #Originpro2025b #originlab #DataAnalysis #DataVisualization
#scientificgraphing #statistics #OriginPro #Originpro2025b #originlab #DataAnalysis #DataVisualization

Insert Multiple Reference Lines
YouTube video by OriginLab Corp.
youtu.be
November 5, 2025 at 4:31 PM
Origin2025b introduced a mini dialog to insert multiple reference lines, including statistics lines to graph. There are also new mini toolbar buttons on reference lines for further customization.
#scientificgraphing #statistics #OriginPro #Originpro2025b #originlab #DataAnalysis #DataVisualization
#scientificgraphing #statistics #OriginPro #Originpro2025b #originlab #DataAnalysis #DataVisualization
Do you know Origin has a Tools: Template Center... with a hundred of free templates to download. Choose Plot: Extended Template to use it or Template Library to get Sample
www.originlab.com/doc/Origin-H...
#sc#scientificgraphics #datavisualization #statistics #dataanalysis #originpro #originlab
www.originlab.com/doc/Origin-H...
#sc#scientificgraphics #datavisualization #statistics #dataanalysis #originpro #originlab

November 3, 2025 at 3:32 PM
Do you know Origin has a Tools: Template Center... with a hundred of free templates to download. Choose Plot: Extended Template to use it or Template Library to get Sample
www.originlab.com/doc/Origin-H...
#sc#scientificgraphics #datavisualization #statistics #dataanalysis #originpro #originlab
www.originlab.com/doc/Origin-H...
#sc#scientificgraphics #datavisualization #statistics #dataanalysis #originpro #originlab
This video demonstrates how to show an amplified subrange of spectrum on the same graph bythe stacking and magnifying feature of Origin.
Once done, you can even drag the red curve up and down to adjust position.
#scientificgraphing #datavisualization #spectrum #originpro #originpro2025b #originlab
Once done, you can even drag the red curve up and down to adjust position.
#scientificgraphing #datavisualization #spectrum #originpro #originpro2025b #originlab

Add a copy of a spectrum over specific X range with magnified Y scale
YouTube video by OriginLab Corp.
youtu.be
October 24, 2025 at 6:03 AM
This video demonstrates how to show an amplified subrange of spectrum on the same graph bythe stacking and magnifying feature of Origin.
Once done, you can even drag the red curve up and down to adjust position.
#scientificgraphing #datavisualization #spectrum #originpro #originpro2025b #originlab
Once done, you can even drag the red curve up and down to adjust position.
#scientificgraphing #datavisualization #spectrum #originpro #originpro2025b #originlab
Stepwise regression options are now available under OriginPro's Design of Experiments (DOE) and General Linear Regression (GLR) apps.
www.originlab.com/fileExchange...
#GLR #GeneralLinearRegression #LinearRegression #StepwiseRegression #DOE #DesignofExperiments #OriginPro #OriginPro2025b #originlab
www.originlab.com/fileExchange...
#GLR #GeneralLinearRegression #LinearRegression #StepwiseRegression #DOE #DesignofExperiments #OriginPro #OriginPro2025b #originlab

October 23, 2025 at 3:38 AM
Stepwise regression options are now available under OriginPro's Design of Experiments (DOE) and General Linear Regression (GLR) apps.
www.originlab.com/fileExchange...
#GLR #GeneralLinearRegression #LinearRegression #StepwiseRegression #DOE #DesignofExperiments #OriginPro #OriginPro2025b #originlab
www.originlab.com/fileExchange...
#GLR #GeneralLinearRegression #LinearRegression #StepwiseRegression #DOE #DesignofExperiments #OriginPro #OriginPro2025b #originlab
Find limitations in Project Explorer when editing contents in Origin? Use the new Project Browser in Origin 2025b to get a list view of contents, search, and bulk rename, ...
#Datamanagement #DataVisualization #scientificgraphing #DataAnalysis #statistics #originpro #originpro2025b #originlab
#Datamanagement #DataVisualization #scientificgraphing #DataAnalysis #statistics #originpro #originpro2025b #originlab

Project Browser
YouTube video by OriginLab Corp.
youtu.be
October 21, 2025 at 8:44 AM
Find limitations in Project Explorer when editing contents in Origin? Use the new Project Browser in Origin 2025b to get a list view of contents, search, and bulk rename, ...
#Datamanagement #DataVisualization #scientificgraphing #DataAnalysis #statistics #originpro #originpro2025b #originlab
#Datamanagement #DataVisualization #scientificgraphing #DataAnalysis #statistics #originpro #originpro2025b #originlab
One of the most popular Apps Correlation Plot is improved and preinstalled in OriginPro 2025b if you choose Stats mode during installation. www.originlab.com/fileExchange...
#correlationplot #statistics #scientificgraphing #dataanalysis #DataVisualization #originpro2025b #originpro #originlab
#correlationplot #statistics #scientificgraphing #dataanalysis #DataVisualization #originpro2025b #originpro #originlab

October 20, 2025 at 6:39 AM
One of the most popular Apps Correlation Plot is improved and preinstalled in OriginPro 2025b if you choose Stats mode during installation. www.originlab.com/fileExchange...
#correlationplot #statistics #scientificgraphing #dataanalysis #DataVisualization #originpro2025b #originpro #originlab
#correlationplot #statistics #scientificgraphing #dataanalysis #DataVisualization #originpro2025b #originpro #originlab
Origin 2025b blog with videos of highlighting row or column wise min&max, top/bottom N or N%, most frequent/least frequent N or N%, outliers
blog.originlab.com/more-conditi...
#ConditionalFormatting #pareto #outlier #dataanalysis #statistics #scientificgraph #originlab #originpro #originpro2025b
blog.originlab.com/more-conditi...
#ConditionalFormatting #pareto #outlier #dataanalysis #statistics #scientificgraph #originlab #originpro #originpro2025b

More Conditional Formatting Methods in Origin 2025b
More conditional formatting methods are introduced in Origin 2025b to better highlight the selected data in worksheet. Highlight Max and Min Both column-wise and row-wise highlighting are support…
blog.originlab.com
October 15, 2025 at 12:59 PM
Origin 2025b blog with videos of highlighting row or column wise min&max, top/bottom N or N%, most frequent/least frequent N or N%, outliers
blog.originlab.com/more-conditi...
#ConditionalFormatting #pareto #outlier #dataanalysis #statistics #scientificgraph #originlab #originpro #originpro2025b
blog.originlab.com/more-conditi...
#ConditionalFormatting #pareto #outlier #dataanalysis #statistics #scientificgraph #originlab #originpro #originpro2025b
Origin's graph export feature keeps the highlighting of selected plots while fading out others, enabling key data to take center stage. A system variable is also available to customize the fade-out level. #DataVisualization #scientificgraphing #DataAnalysis #statistics #originpro2025b #originlab

Export graph with one data plot highlighted
YouTube video by OriginLab Corp.
youtu.be
October 7, 2025 at 1:17 PM
Origin's graph export feature keeps the highlighting of selected plots while fading out others, enabling key data to take center stage. A system variable is also available to customize the fade-out level. #DataVisualization #scientificgraphing #DataAnalysis #statistics #originpro2025b #originlab
Introducing Treemap in OriginPro 2025b blog.originlab.com/treemap-in-o... and experience it for yourself with a free trial download at www.originlab.com/2025b
#ScientificGraphing #DataAnalysis #MachineLearning #datascience #Statistics #OriginPro #OriginPro2025b #OriginLab #hierarchicalclustering
#ScientificGraphing #DataAnalysis #MachineLearning #datascience #Statistics #OriginPro #OriginPro2025b #OriginLab #hierarchicalclustering

Treemap in Origin 2025b
Origin provides multiple graph types to visualize hierarchical data structures. These include the Sunburst Chart, the Circle Packing Chart and the Dendrogram. In Origin 2025b, a new addition to thi…
blog.originlab.com
October 3, 2025 at 4:36 PM
Introducing Treemap in OriginPro 2025b blog.originlab.com/treemap-in-o... and experience it for yourself with a free trial download at www.originlab.com/2025b
#ScientificGraphing #DataAnalysis #MachineLearning #datascience #Statistics #OriginPro #OriginPro2025b #OriginLab #hierarchicalclustering
#ScientificGraphing #DataAnalysis #MachineLearning #datascience #Statistics #OriginPro #OriginPro2025b #OriginLab #hierarchicalclustering
Watch this video of how to fit data by group/category information in other column(s) in Origin.
#curvefitting #fitting #categoricaldata #DataVisualization #scientificgraphing #DataAnalysis #statistics #originpro #originpro2025b #originlab
#curvefitting #fitting #categoricaldata #DataVisualization #scientificgraphing #DataAnalysis #statistics #originpro #originpro2025b #originlab

Fit data with by group/category
YouTube video by OriginLab Corp.
youtu.be
October 1, 2025 at 1:45 PM
Watch this video of how to fit data by group/category information in other column(s) in Origin.
#curvefitting #fitting #categoricaldata #DataVisualization #scientificgraphing #DataAnalysis #statistics #originpro #originpro2025b #originlab
#curvefitting #fitting #categoricaldata #DataVisualization #scientificgraphing #DataAnalysis #statistics #originpro #originpro2025b #originlab
Use OriginPro’s Tolerance Interval app to conduct Sample Size calculations.
#ToleranceInterval #SampleSize #OriginPro #SixSigma #LeanManufacturing #AgileManufacturing #GreenBelt #BlackBelt #QualityImprovement #QualityControl #QualityAssurance #OriginPro #OriginPro2025b #OriginLab
#ToleranceInterval #SampleSize #OriginPro #SixSigma #LeanManufacturing #AgileManufacturing #GreenBelt #BlackBelt #QualityImprovement #QualityControl #QualityAssurance #OriginPro #OriginPro2025b #OriginLab

September 23, 2025 at 1:31 PM
Use OriginPro’s Tolerance Interval app to conduct Sample Size calculations.
#ToleranceInterval #SampleSize #OriginPro #SixSigma #LeanManufacturing #AgileManufacturing #GreenBelt #BlackBelt #QualityImprovement #QualityControl #QualityAssurance #OriginPro #OriginPro2025b #OriginLab
#ToleranceInterval #SampleSize #OriginPro #SixSigma #LeanManufacturing #AgileManufacturing #GreenBelt #BlackBelt #QualityImprovement #QualityControl #QualityAssurance #OriginPro #OriginPro2025b #OriginLab
Heatmap with Dendrogram is now directly accessible from the Plot menu in OriginPro 2025b
Learn more and download a free trial at www.originlab.com/2025b
#DataVisualization #scientificgraphing #DataAnalysis #statistics #originpro #originpro2025b #originlab
Learn more and download a free trial at www.originlab.com/2025b
#DataVisualization #scientificgraphing #DataAnalysis #statistics #originpro #originpro2025b #originlab

Heatmap with Dendrogram in Origin 2025b
Heatmap with Dendrogram is a powerful graphical representation that combines a heatmap with hierarchical clustering. The heatmap uses color gradients to display data intensity, while the dendrogram…
blog.originlab.com
September 19, 2025 at 1:51 PM
Heatmap with Dendrogram is now directly accessible from the Plot menu in OriginPro 2025b
Learn more and download a free trial at www.originlab.com/2025b
#DataVisualization #scientificgraphing #DataAnalysis #statistics #originpro #originpro2025b #originlab
Learn more and download a free trial at www.originlab.com/2025b
#DataVisualization #scientificgraphing #DataAnalysis #statistics #originpro #originpro2025b #originlab
Watch this video of how to set up database connection in Origin with an SQL server hosted on Microsoft Azure.
Learn more and download a free trial at www.originlab.com/2025b
#dataimport #database #statistics #scientificgraphing #originpro #originpro2025b #originlab
Learn more and download a free trial at www.originlab.com/2025b
#dataimport #database #statistics #scientificgraphing #originpro #originpro2025b #originlab

Setup Database Connection in Origin
YouTube video by OriginLab Corp.
youtu.be
September 17, 2025 at 1:54 PM
Watch this video of how to set up database connection in Origin with an SQL server hosted on Microsoft Azure.
Learn more and download a free trial at www.originlab.com/2025b
#dataimport #database #statistics #scientificgraphing #originpro #originpro2025b #originlab
Learn more and download a free trial at www.originlab.com/2025b
#dataimport #database #statistics #scientificgraphing #originpro #originpro2025b #originlab
For group of Origin users (network or nodelocked) that also use sharepoint, see how to set group folder on sharepoint so power user can publish template, fitting functions, etc. to all members.
#DataVisualization #scientificgraphing #DataAnalysis #statistics #originpro #originpro2025b #originlab
#DataVisualization #scientificgraphing #DataAnalysis #statistics #originpro #originpro2025b #originlab

SharePoint for Origin Group Folder
Origin offers a Group Folder feature that allows one or more power users to create a shared folder over the network and designate their Origin installation as the Group Leader. The Group Leader can…
blog.originlab.com
September 15, 2025 at 7:00 PM
For group of Origin users (network or nodelocked) that also use sharepoint, see how to set group folder on sharepoint so power user can publish template, fitting functions, etc. to all members.
#DataVisualization #scientificgraphing #DataAnalysis #statistics #originpro #originpro2025b #originlab
#DataVisualization #scientificgraphing #DataAnalysis #statistics #originpro #originpro2025b #originlab
New in Origin2025b: interactive plot comparison and analysis under specified filter conditions, now enabled by Browser + Slicer graph
Learn more and download a free trial at www.originlab.com/2025b
#DataVisualization #scientificgraphing #DataAnalysis #statistics #originpro #originpro2025b #originlab
Learn more and download a free trial at www.originlab.com/2025b
#DataVisualization #scientificgraphing #DataAnalysis #statistics #originpro #originpro2025b #originlab

Slicer on Browser Graph
YouTube video by OriginLab Corp.
youtu.be
September 12, 2025 at 1:21 PM
New in Origin2025b: interactive plot comparison and analysis under specified filter conditions, now enabled by Browser + Slicer graph
Learn more and download a free trial at www.originlab.com/2025b
#DataVisualization #scientificgraphing #DataAnalysis #statistics #originpro #originpro2025b #originlab
Learn more and download a free trial at www.originlab.com/2025b
#DataVisualization #scientificgraphing #DataAnalysis #statistics #originpro #originpro2025b #originlab
Origin 2025b's Heatmap with Grouping to highlight patterns, and differences within and across grouped data sections.
Learn more and download a free trial at www.originlab.com/2025b
#DataVisualization #scientificgraphing #DataAnalysis #statistics #originpro #originpro2025b #originlab
Learn more and download a free trial at www.originlab.com/2025b
#DataVisualization #scientificgraphing #DataAnalysis #statistics #originpro #originpro2025b #originlab

Heatmap with Grouping in Origin 2025b
The Heatmap with Grouping is a new feature introduced in Origin 2025b that visually represents matrix or tabular data with added grouping distinctions. It features customizable gaps between groups …
blog.originlab.com
September 10, 2025 at 2:32 PM
Origin 2025b's Heatmap with Grouping to highlight patterns, and differences within and across grouped data sections.
Learn more and download a free trial at www.originlab.com/2025b
#DataVisualization #scientificgraphing #DataAnalysis #statistics #originpro #originpro2025b #originlab
Learn more and download a free trial at www.originlab.com/2025b
#DataVisualization #scientificgraphing #DataAnalysis #statistics #originpro #originpro2025b #originlab
Browser Graph with left panel to interactively pick plots to compare and analyze multiple datasets in same or multiple sheets. Gadget can be applied there. youtu.be/vOOuW2empMM
#DataVisualization #scientificgraphing #DataAnalysis #statistics #originpro #originpro2025b #originlab
#DataVisualization #scientificgraphing #DataAnalysis #statistics #originpro #originpro2025b #originlab

Browser Graphs
YouTube video by OriginLab Corp.
youtu.be
September 8, 2025 at 12:54 PM
Browser Graph with left panel to interactively pick plots to compare and analyze multiple datasets in same or multiple sheets. Gadget can be applied there. youtu.be/vOOuW2empMM
#DataVisualization #scientificgraphing #DataAnalysis #statistics #originpro #originpro2025b #originlab
#DataVisualization #scientificgraphing #DataAnalysis #statistics #originpro #originpro2025b #originlab
Watch how to plot spectroscopy data by Y offsets and how to customize the offsets. Drag plot to offset is also supported. Please note that data must be grouped to allow stacking.
#spectroscopy #statistics #scientificgraphing #originpro #originpro2025b #originlab
#spectroscopy #statistics #scientificgraphing #originpro #originpro2025b #originlab

Plotting Spectroscopy Data as Stacked Lines by Y Offset
YouTube video by OriginLab Corp.
youtu.be
September 5, 2025 at 3:29 PM
Watch how to plot spectroscopy data by Y offsets and how to customize the offsets. Drag plot to offset is also supported. Please note that data must be grouped to allow stacking.
#spectroscopy #statistics #scientificgraphing #originpro #originpro2025b #originlab
#spectroscopy #statistics #scientificgraphing #originpro #originpro2025b #originlab
New in Origin 2025b to extract sliced data to a new workbook for future analysis or graphing.
Learn more and download a free trial at www.originlab.com/2025b
#dataextraction #datavisualization #Statistics #DataAnalysis #scientificgraphing #originpro #originpro2025b #originlab
Learn more and download a free trial at www.originlab.com/2025b
#dataextraction #datavisualization #Statistics #DataAnalysis #scientificgraphing #originpro #originpro2025b #originlab

Extract Data from Slicer
YouTube video by OriginLab Corp.
youtu.be
September 4, 2025 at 1:51 PM
New in Origin 2025b to extract sliced data to a new workbook for future analysis or graphing.
Learn more and download a free trial at www.originlab.com/2025b
#dataextraction #datavisualization #Statistics #DataAnalysis #scientificgraphing #originpro #originpro2025b #originlab
Learn more and download a free trial at www.originlab.com/2025b
#dataextraction #datavisualization #Statistics #DataAnalysis #scientificgraphing #originpro #originpro2025b #originlab

OriginLab is amazing. It’s pricey, but I believe there’s a free trial
September 3, 2025 at 5:05 PM
OriginLab is amazing. It’s pricey, but I believe there’s a free trial
Check out our blog blog.originlab.com/enhanced-qua... to see what’s new in Origin 2025b SR1, including streamlined interface with search bar, plus updates across all Quality Improvement apps
#QualityImprovement #Statistics #DataAnalysis #scientificgraphing #originpro #originpro2025b #originlab
#QualityImprovement #Statistics #DataAnalysis #scientificgraphing #originpro #originpro2025b #originlab

Enhanced Quality Improvement and Stats Features in OriginPro 2025b SR1
Over the past several versions, we have been adding more capabilities to OriginPro for statistical graphing and analysis, particularly in the area of Quality Improvement. In this blog, we will cov…
blog.originlab.com
September 2, 2025 at 1:46 PM
Check out our blog blog.originlab.com/enhanced-qua... to see what’s new in Origin 2025b SR1, including streamlined interface with search bar, plus updates across all Quality Improvement apps
#QualityImprovement #Statistics #DataAnalysis #scientificgraphing #originpro #originpro2025b #originlab
#QualityImprovement #Statistics #DataAnalysis #scientificgraphing #originpro #originpro2025b #originlab
Set digits to 0 and adjust system variable @BIT (big intger threshold) to show big numbers as full integer instead with scientific notation
Learn more and download a free trial at www.originlab.com/2025b
#datahandling #statistics #scientificgraphing #originpro #originpro2025b #originlab
Learn more and download a free trial at www.originlab.com/2025b
#datahandling #statistics #scientificgraphing #originpro #originpro2025b #originlab
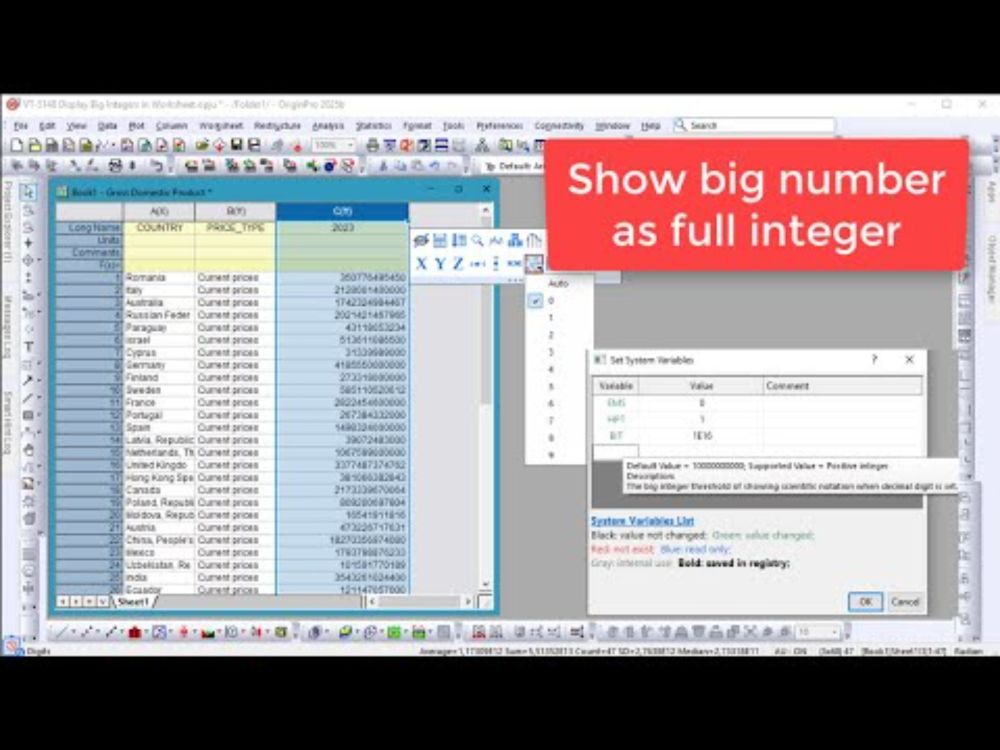
Display Big Integers in Worksheet
YouTube video by OriginLab Corp.
youtu.be
August 29, 2025 at 2:12 PM
Set digits to 0 and adjust system variable @BIT (big intger threshold) to show big numbers as full integer instead with scientific notation
Learn more and download a free trial at www.originlab.com/2025b
#datahandling #statistics #scientificgraphing #originpro #originpro2025b #originlab
Learn more and download a free trial at www.originlab.com/2025b
#datahandling #statistics #scientificgraphing #originpro #originpro2025b #originlab
Click the corn of Origin 2025b to quickly load Origin files and import data files again. More recently imported data are also available under Data menu.
Learn more and download a free trial at www.originlab.com/2025b
#dataimport #statistics #scientificgraphing #originpro #originpro2025b #originlab
Learn more and download a free trial at www.originlab.com/2025b
#dataimport #statistics #scientificgraphing #originpro #originpro2025b #originlab

Recent Files Button for Recent Origin Files and Recent Import
YouTube video by OriginLab Corp.
youtu.be
August 27, 2025 at 3:12 PM
Click the corn of Origin 2025b to quickly load Origin files and import data files again. More recently imported data are also available under Data menu.
Learn more and download a free trial at www.originlab.com/2025b
#dataimport #statistics #scientificgraphing #originpro #originpro2025b #originlab
Learn more and download a free trial at www.originlab.com/2025b
#dataimport #statistics #scientificgraphing #originpro #originpro2025b #originlab
Origin 2025b: Selected cells are colored when defining cell formula similar to Excel. Ctrl+E to see which cells contain cell formula or link.
Learn more and download a free trial at www.originlab.com/2025b
#datahandling #statistics #scientificgraphing #originpro #originpro2025b #originlab
Learn more and download a free trial at www.originlab.com/2025b
#datahandling #statistics #scientificgraphing #originpro #originpro2025b #originlab

Interactive Cell Referencing
YouTube video by OriginLab Corp.
youtu.be
August 25, 2025 at 2:13 PM
Origin 2025b: Selected cells are colored when defining cell formula similar to Excel. Ctrl+E to see which cells contain cell formula or link.
Learn more and download a free trial at www.originlab.com/2025b
#datahandling #statistics #scientificgraphing #originpro #originpro2025b #originlab
Learn more and download a free trial at www.originlab.com/2025b
#datahandling #statistics #scientificgraphing #originpro #originpro2025b #originlab