


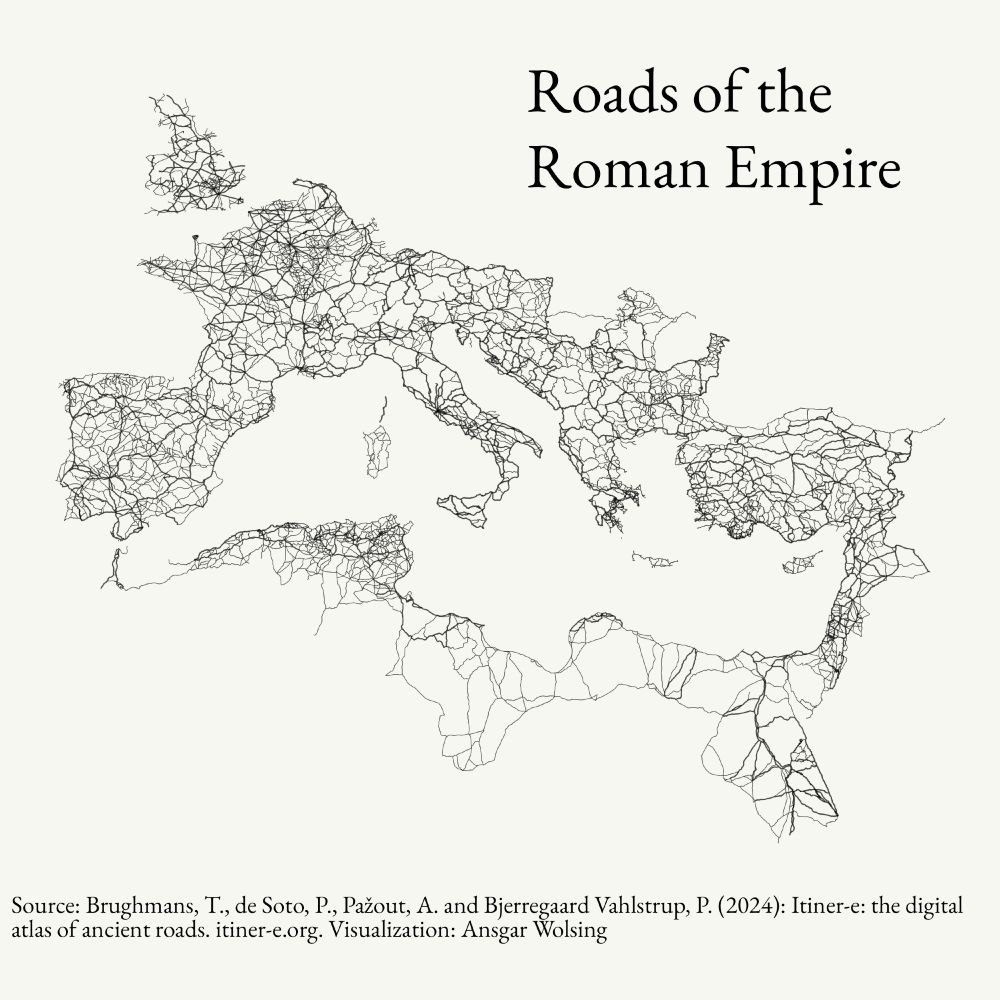
All roads lead to Rome?
Well, here’s a map to check that saying.
#30DayMapChallenge | Day 11 - Minimal map #rstats #ggplot2
Well, here’s a map to check that saying.
#30DayMapChallenge | Day 11 - Minimal map #rstats #ggplot2
November 11, 2025 at 11:37 AM
All roads lead to Rome?
Well, here’s a map to check that saying.
#30DayMapChallenge | Day 11 - Minimal map #rstats #ggplot2
Well, here’s a map to check that saying.
#30DayMapChallenge | Day 11 - Minimal map #rstats #ggplot2

A minimal map of the world's population for day 11 of the #30DayMapChallenge!
#RStats #ggplot2 #DataViz
#RStats #ggplot2 #DataViz

November 11, 2025 at 10:02 AM
A minimal map of the world's population for day 11 of the #30DayMapChallenge!
#RStats #ggplot2 #DataViz
#RStats #ggplot2 #DataViz

Re-up because of an error in the legend 😅.
Late entry for Day 10 of the #30DayMapChallenge - Air.
Mapping average wind speed from November 5, 2025.
Code: github.com/rajodm/30Day...
#dataviz #rstats #ggplot2
Late entry for Day 10 of the #30DayMapChallenge - Air.
Mapping average wind speed from November 5, 2025.
Code: github.com/rajodm/30Day...
#dataviz #rstats #ggplot2

November 12, 2025 at 7:00 AM
Re-up because of an error in the legend 😅.
Late entry for Day 10 of the #30DayMapChallenge - Air.
Mapping average wind speed from November 5, 2025.
Code: github.com/rajodm/30Day...
#dataviz #rstats #ggplot2
Late entry for Day 10 of the #30DayMapChallenge - Air.
Mapping average wind speed from November 5, 2025.
Code: github.com/rajodm/30Day...
#dataviz #rstats #ggplot2
The prompt for day 12 of the #30DayMapChallenge is a "map from 2125", and this one *almost* fits that description! This shows the areas of Scotland likely to be affected by coastal erosion by 2100 🗺️
#RStats #ggplot2 #DataViz
#RStats #ggplot2 #DataViz

November 12, 2025 at 7:51 AM
The prompt for day 12 of the #30DayMapChallenge is a "map from 2125", and this one *almost* fits that description! This shows the areas of Scotland likely to be affected by coastal erosion by 2100 🗺️
#RStats #ggplot2 #DataViz
#RStats #ggplot2 #DataViz

tmap or ggplot2 for maps? 🗺️
David O’Sullivan breaks down the trade-offs in a blog post.
URL: dosull.github.io/posts/2024-1...
#RStats #RSpatial #Maps #tmap #ggplot2
David O’Sullivan breaks down the trade-offs in a blog post.
URL: dosull.github.io/posts/2024-1...
#RStats #RSpatial #Maps #tmap #ggplot2

tmap vs. ggplot2 for mapping – Geospatial Stuff
For me at least the choice between ggplot2 and tmap is an ongoing question. Here are my latest thoughts on the subject (with code).
dosull.github.io
November 12, 2025 at 2:02 PM
It's Day 10 of the #30DayMapChallenge and for the "air" prompt, I decided to look at air quality data before and after Bonfire Night in the UK 🎇
#RStats #ggplot2 #DataViz
#RStats #ggplot2 #DataViz

November 10, 2025 at 6:51 PM
It's Day 10 of the #30DayMapChallenge and for the "air" prompt, I decided to look at air quality data before and after Bonfire Night in the UK 🎇
#RStats #ggplot2 #DataViz
#RStats #ggplot2 #DataViz
#Day07 of #30DayMapChallenge on Accessibility
This map shows the time needed to cycle from Bains des Paquis (a popular fondue and sauna place in Geneva)
🆕 1st time use of the `osmr` package to define #isochrones.
Gallery: guillaume-noblet.com/30DayMapChal...
#dataviz #rstats #ggplot2 #gis #map
This map shows the time needed to cycle from Bains des Paquis (a popular fondue and sauna place in Geneva)
🆕 1st time use of the `osmr` package to define #isochrones.
Gallery: guillaume-noblet.com/30DayMapChal...
#dataviz #rstats #ggplot2 #gis #map

November 11, 2025 at 10:41 AM
#Day07 of #30DayMapChallenge on Accessibility
This map shows the time needed to cycle from Bains des Paquis (a popular fondue and sauna place in Geneva)
🆕 1st time use of the `osmr` package to define #isochrones.
Gallery: guillaume-noblet.com/30DayMapChal...
#dataviz #rstats #ggplot2 #gis #map
This map shows the time needed to cycle from Bains des Paquis (a popular fondue and sauna place in Geneva)
🆕 1st time use of the `osmr` package to define #isochrones.
Gallery: guillaume-noblet.com/30DayMapChal...
#dataviz #rstats #ggplot2 #gis #map
This week's #TidyTuesday data is from the WHO and looks at rates of TB cases and deaths around the world 📊
I used the {ggh4x} package to get this custom facet layout with large chart for global data, and then small multiples for each WHO region 🗺️
#DataViz #ggplot2 #RStats
I used the {ggh4x} package to get this custom facet layout with large chart for global data, and then small multiples for each WHO region 🗺️
#DataViz #ggplot2 #RStats

November 10, 2025 at 2:22 PM
This week's #TidyTuesday data is from the WHO and looks at rates of TB cases and deaths around the world 📊
I used the {ggh4x} package to get this custom facet layout with large chart for global data, and then small multiples for each WHO region 🗺️
#DataViz #ggplot2 #RStats
I used the {ggh4x} package to get this custom facet layout with large chart for global data, and then small multiples for each WHO region 🗺️
#DataViz #ggplot2 #RStats

WHO TB Burden Data: Incidence, Mortality, and Population for #TidyTuesday, Week 45.
Thank you @darakhshann.bsky.social for curating this week's dataset.
#rstats #dataviz #ggplot2
Thank you @darakhshann.bsky.social for curating this week's dataset.
#rstats #dataviz #ggplot2

November 11, 2025 at 2:07 AM
WHO TB Burden Data: Incidence, Mortality, and Population for #TidyTuesday, Week 45.
Thank you @darakhshann.bsky.social for curating this week's dataset.
#rstats #dataviz #ggplot2
Thank you @darakhshann.bsky.social for curating this week's dataset.
#rstats #dataviz #ggplot2

time for #tidytuesday pt2
a simple one, but with a gradient to distract, lol
code at: barreiro-r.github.io/tidytuesday/
#r4ds #ggplot2 #dataviz
a simple one, but with a gradient to distract, lol
code at: barreiro-r.github.io/tidytuesday/
#r4ds #ggplot2 #dataviz

November 10, 2025 at 9:23 PM
time for #tidytuesday pt2
a simple one, but with a gradient to distract, lol
code at: barreiro-r.github.io/tidytuesday/
#r4ds #ggplot2 #dataviz
a simple one, but with a gradient to distract, lol
code at: barreiro-r.github.io/tidytuesday/
#r4ds #ggplot2 #dataviz
How long does it take your kid to get to their secondary school in Cologne?
It depends on where you (and your child) live and what type of secondary school your child attends. (Path times to the nearest school by bike.)
#30DayMapChallenge | Day 03 - Polygons #rstats #ggplot2
It depends on where you (and your child) live and what type of secondary school your child attends. (Path times to the nearest school by bike.)
#30DayMapChallenge | Day 03 - Polygons #rstats #ggplot2

November 7, 2025 at 6:22 PM
How long does it take your kid to get to their secondary school in Cologne?
It depends on where you (and your child) live and what type of secondary school your child attends. (Path times to the nearest school by bike.)
#30DayMapChallenge | Day 03 - Polygons #rstats #ggplot2
It depends on where you (and your child) live and what type of secondary school your child attends. (Path times to the nearest school by bike.)
#30DayMapChallenge | Day 03 - Polygons #rstats #ggplot2
A little bit of #ggplot2 and #rayshader for the "dimensions" prompt on day 6 of the #30DayMapChallenge! 🌧️
#RStats #DataViz
#RStats #DataViz

November 6, 2025 at 11:43 PM
A little bit of #ggplot2 and #rayshader for the "dimensions" prompt on day 6 of the #30DayMapChallenge! 🌧️
#RStats #DataViz
#RStats #DataViz

📊 #TidyTuesday – 2025 W45 | WHO Tuberculosis Global Burden Estimates
.
🔗: stevenponce.netlify.app/data_visuali...
.
#rstats | #r4ds | #dataviz | #ggplot2
.
🔗: stevenponce.netlify.app/data_visuali...
.
#rstats | #r4ds | #dataviz | #ggplot2

November 9, 2025 at 7:08 PM
📊 #TidyTuesday – 2025 W45 | WHO Tuberculosis Global Burden Estimates
.
🔗: stevenponce.netlify.app/data_visuali...
.
#rstats | #r4ds | #dataviz | #ggplot2
.
🔗: stevenponce.netlify.app/data_visuali...
.
#rstats | #r4ds | #dataviz | #ggplot2
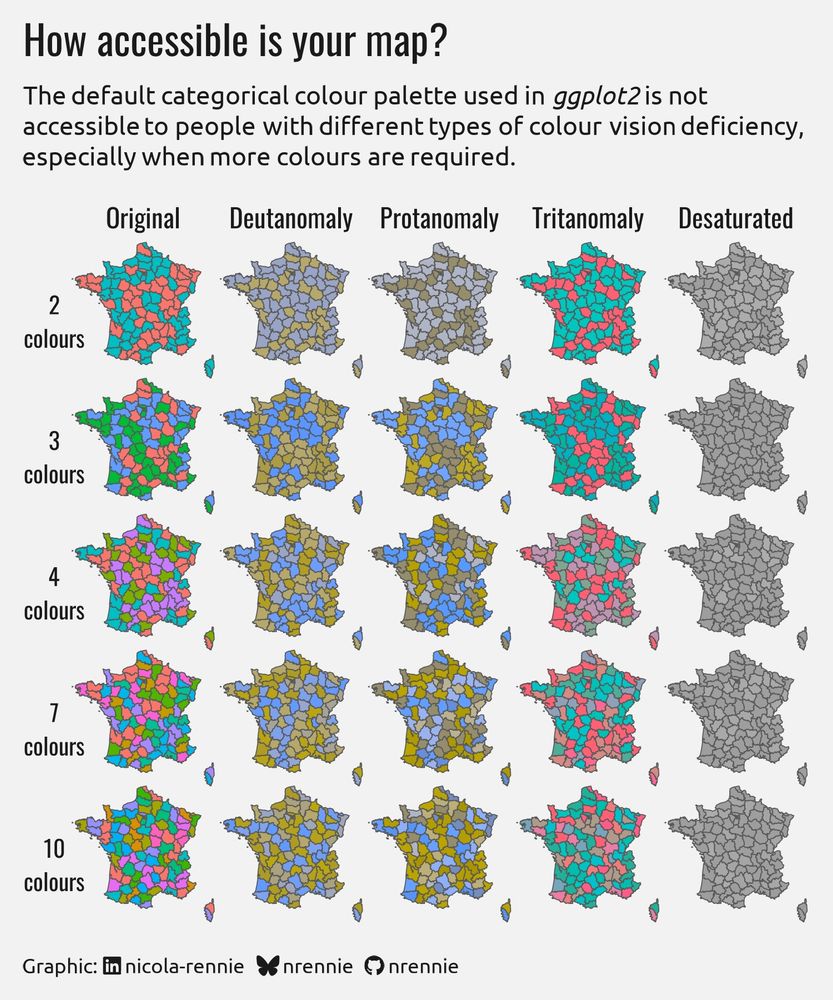
For the "accessibility" prompt on day 7 of the #30DayMapChallenge, I decided to investigate how accessible the default #ggplot2 colours are to people with different types of colour vision deficiency (and for different numbers of colours used). 🎨
#RStats #DataViz
#RStats #DataViz
November 7, 2025 at 5:39 PM
For the "accessibility" prompt on day 7 of the #30DayMapChallenge, I decided to investigate how accessible the default #ggplot2 colours are to people with different types of colour vision deficiency (and for different numbers of colours used). 🎨
#RStats #DataViz
#RStats #DataViz
3D Tanaka contour map of Scotland with #rayshader for Day 6 of the #30DayMapChallenge - Dimensions.
Code: github.com/rajodm/30Day...
Thanks @milos-makes-maps.bsky.social for the helpful tutorial!
#dataviz #rstats #ggplot2
Code: github.com/rajodm/30Day...
Thanks @milos-makes-maps.bsky.social for the helpful tutorial!
#dataviz #rstats #ggplot2

November 7, 2025 at 10:40 AM
3D Tanaka contour map of Scotland with #rayshader for Day 6 of the #30DayMapChallenge - Dimensions.
Code: github.com/rajodm/30Day...
Thanks @milos-makes-maps.bsky.social for the helpful tutorial!
#dataviz #rstats #ggplot2
Code: github.com/rajodm/30Day...
Thanks @milos-makes-maps.bsky.social for the helpful tutorial!
#dataviz #rstats #ggplot2

🎨 Recording now live!
Developing Your #DataVisualisation Skills in #ggplot2 with @nrennie.bsky.social
Watch the creative process exploring the #TidyTuesday cats dataset 🐈
📚 Materials & links:
🔗 nrennie.rbind.io/talks/rladies-rome-ggplot2
#RLadies #ggplot2 #TidyTuesday @fgazzelloni.bsky.social
Developing Your #DataVisualisation Skills in #ggplot2 with @nrennie.bsky.social
Watch the creative process exploring the #TidyTuesday cats dataset 🐈
📚 Materials & links:
🔗 nrennie.rbind.io/talks/rladies-rome-ggplot2
#RLadies #ggplot2 #TidyTuesday @fgazzelloni.bsky.social

Developing your data visualisation skills in ggplot2 – Nicola Rennie
We’ll be working through the process of developing a visualisation in ggplot2. Some knowledge of the tidyverse will be helpful, but all of the code in this session will be explained and available…
nrennie.rbind.io
November 8, 2025 at 8:54 PM
🎨 Recording now live!
Developing Your #DataVisualisation Skills in #ggplot2 with @nrennie.bsky.social
Watch the creative process exploring the #TidyTuesday cats dataset 🐈
📚 Materials & links:
🔗 nrennie.rbind.io/talks/rladies-rome-ggplot2
#RLadies #ggplot2 #TidyTuesday @fgazzelloni.bsky.social
Developing Your #DataVisualisation Skills in #ggplot2 with @nrennie.bsky.social
Watch the creative process exploring the #TidyTuesday cats dataset 🐈
📚 Materials & links:
🔗 nrennie.rbind.io/talks/rladies-rome-ggplot2
#RLadies #ggplot2 #TidyTuesday @fgazzelloni.bsky.social
Days 08 and 11 of #30DayMapChallenge bridged into one: I minimally represented urbanism via the non-urban fabric of the Geneva area. Decided it was minimal although not that much.
Code: guillaume-noblet.com/30DayMapChal...
#ggplot2 #dataviz #maps #rstats
Code: guillaume-noblet.com/30DayMapChal...
#ggplot2 #dataviz #maps #rstats

November 12, 2025 at 7:55 AM
Days 08 and 11 of #30DayMapChallenge bridged into one: I minimally represented urbanism via the non-urban fabric of the Geneva area. Decided it was minimal although not that much.
Code: guillaume-noblet.com/30DayMapChal...
#ggplot2 #dataviz #maps #rstats
Code: guillaume-noblet.com/30DayMapChal...
#ggplot2 #dataviz #maps #rstats

Day 8 of the #30DayMapChallenge and I'm plotting a road network of Montréal!
#DataViz #RStats #ggplot2
#DataViz #RStats #ggplot2

November 8, 2025 at 2:48 PM
Day 8 of the #30DayMapChallenge and I'm plotting a road network of Montréal!
#DataViz #RStats #ggplot2
#DataViz #RStats #ggplot2
Day 6 of the #30DayMapChallenge makes things 3D! I took my elevation map from yesterday and made it so with the {rayshader} package.
#DataViz #RStats #ggplot2
#DataViz #RStats #ggplot2

November 7, 2025 at 1:08 AM
Day 6 of the #30DayMapChallenge makes things 3D! I took my elevation map from yesterday and made it so with the {rayshader} package.
#DataViz #RStats #ggplot2
#DataViz #RStats #ggplot2
📊 #MakeoverMonday – 2025 W44 | WWII Veteran Statistics
.
🔗: stevenponce.netlify.app/data_visuali...
.
#rstats | #DataFam | #dataviz | #ggplot2
.
🔗: stevenponce.netlify.app/data_visuali...
.
#rstats | #DataFam | #dataviz | #ggplot2

November 11, 2025 at 11:13 PM
📊 #MakeoverMonday – 2025 W44 | WWII Veteran Statistics
.
🔗: stevenponce.netlify.app/data_visuali...
.
#rstats | #DataFam | #dataviz | #ggplot2
.
🔗: stevenponce.netlify.app/data_visuali...
.
#rstats | #DataFam | #dataviz | #ggplot2
For Day 06 of the #30DayMapChallenge, I used:
📖 Wikipedia retrieving tallest building list with `rvest`
🏔️ `tidyterra` to retrieve elevation shades
🔮 Refined top buildings's labels and lines with `ggrepel`
Code: guillaume-noblet.com/30DayMapChal...
#rstats #gis #dataviz #ggplot2 #terra
📖 Wikipedia retrieving tallest building list with `rvest`
🏔️ `tidyterra` to retrieve elevation shades
🔮 Refined top buildings's labels and lines with `ggrepel`
Code: guillaume-noblet.com/30DayMapChal...
#rstats #gis #dataviz #ggplot2 #terra

November 8, 2025 at 3:52 PM
For Day 06 of the #30DayMapChallenge, I used:
📖 Wikipedia retrieving tallest building list with `rvest`
🏔️ `tidyterra` to retrieve elevation shades
🔮 Refined top buildings's labels and lines with `ggrepel`
Code: guillaume-noblet.com/30DayMapChal...
#rstats #gis #dataviz #ggplot2 #terra
📖 Wikipedia retrieving tallest building list with `rvest`
🏔️ `tidyterra` to retrieve elevation shades
🔮 Refined top buildings's labels and lines with `ggrepel`
Code: guillaume-noblet.com/30DayMapChal...
#rstats #gis #dataviz #ggplot2 #terra
It's day 8 of the #30DayMapChallenge and I decided to explore the types of buildings in the urban area around Porto!
#RStats #ggplot2 #DataViz
#RStats #ggplot2 #DataViz

November 8, 2025 at 3:43 PM
It's day 8 of the #30DayMapChallenge and I decided to explore the types of buildings in the urban area around Porto!
#RStats #ggplot2 #DataViz
#RStats #ggplot2 #DataViz

I ran into this issue with ggsankey before as well. Adapting the code suggested here did the trick for me:
github.com/davidsjoberg...
#ggplot #ggplot2 #rstats
github.com/davidsjoberg...
#ggplot #ggplot2 #rstats
Add label to flow · Issue #9 · davidsjoberg/ggsankey
Thanks for this great package! While using ggsankey I sometimes would like to add the numbers of objects per flow to the visualization. If I understand the documentation correctly this is not curre...
github.com
November 7, 2025 at 12:57 PM
I ran into this issue with ggsankey before as well. Adapting the code suggested here did the trick for me:
github.com/davidsjoberg...
#ggplot #ggplot2 #rstats
github.com/davidsjoberg...
#ggplot #ggplot2 #rstats
It's day 10 of the #30DayMapChallenge and the prompt is 'air', so I plotted global air temperature!
#DataViz #RStats #ggplot2
#DataViz #RStats #ggplot2

November 11, 2025 at 3:14 AM
It's day 10 of the #30DayMapChallenge and the prompt is 'air', so I plotted global air temperature!
#DataViz #RStats #ggplot2
#DataViz #RStats #ggplot2
I had a great time talking about the process of creating charts with ggplot2 at @rladiesrome.bsky.social tonight! 📊
Slides and code from the session can be found here: nrennie.rbind.io/talks/rladie...
#RStats #DataViz #ggplot2 #RLadies
Slides and code from the session can be found here: nrennie.rbind.io/talks/rladie...
#RStats #DataViz #ggplot2 #RLadies

November 4, 2025 at 8:51 PM
I had a great time talking about the process of creating charts with ggplot2 at @rladiesrome.bsky.social tonight! 📊
Slides and code from the session can be found here: nrennie.rbind.io/talks/rladie...
#RStats #DataViz #ggplot2 #RLadies
Slides and code from the session can be found here: nrennie.rbind.io/talks/rladie...
#RStats #DataViz #ggplot2 #RLadies