


Woodwell Climate Research Center
@woodwellclimate.bsky.social
Woodwell Climate conducts science for solutions and partners with leaders and communities for just, meaningful impact to address the climate crisis.
8️⃣ General Circulation Models, or GCMs, help us understand our changing climate. This map visualizes temp change as a substitute for true elevation in a 3d map, illustrating the disproportionate effect of climate change on the Arctic.
Data Source: KNMI Climate Explorer
🗺️: by @gfiske.bsky.social
Data Source: KNMI Climate Explorer
🗺️: by @gfiske.bsky.social

October 15, 2025 at 3:49 PM
8️⃣ General Circulation Models, or GCMs, help us understand our changing climate. This map visualizes temp change as a substitute for true elevation in a 3d map, illustrating the disproportionate effect of climate change on the Arctic.
Data Source: KNMI Climate Explorer
🗺️: by @gfiske.bsky.social
Data Source: KNMI Climate Explorer
🗺️: by @gfiske.bsky.social
Like to vote for your favorite ⬇️
7️⃣ This data visualization of hurricane Beryl uses federal data to put the story of climate change on the map. Higher global temperatures will cause hurricanes to survive longer over land before dissipating.
Data Source: GOES dataset
🗺️: by @gfiske.bsky.social
7️⃣ This data visualization of hurricane Beryl uses federal data to put the story of climate change on the map. Higher global temperatures will cause hurricanes to survive longer over land before dissipating.
Data Source: GOES dataset
🗺️: by @gfiske.bsky.social

October 15, 2025 at 3:49 PM
Like to vote for your favorite ⬇️
7️⃣ This data visualization of hurricane Beryl uses federal data to put the story of climate change on the map. Higher global temperatures will cause hurricanes to survive longer over land before dissipating.
Data Source: GOES dataset
🗺️: by @gfiske.bsky.social
7️⃣ This data visualization of hurricane Beryl uses federal data to put the story of climate change on the map. Higher global temperatures will cause hurricanes to survive longer over land before dissipating.
Data Source: GOES dataset
🗺️: by @gfiske.bsky.social
6️⃣ An artistic rendition of the Lena River Delta in Russia that represents the realities of our changing Arctic. Since 2003, Woodwell Climate’s ArcticGRO has provided essential data about the biogeochemistry and discharge of the largest Arctic rivers.
Data Source: ArcticDEM
🗺️: by @gfiske.bsky.social
Data Source: ArcticDEM
🗺️: by @gfiske.bsky.social

October 15, 2025 at 3:42 PM
6️⃣ An artistic rendition of the Lena River Delta in Russia that represents the realities of our changing Arctic. Since 2003, Woodwell Climate’s ArcticGRO has provided essential data about the biogeochemistry and discharge of the largest Arctic rivers.
Data Source: ArcticDEM
🗺️: by @gfiske.bsky.social
Data Source: ArcticDEM
🗺️: by @gfiske.bsky.social
Like to vote for your favorite⬇️
5️⃣ To understand the impacts of abrupt thaw, @permafrostpathways.bsky.social is using the features in this map to train a model to identify changes in the Arctic. This is a tributary of the Taz River in Siberia, Russia.
Data Source: ArcticDEM
🗺️: @gfiske.bsky.social
5️⃣ To understand the impacts of abrupt thaw, @permafrostpathways.bsky.social is using the features in this map to train a model to identify changes in the Arctic. This is a tributary of the Taz River in Siberia, Russia.
Data Source: ArcticDEM
🗺️: @gfiske.bsky.social

October 15, 2025 at 3:42 PM
Like to vote for your favorite⬇️
5️⃣ To understand the impacts of abrupt thaw, @permafrostpathways.bsky.social is using the features in this map to train a model to identify changes in the Arctic. This is a tributary of the Taz River in Siberia, Russia.
Data Source: ArcticDEM
🗺️: @gfiske.bsky.social
5️⃣ To understand the impacts of abrupt thaw, @permafrostpathways.bsky.social is using the features in this map to train a model to identify changes in the Arctic. This is a tributary of the Taz River in Siberia, Russia.
Data Source: ArcticDEM
🗺️: @gfiske.bsky.social
4️⃣This shows the presence of ship activity in the Arctic Ocean from 2009-2018. Patterns of blue (low ship numbers) to white (high ship numbers) reflect the human presence in this new, largely becoming ice-free, part of the world.
Data Source: Berkman et al 2020, Esri.
Map by @gfiske.bsky.social
Data Source: Berkman et al 2020, Esri.
Map by @gfiske.bsky.social

October 14, 2025 at 7:05 PM
4️⃣This shows the presence of ship activity in the Arctic Ocean from 2009-2018. Patterns of blue (low ship numbers) to white (high ship numbers) reflect the human presence in this new, largely becoming ice-free, part of the world.
Data Source: Berkman et al 2020, Esri.
Map by @gfiske.bsky.social
Data Source: Berkman et al 2020, Esri.
Map by @gfiske.bsky.social
Like to vote for your favorite ⬇️
3️⃣This art shows elevation data from the ArcticDEM project (NGA-NSF) for the Taz River in north-central Siberia. The topographic elevation was colored with earth tones to vary from low (very dark) to high (light).
Data source: ArcticDEM
Map by @gfiske.bsky.social
3️⃣This art shows elevation data from the ArcticDEM project (NGA-NSF) for the Taz River in north-central Siberia. The topographic elevation was colored with earth tones to vary from low (very dark) to high (light).
Data source: ArcticDEM
Map by @gfiske.bsky.social

October 14, 2025 at 7:05 PM
Like to vote for your favorite ⬇️
3️⃣This art shows elevation data from the ArcticDEM project (NGA-NSF) for the Taz River in north-central Siberia. The topographic elevation was colored with earth tones to vary from low (very dark) to high (light).
Data source: ArcticDEM
Map by @gfiske.bsky.social
3️⃣This art shows elevation data from the ArcticDEM project (NGA-NSF) for the Taz River in north-central Siberia. The topographic elevation was colored with earth tones to vary from low (very dark) to high (light).
Data source: ArcticDEM
Map by @gfiske.bsky.social
2️⃣ Forests hold mountains of carbon. The Amazon Rainforest is one of the world’s most carbon-rich forests and tropical forests are one of the only large-scale tools available to combat global warming.
Data source: thecarbonsource.org
Map by @gfiske.bsky.social
Data source: thecarbonsource.org
Map by @gfiske.bsky.social

October 14, 2025 at 7:01 PM
2️⃣ Forests hold mountains of carbon. The Amazon Rainforest is one of the world’s most carbon-rich forests and tropical forests are one of the only large-scale tools available to combat global warming.
Data source: thecarbonsource.org
Map by @gfiske.bsky.social
Data source: thecarbonsource.org
Map by @gfiske.bsky.social
Like to vote for your favorite ⬇️
1️⃣ This map demonstrates the power and quality of the ArcticDEM dataset. We use this high resolution elevation data in our mapping of Arctic abrupt thaw features.
Data Source: ArcticDEM
🗺️: @gfiske.bsky.social
1️⃣ This map demonstrates the power and quality of the ArcticDEM dataset. We use this high resolution elevation data in our mapping of Arctic abrupt thaw features.
Data Source: ArcticDEM
🗺️: @gfiske.bsky.social

October 14, 2025 at 7:01 PM
Like to vote for your favorite ⬇️
1️⃣ This map demonstrates the power and quality of the ArcticDEM dataset. We use this high resolution elevation data in our mapping of Arctic abrupt thaw features.
Data Source: ArcticDEM
🗺️: @gfiske.bsky.social
1️⃣ This map demonstrates the power and quality of the ArcticDEM dataset. We use this high resolution elevation data in our mapping of Arctic abrupt thaw features.
Data Source: ArcticDEM
🗺️: @gfiske.bsky.social
We are kicking off the mappiest week of the year - our first Map Bracket Showdown! Starting today, we’ll post head to head competitions of some of @gfiske.bsky.social gorgeous storytelling, and innovative data visualizations.
Vote for your favorites and learn about the science behind the art.
Vote for your favorites and learn about the science behind the art.

October 14, 2025 at 2:59 PM
We are kicking off the mappiest week of the year - our first Map Bracket Showdown! Starting today, we’ll post head to head competitions of some of @gfiske.bsky.social gorgeous storytelling, and innovative data visualizations.
Vote for your favorites and learn about the science behind the art.
Vote for your favorites and learn about the science behind the art.
Day 1️⃣ of Climate Week
Stay tuned for updates from our panel discussions and partner collaborations.
Map by @gfiske.bsky.social
@permafrostpathways.bsky.social
Stay tuned for updates from our panel discussions and partner collaborations.
Map by @gfiske.bsky.social
@permafrostpathways.bsky.social

September 22, 2025 at 4:06 PM
Day 1️⃣ of Climate Week
Stay tuned for updates from our panel discussions and partner collaborations.
Map by @gfiske.bsky.social
@permafrostpathways.bsky.social
Stay tuned for updates from our panel discussions and partner collaborations.
Map by @gfiske.bsky.social
@permafrostpathways.bsky.social
Woodwell Climate is proud to announce the appointment of three endowed chairs, an exciting milestone in our 40-year history that will sustain groundbreaking climate research for generations to come.
www.woodwellclimate.org/endowed-chai...
www.woodwellclimate.org/endowed-chai...

September 15, 2025 at 5:16 PM
Woodwell Climate is proud to announce the appointment of three endowed chairs, an exciting milestone in our 40-year history that will sustain groundbreaking climate research for generations to come.
www.woodwellclimate.org/endowed-chai...
www.woodwellclimate.org/endowed-chai...
Join our list between September 8 and October 17, and you’ll be entered into our email raffle for a chance to win a beautiful printed map by Woodwell Climate’s own @gfiske.bsky.social

September 8, 2025 at 6:32 PM
Join our list between September 8 and October 17, and you’ll be entered into our email raffle for a chance to win a beautiful printed map by Woodwell Climate’s own @gfiske.bsky.social
This map from @cmshintani.bsky.social shows the range of the nomadic Dukha reindeer herders on the high taiga of northwest Mongolia.

August 28, 2025 at 4:07 PM
This map from @cmshintani.bsky.social shows the range of the nomadic Dukha reindeer herders on the high taiga of northwest Mongolia.
We have an opportunity members of the scientific community will not want to miss! Join us at the center in-person tomorrow, July 31 at 12:30 PM EST for an exciting presentation and discussion with UN High Level Climate Champion, Gonzalo Muñoz Abogabir.
Please RSVP at bit.ly/46SFM4z
Please RSVP at bit.ly/46SFM4z

July 30, 2025 at 7:53 PM
We have an opportunity members of the scientific community will not want to miss! Join us at the center in-person tomorrow, July 31 at 12:30 PM EST for an exciting presentation and discussion with UN High Level Climate Champion, Gonzalo Muñoz Abogabir.
Please RSVP at bit.ly/46SFM4z
Please RSVP at bit.ly/46SFM4z
This #MapMonday from @maps-and-pepper.bsky.social shows the predicted return period of once-in-a-generation storms.
As climate change increases extreme weather events, we need to prepare with accurate risk information.
As climate change increases extreme weather events, we need to prepare with accurate risk information.
July 28, 2025 at 8:13 PM
This #MapMonday from @maps-and-pepper.bsky.social shows the predicted return period of once-in-a-generation storms.
As climate change increases extreme weather events, we need to prepare with accurate risk information.
As climate change increases extreme weather events, we need to prepare with accurate risk information.
🌡️Have you been feeling the heat this week? Stay informed, hydrated, and safe!
Dangerously hot days are on the rise across the U.S. according to this map from @cmshintani.bsky.social. This week’s extreme temperatures are part of a larger trend of climate change.
Dangerously hot days are on the rise across the U.S. according to this map from @cmshintani.bsky.social. This week’s extreme temperatures are part of a larger trend of climate change.
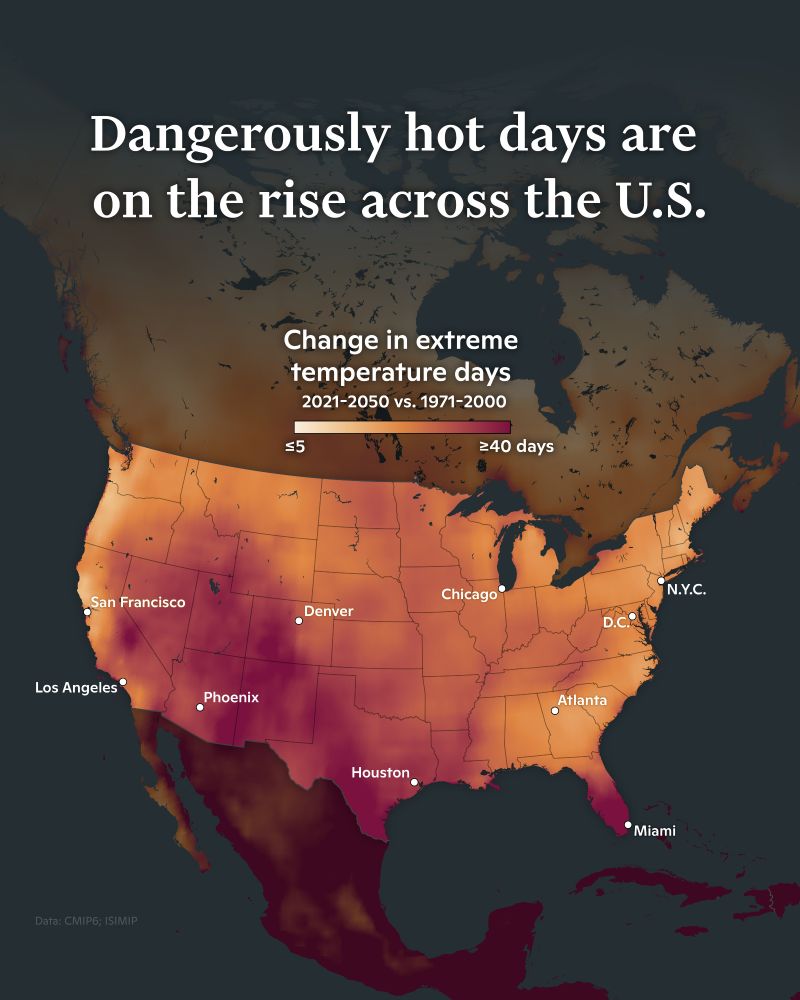
July 25, 2025 at 5:34 PM
🌡️Have you been feeling the heat this week? Stay informed, hydrated, and safe!
Dangerously hot days are on the rise across the U.S. according to this map from @cmshintani.bsky.social. This week’s extreme temperatures are part of a larger trend of climate change.
Dangerously hot days are on the rise across the U.S. according to this map from @cmshintani.bsky.social. This week’s extreme temperatures are part of a larger trend of climate change.
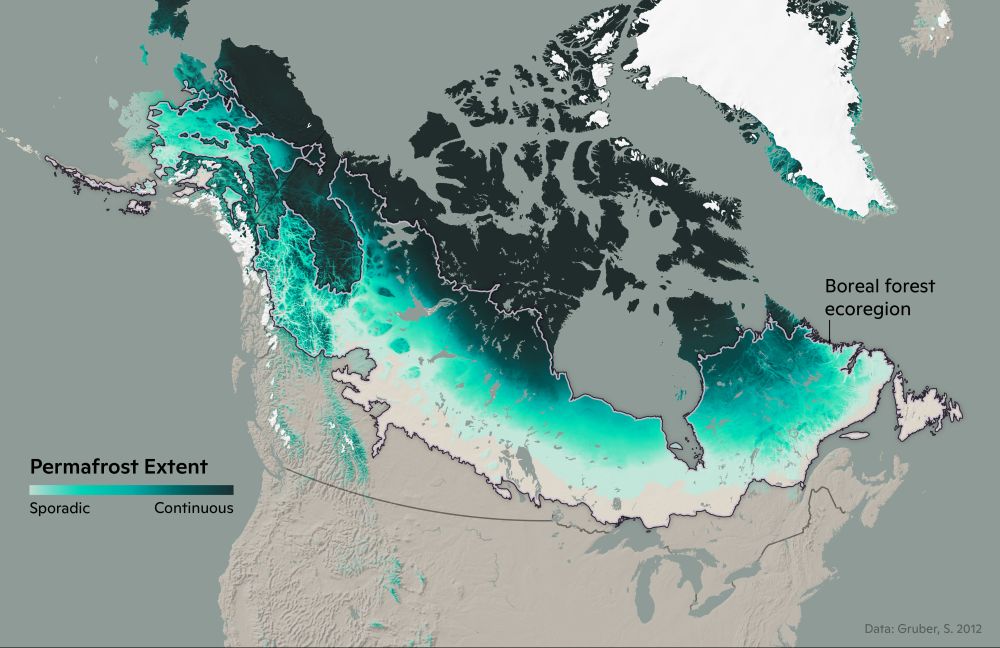
This map from @cmshintani.bsky.social shows the permafrost extant across the boreal forest ecoregion.
Read more about the connection between boreal wildfires and permafrost at www.woodwellclimate.org/connection-b...
Read more about the connection between boreal wildfires and permafrost at www.woodwellclimate.org/connection-b...
July 24, 2025 at 2:54 PM
This map from @cmshintani.bsky.social shows the permafrost extant across the boreal forest ecoregion.
Read more about the connection between boreal wildfires and permafrost at www.woodwellclimate.org/connection-b...
Read more about the connection between boreal wildfires and permafrost at www.woodwellclimate.org/connection-b...
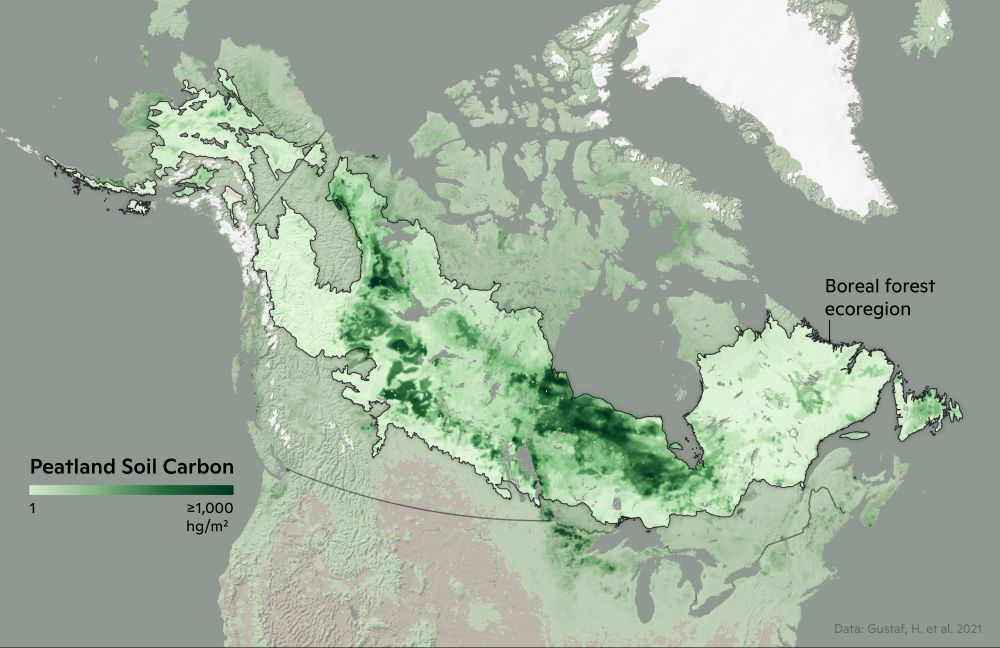
This #MapMonday from @cmshintani.bsky.social shows the carbon stores in peatland soil across the boreal forest ecoregion.
Read more at www.woodwellclimate.org/connection-b...
Read more at www.woodwellclimate.org/connection-b...
July 21, 2025 at 5:21 PM
This #MapMonday from @cmshintani.bsky.social shows the carbon stores in peatland soil across the boreal forest ecoregion.
Read more at www.woodwellclimate.org/connection-b...
Read more at www.woodwellclimate.org/connection-b...
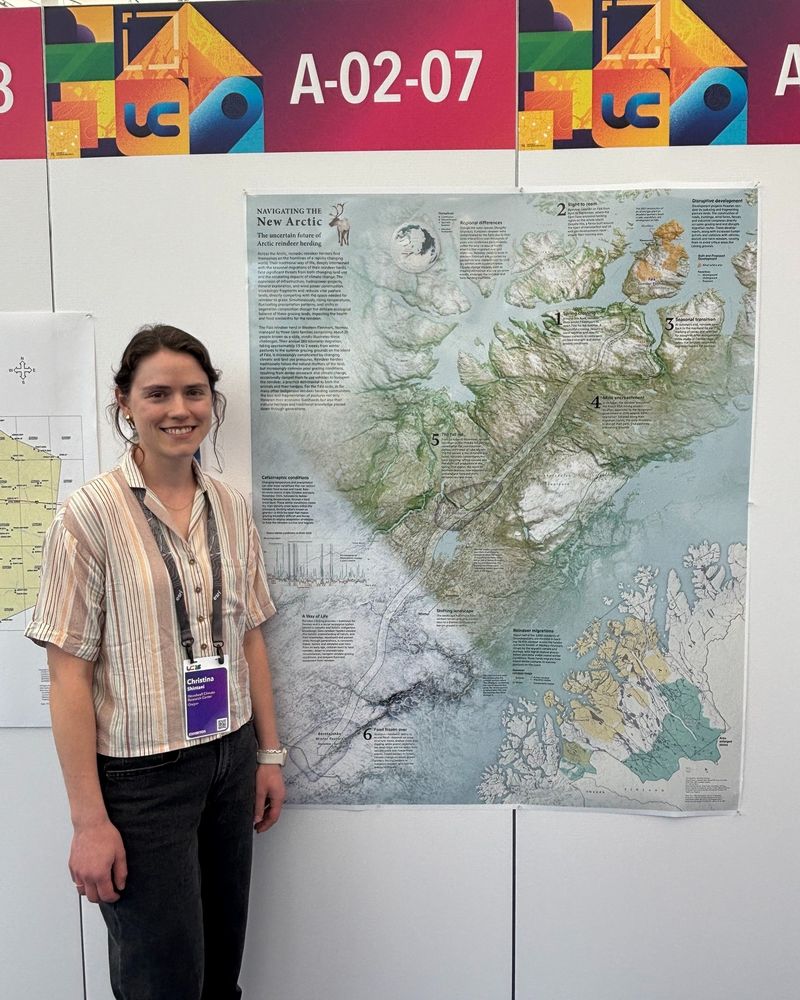
With help from our Sámi partners and @permafrostpathways.bsky.social, Christina Shintani (@cmshintani.bsky.social) explores how climate change is affecting reindeer migration in her map debuting at the Esri User Conference.
July 15, 2025 at 7:34 PM
With help from our Sámi partners and @permafrostpathways.bsky.social, Christina Shintani (@cmshintani.bsky.social) explores how climate change is affecting reindeer migration in her map debuting at the Esri User Conference.
Meet our new Cartography Intern, Nicole Pepper! (@maps-and-pepper.bsky.social). Stay tuned for more data visualization projects from her, including this map showing a late June heat dome that brought record temperatures to the Northeast.

July 3, 2025 at 5:45 PM
Meet our new Cartography Intern, Nicole Pepper! (@maps-and-pepper.bsky.social). Stay tuned for more data visualization projects from her, including this map showing a late June heat dome that brought record temperatures to the Northeast.
When boreal forests burn, the whole world feels the impact. Research from Woodwell Climate has expanded our understanding of boreal fire impact.
Check out these four graphics from @cmshintani.bsky.social that shed light on the role of boreal fires in climate change:
lnkd.in/evnUbxuC
Check out these four graphics from @cmshintani.bsky.social that shed light on the role of boreal fires in climate change:
lnkd.in/evnUbxuC

June 27, 2025 at 3:54 PM
When boreal forests burn, the whole world feels the impact. Research from Woodwell Climate has expanded our understanding of boreal fire impact.
Check out these four graphics from @cmshintani.bsky.social that shed light on the role of boreal fires in climate change:
lnkd.in/evnUbxuC
Check out these four graphics from @cmshintani.bsky.social that shed light on the role of boreal fires in climate change:
lnkd.in/evnUbxuC
This summer, we'll keep you updated on boreal wildfire season. But first, let’s get our jargon out of the way. What is boreal?
Boreal means north and is often used for the climate, ecosystem, and forest region illustrated by this map by @cmshintani.bsky.social
Boreal means north and is often used for the climate, ecosystem, and forest region illustrated by this map by @cmshintani.bsky.social

June 12, 2025 at 3:44 PM
This summer, we'll keep you updated on boreal wildfire season. But first, let’s get our jargon out of the way. What is boreal?
Boreal means north and is often used for the climate, ecosystem, and forest region illustrated by this map by @cmshintani.bsky.social
Boreal means north and is often used for the climate, ecosystem, and forest region illustrated by this map by @cmshintani.bsky.social
4️⃣ Dr. Marcia Macedo, Zoë Dietrich, and Kathleen Savage hosted a workshop at Woodwell that brought together researchers from the local science community to share DIY solutions to environmental sensors. (Photo by Kathleen Savage)

June 11, 2025 at 5:25 PM
4️⃣ Dr. Marcia Macedo, Zoë Dietrich, and Kathleen Savage hosted a workshop at Woodwell that brought together researchers from the local science community to share DIY solutions to environmental sensors. (Photo by Kathleen Savage)
3️⃣ Scientists with @permafrostpathways.bsky.social checked on eddy covariance towers on Treaty 5 territory on the ancestral lands of the Cree, Dene, Inuit, and Métis people in Churchill, Manitoba, Canada. (Photo by Dani Trangmoe)

June 11, 2025 at 5:25 PM
3️⃣ Scientists with @permafrostpathways.bsky.social checked on eddy covariance towers on Treaty 5 territory on the ancestral lands of the Cree, Dene, Inuit, and Métis people in Churchill, Manitoba, Canada. (Photo by Dani Trangmoe)
2️⃣ Dom Dusseau participated in a congressional briefing to explore Congress’s role in bolstering the long-term resilience and insurability of U.S. communities. He also joined Laura Uttley in congressional meetings to discuss our latest policy brief, authored by Dom and Jamie Cummings. 📸 : EESI

June 11, 2025 at 5:25 PM
2️⃣ Dom Dusseau participated in a congressional briefing to explore Congress’s role in bolstering the long-term resilience and insurability of U.S. communities. He also joined Laura Uttley in congressional meetings to discuss our latest policy brief, authored by Dom and Jamie Cummings. 📸 : EESI