


Tom Cui
@tom-cui.com
I study how policies and institutions shape housing markets at the NYU Furman Center!
All opinions, for better or for worse, are my own
All opinions, for better or for worse, are my own
A lot more is in the paper, but last thing I'll note here is that our paper made me think harder about the "abundance agenda"

November 26, 2025 at 7:10 PM
A lot more is in the paper, but last thing I'll note here is that our paper made me think harder about the "abundance agenda"
Our design also suggests that 701 assistance is linked:
- To more complex zoning!
- With greater adoption of quotas on permits, and of inclusionary zoning!
- To more bargaining for community benefits, where we leverage newspaper reports!
- To more complex zoning!
- With greater adoption of quotas on permits, and of inclusionary zoning!
- To more bargaining for community benefits, where we leverage newspaper reports!


November 26, 2025 at 7:10 PM
Our design also suggests that 701 assistance is linked:
- To more complex zoning!
- With greater adoption of quotas on permits, and of inclusionary zoning!
- To more bargaining for community benefits, where we leverage newspaper reports!
- To more complex zoning!
- With greater adoption of quotas on permits, and of inclusionary zoning!
- To more bargaining for community benefits, where we leverage newspaper reports!
We estimate that 701-assisted cities had 20% fewer units built in each decade than in their no-701 counterfactual. That's an avg. 13% fewer units built in total between 1960-2010.
Assisted places shifted towards single-family (away from apartments) and more restrictive lot sizes
Assisted places shifted towards single-family (away from apartments) and more restrictive lot sizes


November 26, 2025 at 7:10 PM
We estimate that 701-assisted cities had 20% fewer units built in each decade than in their no-701 counterfactual. That's an avg. 13% fewer units built in total between 1960-2010.
Assisted places shifted towards single-family (away from apartments) and more restrictive lot sizes
Assisted places shifted towards single-family (away from apartments) and more restrictive lot sizes
(2) The feds did not send money to cities; that was up to a designated agency for each state.
State capacity ranged between RI's agency - staffed with professional planners - to TX's agency - staffed with one planner under their health dept.
2 quirks -> triple difference design!
State capacity ranged between RI's agency - staffed with professional planners - to TX's agency - staffed with one planner under their health dept.
2 quirks -> triple difference design!


November 26, 2025 at 7:10 PM
(2) The feds did not send money to cities; that was up to a designated agency for each state.
State capacity ranged between RI's agency - staffed with professional planners - to TX's agency - staffed with one planner under their health dept.
2 quirks -> triple difference design!
State capacity ranged between RI's agency - staffed with professional planners - to TX's agency - staffed with one planner under their health dept.
2 quirks -> triple difference design!
But how can we derive a causal effect of the 701 Program? We exploit two quirks with program eligibility:
(1) A population cutoff was in effect; no matter which state you're in, suburbs with > 50,000 population in the last Census were nearly all ineligible.
(1) A population cutoff was in effect; no matter which state you're in, suburbs with > 50,000 population in the last Census were nearly all ineligible.

November 26, 2025 at 7:10 PM
But how can we derive a causal effect of the 701 Program? We exploit two quirks with program eligibility:
(1) A population cutoff was in effect; no matter which state you're in, suburbs with > 50,000 population in the last Census were nearly all ineligible.
(1) A population cutoff was in effect; no matter which state you're in, suburbs with > 50,000 population in the last Census were nearly all ineligible.
By tabulating HUD products stored at the National Archives, we confirm that, despite loftier ideals, planners followed a "standard package:"
- Project out population
- Draw up maps of land use, accomodating the growth residents wanted
- Zoning/building codes to enforce land use
- Project out population
- Draw up maps of land use, accomodating the growth residents wanted
- Zoning/building codes to enforce land use

November 26, 2025 at 7:10 PM
By tabulating HUD products stored at the National Archives, we confirm that, despite loftier ideals, planners followed a "standard package:"
- Project out population
- Draw up maps of land use, accomodating the growth residents wanted
- Zoning/building codes to enforce land use
- Project out population
- Draw up maps of land use, accomodating the growth residents wanted
- Zoning/building codes to enforce land use
We digitize the 701 project directories, counting ~3K cities given grants.
Beyond America's urban core, these cities lacked planning capacity and struggled with post-war suburban sprawl.
701 assistance funded many of the first suburban planners, but not subject to evaluation since the 70s!
Beyond America's urban core, these cities lacked planning capacity and struggled with post-war suburban sprawl.
701 assistance funded many of the first suburban planners, but not subject to evaluation since the 70s!

November 26, 2025 at 7:10 PM
We digitize the 701 project directories, counting ~3K cities given grants.
Beyond America's urban core, these cities lacked planning capacity and struggled with post-war suburban sprawl.
701 assistance funded many of the first suburban planners, but not subject to evaluation since the 70s!
Beyond America's urban core, these cities lacked planning capacity and struggled with post-war suburban sprawl.
701 assistance funded many of the first suburban planners, but not subject to evaluation since the 70s!
Our paper, "Taming the Growth Machine," is available here: tom-cui.com/2025/11/03/s...
We study the 1954 Urban Planning Assistance Program, otherwise known as the "701 Program."
Up to the late 60s, the federal government awarded grants for small cities to match with urban planners.
We study the 1954 Urban Planning Assistance Program, otherwise known as the "701 Program."
Up to the late 60s, the federal government awarded grants for small cities to match with urban planners.

November 26, 2025 at 7:10 PM
Our paper, "Taming the Growth Machine," is available here: tom-cui.com/2025/11/03/s...
We study the 1954 Urban Planning Assistance Program, otherwise known as the "701 Program."
Up to the late 60s, the federal government awarded grants for small cities to match with urban planners.
We study the 1954 Urban Planning Assistance Program, otherwise known as the "701 Program."
Up to the late 60s, the federal government awarded grants for small cities to match with urban planners.
Why are many U.S. cities building less? Why have they insisted on a "thicket" of regulations that make housing hard to build?
In a new #EconJMP with Beau Bressler (beaubressler.github.io), we study how much of the answer lies with a forgotten federal program that taught cities to restrict growth
In a new #EconJMP with Beau Bressler (beaubressler.github.io), we study how much of the answer lies with a forgotten federal program that taught cities to restrict growth

November 26, 2025 at 7:10 PM
Why are many U.S. cities building less? Why have they insisted on a "thicket" of regulations that make housing hard to build?
In a new #EconJMP with Beau Bressler (beaubressler.github.io), we study how much of the answer lies with a forgotten federal program that taught cities to restrict growth
In a new #EconJMP with Beau Bressler (beaubressler.github.io), we study how much of the answer lies with a forgotten federal program that taught cities to restrict growth
Me and the boys watching the global trade war escalate today

April 8, 2025 at 3:36 AM
Me and the boys watching the global trade war escalate today
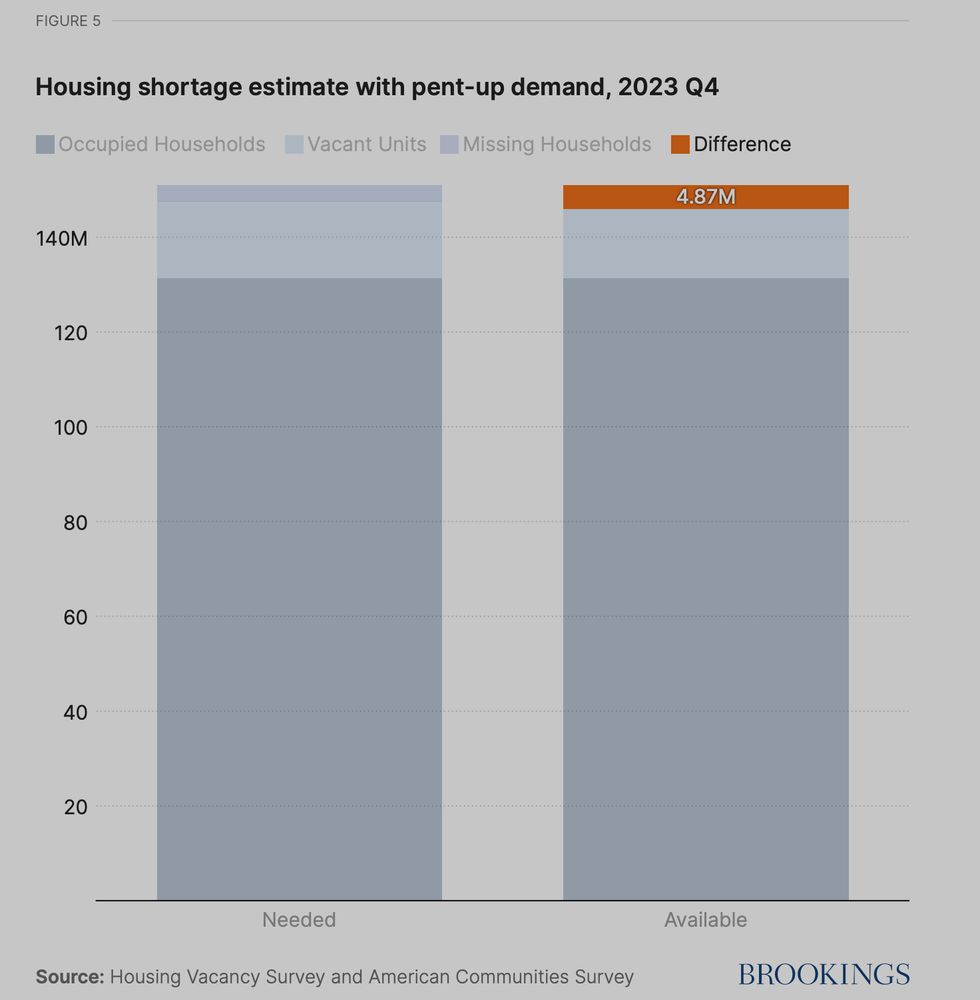
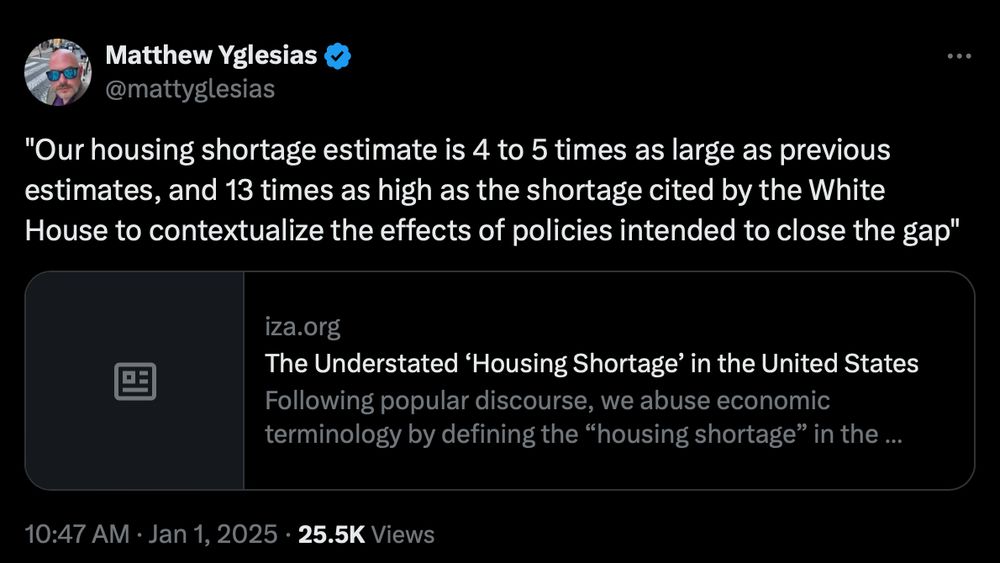
If you make up these 5-6M units, the affordability issue would look less dire for the dual-earner families struggling to buy homes this second.
The Corinth estimate has a different idea of "needed" - what we'd get if free competition drove prices to their construction costs
The Corinth estimate has a different idea of "needed" - what we'd get if free competition drove prices to their construction costs
January 1, 2025 at 7:41 PM
If you make up these 5-6M units, the affordability issue would look less dire for the dual-earner families struggling to buy homes this second.
The Corinth estimate has a different idea of "needed" - what we'd get if free competition drove prices to their construction costs
The Corinth estimate has a different idea of "needed" - what we'd get if free competition drove prices to their construction costs
PSA: A lot of the thread is expanding on what Salim Furth (Mercatus) wrote 2 years ago:
marketurbanism.com/2022/08/05/h...
My preferred method is the approach by Khater et al (2021), updated to '23 data recently. So for me, the shortage "snapshot" now is 5-6M units
brookings.edu/articles/mak...
marketurbanism.com/2022/08/05/h...
My preferred method is the approach by Khater et al (2021), updated to '23 data recently. So for me, the shortage "snapshot" now is 5-6M units
brookings.edu/articles/mak...
January 1, 2025 at 7:41 PM
PSA: A lot of the thread is expanding on what Salim Furth (Mercatus) wrote 2 years ago:
marketurbanism.com/2022/08/05/h...
My preferred method is the approach by Khater et al (2021), updated to '23 data recently. So for me, the shortage "snapshot" now is 5-6M units
brookings.edu/articles/mak...
marketurbanism.com/2022/08/05/h...
My preferred method is the approach by Khater et al (2021), updated to '23 data recently. So for me, the shortage "snapshot" now is 5-6M units
brookings.edu/articles/mak...
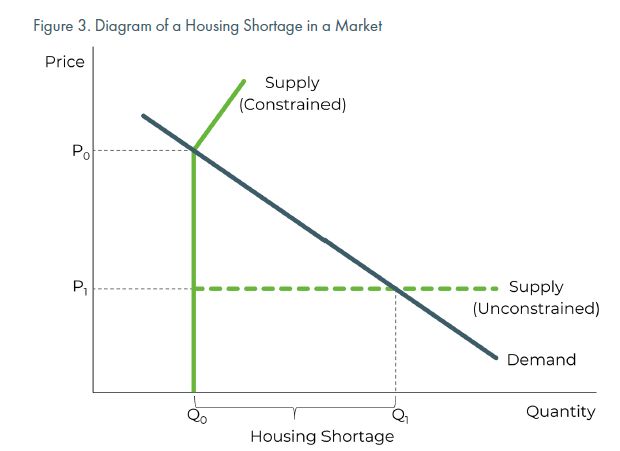
This isn't the first time we've seen the Corinth/Dante estimates of the U.S. housing shortage - 20 million units!
Sounds like a big number, but it's not a crazy number. The magnitude depends on at what point you'd consider the shortage "closed."
Sounds like a big number, but it's not a crazy number. The magnitude depends on at what point you'd consider the shortage "closed."
January 1, 2025 at 7:41 PM
This isn't the first time we've seen the Corinth/Dante estimates of the U.S. housing shortage - 20 million units!
Sounds like a big number, but it's not a crazy number. The magnitude depends on at what point you'd consider the shortage "closed."
Sounds like a big number, but it's not a crazy number. The magnitude depends on at what point you'd consider the shortage "closed."
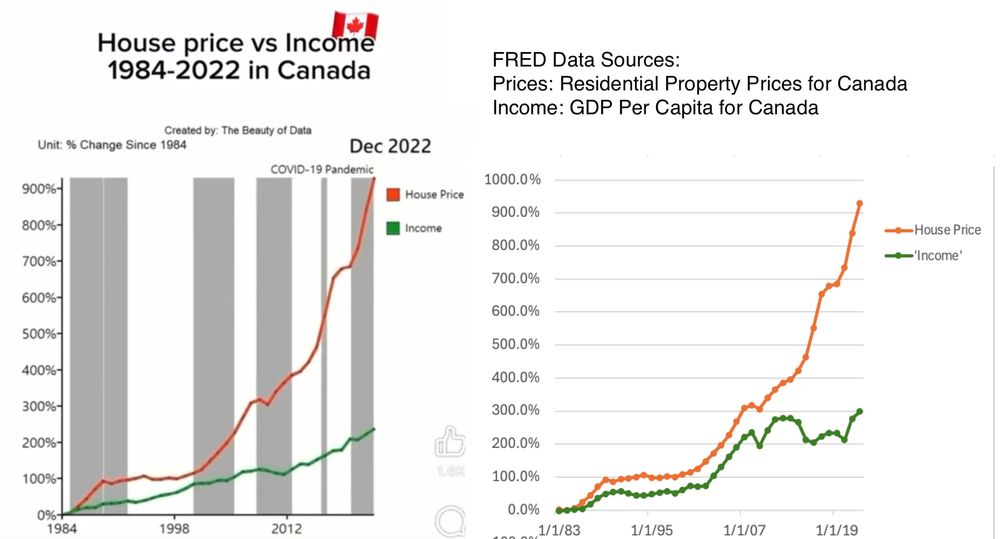
And if I had to make my ideal version of the Canada graph, I'd combine the OECD household data with the Teranet house price index instead.
You can more easily see three "shifts" in the divergence with this anyway: from 2000-2015, 2015-2021 and the post-COVID market.
You can more easily see three "shifts" in the divergence with this anyway: from 2000-2015, 2015-2021 and the post-COVID market.
December 23, 2024 at 10:46 PM
And if I had to make my ideal version of the Canada graph, I'd combine the OECD household data with the Teranet house price index instead.
You can more easily see three "shifts" in the divergence with this anyway: from 2000-2015, 2015-2021 and the post-COVID market.
You can more easily see three "shifts" in the divergence with this anyway: from 2000-2015, 2015-2021 and the post-COVID market.
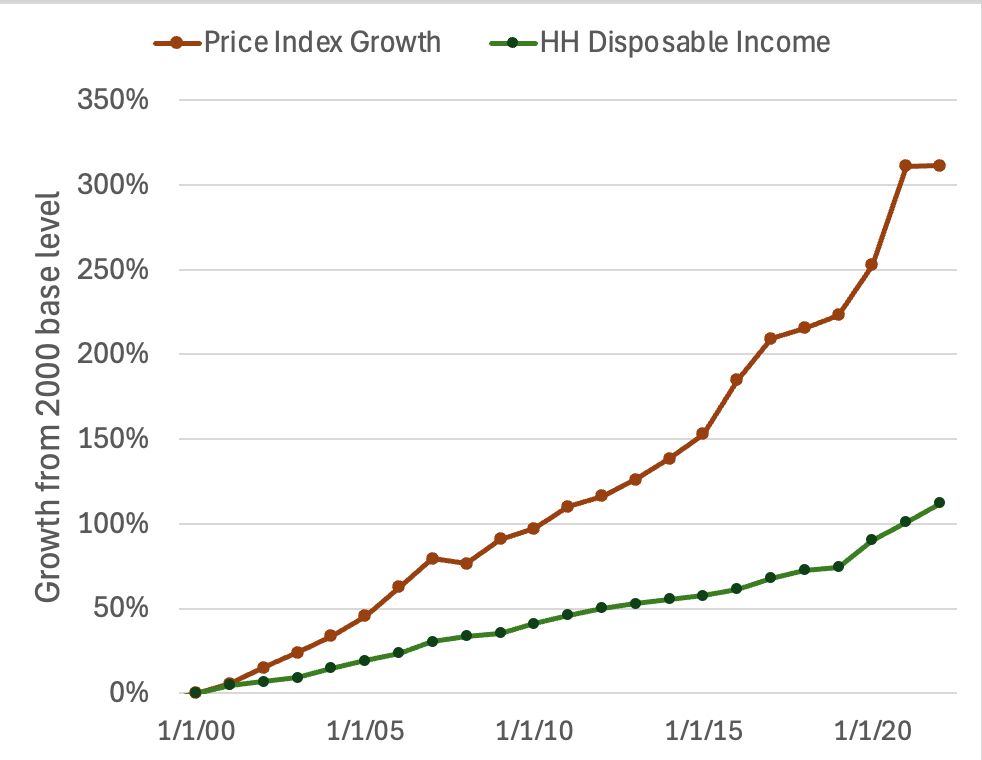
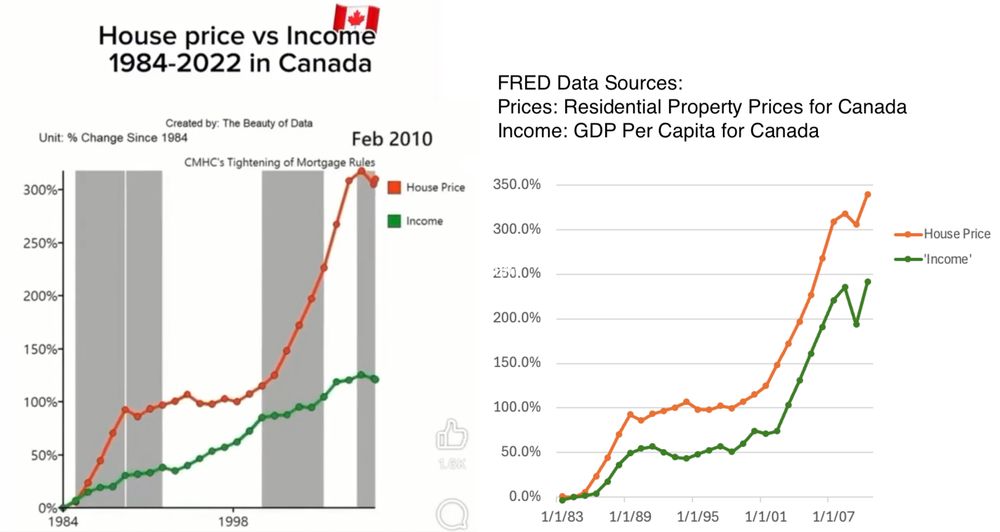
Then I looked for a more proper measure of income for the context: household disposable income, available in a standard form at the OECD.
The trends match better, at least. But growth is still slower than the OECD data source. From 1984-2022, OECD reports 300% change while the video reports 200%
The trends match better, at least. But growth is still slower than the OECD data source. From 1984-2022, OECD reports 300% change while the video reports 200%
December 23, 2024 at 10:46 PM
Then I looked for a more proper measure of income for the context: household disposable income, available in a standard form at the OECD.
The trends match better, at least. But growth is still slower than the OECD data source. From 1984-2022, OECD reports 300% change while the video reports 200%
The trends match better, at least. But growth is still slower than the OECD data source. From 1984-2022, OECD reports 300% change while the video reports 200%
But the trends don't match! Nothing on FRED could replicate the "income" part.
Here is a zoom-in before the (very real) explosion in Canadian house prices in the last 6 years, showing the lack of a match.
Here is a zoom-in before the (very real) explosion in Canadian house prices in the last 6 years, showing the lack of a match.
December 23, 2024 at 10:46 PM
But the trends don't match! Nothing on FRED could replicate the "income" part.
Here is a zoom-in before the (very real) explosion in Canadian house prices in the last 6 years, showing the lack of a match.
Here is a zoom-in before the (very real) explosion in Canadian house prices in the last 6 years, showing the lack of a match.
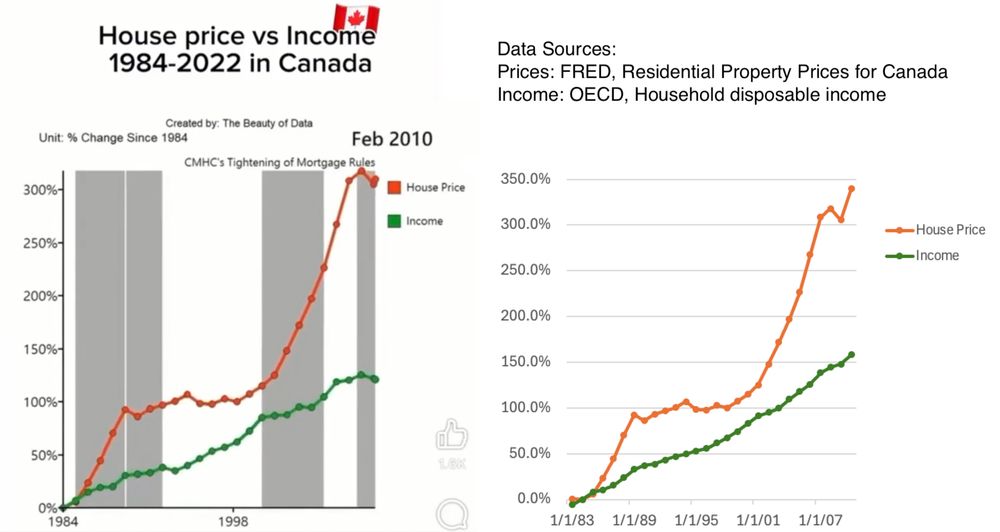
Here's a viral Tiktok chart on housing unaffordability in Canada, but it looked a bit weird to me.
It's not as bad as when a viral U.S. chart compared rent growth with inflation-adjusted income. But here's my look into what is used as "income" here...
www.tiktok.com/@thebeautyof...
It's not as bad as when a viral U.S. chart compared rent growth with inflation-adjusted income. But here's my look into what is used as "income" here...
www.tiktok.com/@thebeautyof...
December 23, 2024 at 10:46 PM
Here's a viral Tiktok chart on housing unaffordability in Canada, but it looked a bit weird to me.
It's not as bad as when a viral U.S. chart compared rent growth with inflation-adjusted income. But here's my look into what is used as "income" here...
www.tiktok.com/@thebeautyof...
It's not as bad as when a viral U.S. chart compared rent growth with inflation-adjusted income. But here's my look into what is used as "income" here...
www.tiktok.com/@thebeautyof...
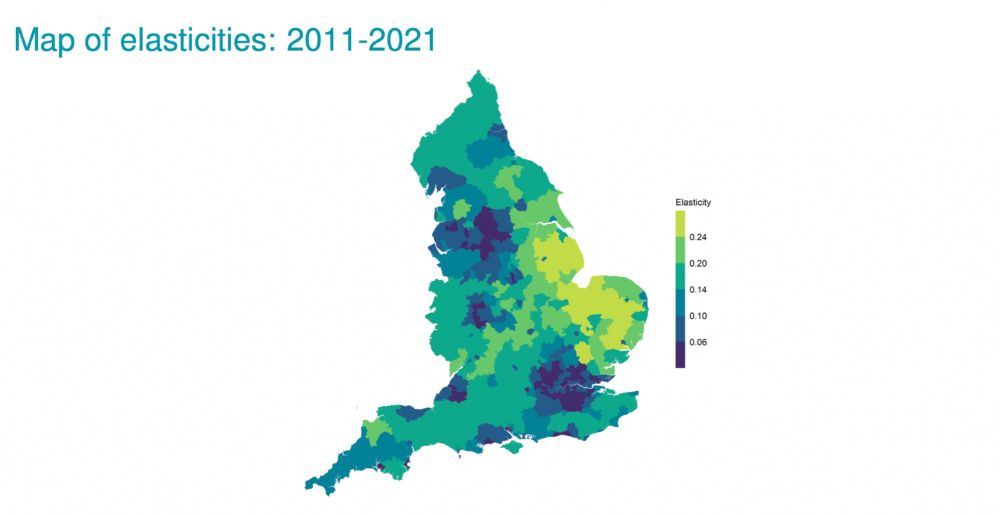
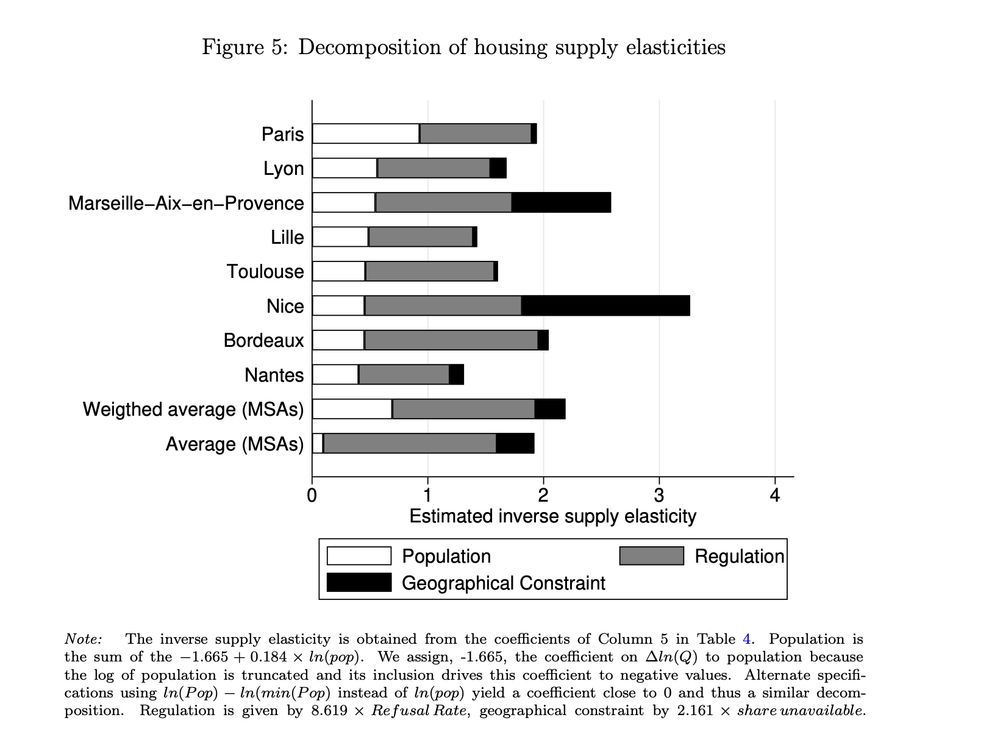
This is a bit beside the point, but for a direct comparison with France I found a project estimating local housing supply elasticities for England too. ifs.org.uk/sites/defaul...
You have to take reciprocal of all numbers here, but even the most elastic parts of England have values >= 4!
You have to take reciprocal of all numbers here, but even the most elastic parts of England have values >= 4!
December 16, 2024 at 6:36 PM
This is a bit beside the point, but for a direct comparison with France I found a project estimating local housing supply elasticities for England too. ifs.org.uk/sites/defaul...
You have to take reciprocal of all numbers here, but even the most elastic parts of England have values >= 4!
You have to take reciprocal of all numbers here, but even the most elastic parts of England have values >= 4!
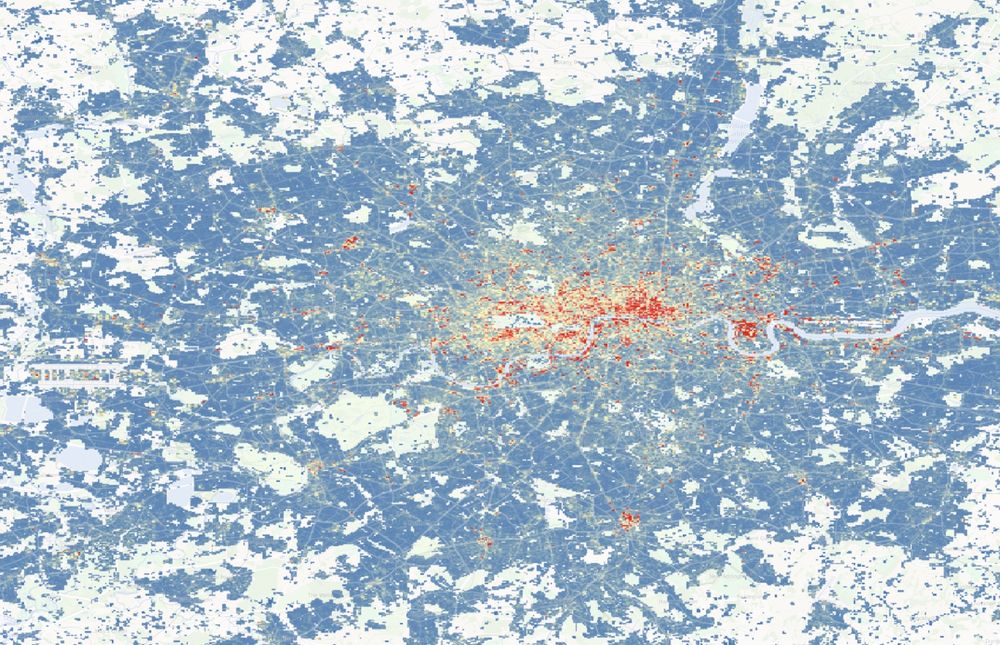
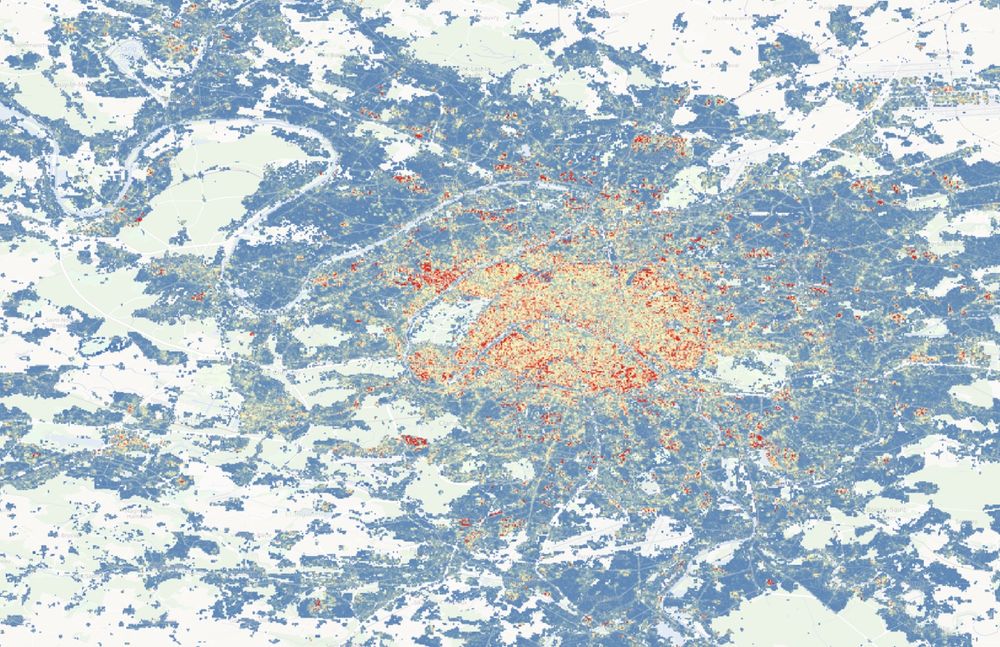
A dataset I really like is the WSF dataset on building area and heights. Here is the *height* data for London vs. Paris, normalized at the same scale. I think it's suggestive that Parisian suburbs are more willing to develop taller on scarce urban land.
geoservice.dlr.de/web/maps/eoc...
geoservice.dlr.de/web/maps/eoc...
December 15, 2024 at 5:58 PM
A dataset I really like is the WSF dataset on building area and heights. Here is the *height* data for London vs. Paris, normalized at the same scale. I think it's suggestive that Parisian suburbs are more willing to develop taller on scarce urban land.
geoservice.dlr.de/web/maps/eoc...
geoservice.dlr.de/web/maps/eoc...
Part of what's going on here is that these aren't elasticities estimated separately for each city, but implied elasticities coming out of a cross-metro regression.
Takeaway is still clear though - Paris is a little more housing elastic than avg, driven by having more "regulatory flexibility"
Takeaway is still clear though - Paris is a little more housing elastic than avg, driven by having more "regulatory flexibility"
December 15, 2024 at 5:58 PM
Part of what's going on here is that these aren't elasticities estimated separately for each city, but implied elasticities coming out of a cross-metro regression.
Takeaway is still clear though - Paris is a little more housing elastic than avg, driven by having more "regulatory flexibility"
Takeaway is still clear though - Paris is a little more housing elastic than avg, driven by having more "regulatory flexibility"
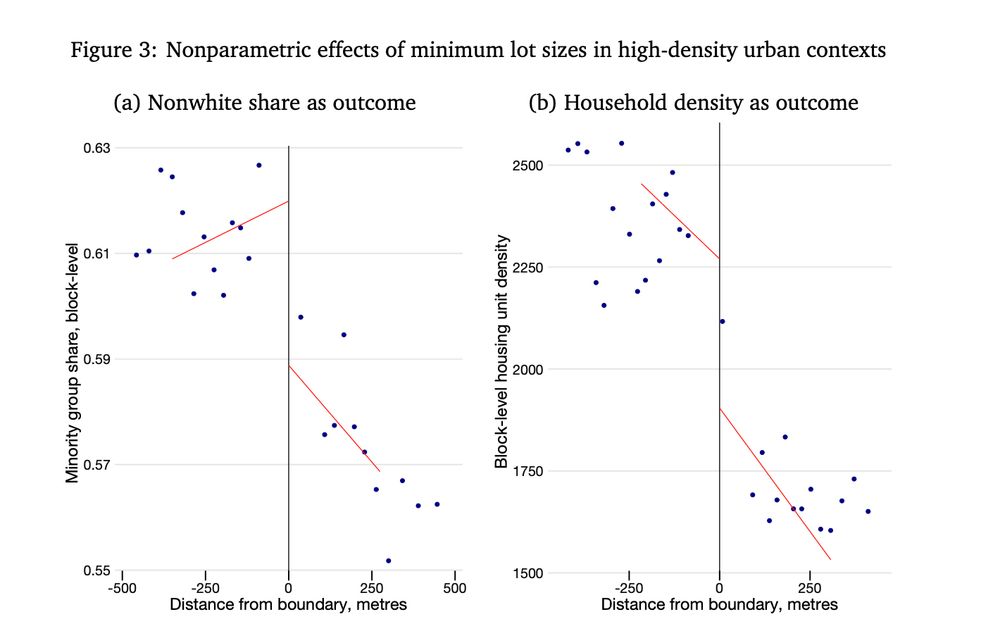
Two results are worth previewing in this thread:
(1) Small minimum lot sizes (less than 6K sq. ft.) cause areas to have less racial change! They have limited the spread of denser homes; as a result, there are 3 to 7 pp fewer racial minority residents in the small MLS blocks.
(1) Small minimum lot sizes (less than 6K sq. ft.) cause areas to have less racial change! They have limited the spread of denser homes; as a result, there are 3 to 7 pp fewer racial minority residents in the small MLS blocks.
December 12, 2024 at 8:52 PM
Two results are worth previewing in this thread:
(1) Small minimum lot sizes (less than 6K sq. ft.) cause areas to have less racial change! They have limited the spread of denser homes; as a result, there are 3 to 7 pp fewer racial minority residents in the small MLS blocks.
(1) Small minimum lot sizes (less than 6K sq. ft.) cause areas to have less racial change! They have limited the spread of denser homes; as a result, there are 3 to 7 pp fewer racial minority residents in the small MLS blocks.
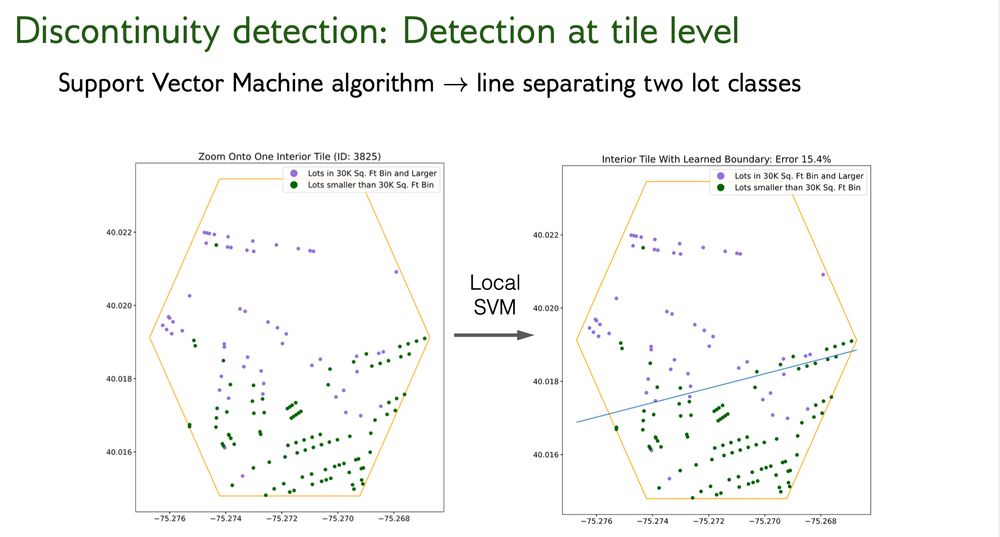
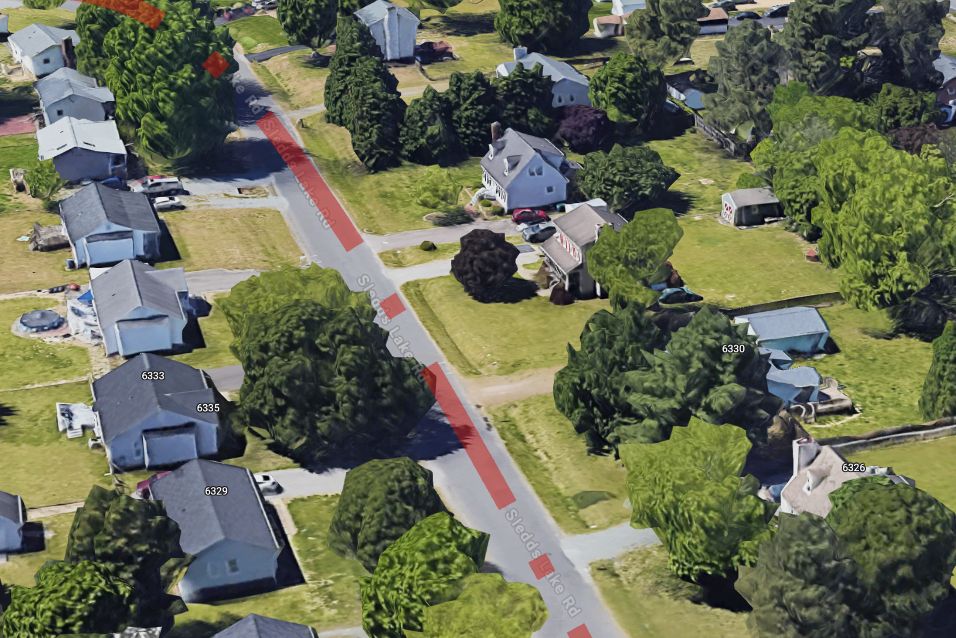
What do we get as a result? An inferred set of borders where we believe zoning districts change *within cities.*
But instead of retrieving entire borders, we can filter on their "straightest" segments, which are least likely to be drawn to protect high-value land or development.
But instead of retrieving entire borders, we can filter on their "straightest" segments, which are least likely to be drawn to protect high-value land or development.
December 12, 2024 at 8:52 PM
What do we get as a result? An inferred set of borders where we believe zoning districts change *within cities.*
But instead of retrieving entire borders, we can filter on their "straightest" segments, which are least likely to be drawn to protect high-value land or development.
But instead of retrieving entire borders, we can filter on their "straightest" segments, which are least likely to be drawn to protect high-value land or development.
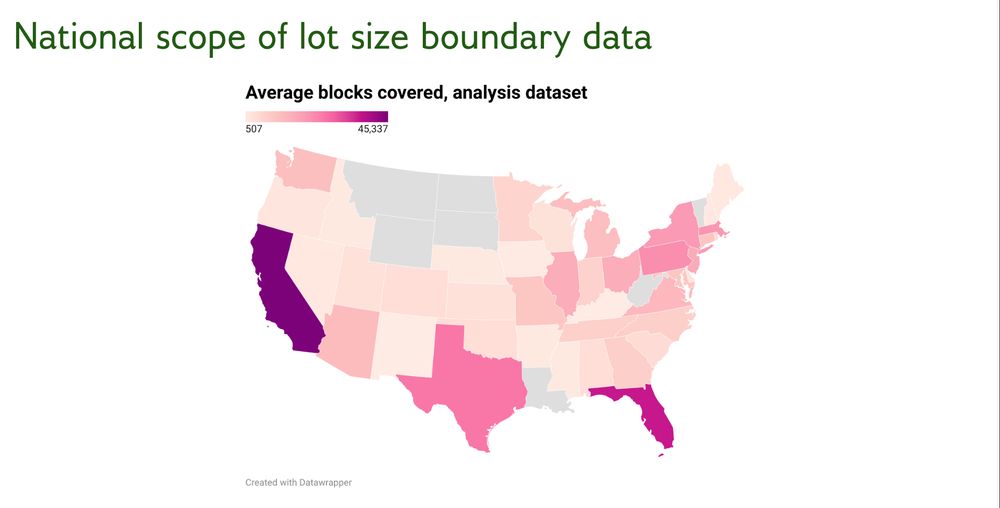
We attack this problem by first providing new data. With a scalable procedure, drawing on my previous work detecting minimum lot sizes causing "bunching at lot sizes," we
1) Geolocate developments built at those sizes, and
2) the borders where they give way to dense development
1) Geolocate developments built at those sizes, and
2) the borders where they give way to dense development
December 12, 2024 at 8:52 PM
We attack this problem by first providing new data. With a scalable procedure, drawing on my previous work detecting minimum lot sizes causing "bunching at lot sizes," we
1) Geolocate developments built at those sizes, and
2) the borders where they give way to dense development
1) Geolocate developments built at those sizes, and
2) the borders where they give way to dense development
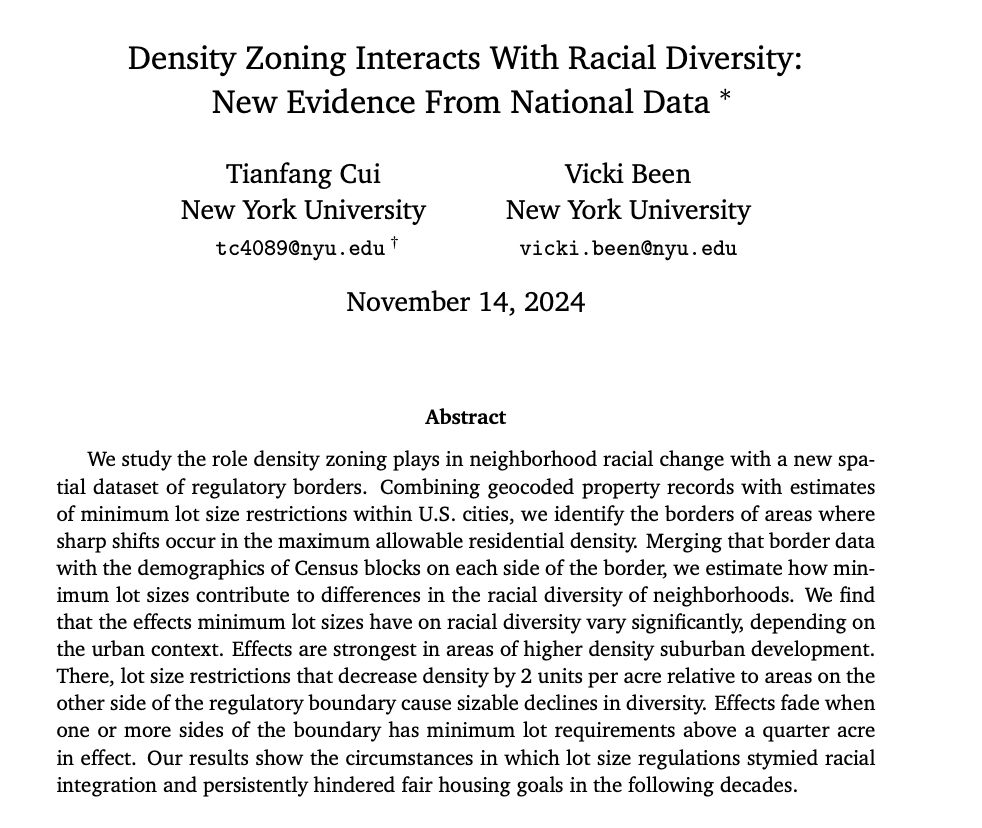
I break this down, in collaboration with Vicki Been at NYU Law/Furman.
I hadn't wanted to be brash about this, but I'm also back on the job market this year. I'm excited to talk about this new paper and my research agenda!
www.tom-cui.com/assets/pdfs/...
I hadn't wanted to be brash about this, but I'm also back on the job market this year. I'm excited to talk about this new paper and my research agenda!
www.tom-cui.com/assets/pdfs/...
December 12, 2024 at 8:52 PM
I break this down, in collaboration with Vicki Been at NYU Law/Furman.
I hadn't wanted to be brash about this, but I'm also back on the job market this year. I'm excited to talk about this new paper and my research agenda!
www.tom-cui.com/assets/pdfs/...
I hadn't wanted to be brash about this, but I'm also back on the job market this year. I'm excited to talk about this new paper and my research agenda!
www.tom-cui.com/assets/pdfs/...
Which zoning regulations shaped America's urban geography the most? It's easy to paint one culprit - density zoning limiting smaller homes - in broad strokes.
Yet facts that pinpoint specific regs' role is hard to come by, even if those matter for legal and policy decisions. In a new paper...
Yet facts that pinpoint specific regs' role is hard to come by, even if those matter for legal and policy decisions. In a new paper...
December 12, 2024 at 8:52 PM
Which zoning regulations shaped America's urban geography the most? It's easy to paint one culprit - density zoning limiting smaller homes - in broad strokes.
Yet facts that pinpoint specific regs' role is hard to come by, even if those matter for legal and policy decisions. In a new paper...
Yet facts that pinpoint specific regs' role is hard to come by, even if those matter for legal and policy decisions. In a new paper...