


↑Lionel Yelibi↓ @ neurips 2025
@spiindoctor.bsky.social
Research Scientist at Capital One. Houston, TX.
Research interests: Complexity Sciences, Matrix Decomposition, Clustering, Manifold Learning, Networks, Synthetic (numerical) data, Portfolio optimization. 🇨🇮🇿🇦
Research interests: Complexity Sciences, Matrix Decomposition, Clustering, Manifold Learning, Networks, Synthetic (numerical) data, Portfolio optimization. 🇨🇮🇿🇦
Did I do it right

November 9, 2025 at 5:42 AM
Did I do it right
The rabbit hole arxiv.org/abs/cond-mat...

September 5, 2025 at 3:27 AM
The rabbit hole arxiv.org/abs/cond-mat...
On the hunt for the best mushroom coffee out there. So far I have tried these two:
left: maxfit $17, right: ryze $41
I somehow like maxfit better, ryze has an interesting smell but saturates 1 cup of water with 2 tsp (I guess that's why it's pricier). both flavors resemble coffee in different ways
left: maxfit $17, right: ryze $41
I somehow like maxfit better, ryze has an interesting smell but saturates 1 cup of water with 2 tsp (I guess that's why it's pricier). both flavors resemble coffee in different ways


July 22, 2025 at 2:50 PM
On the hunt for the best mushroom coffee out there. So far I have tried these two:
left: maxfit $17, right: ryze $41
I somehow like maxfit better, ryze has an interesting smell but saturates 1 cup of water with 2 tsp (I guess that's why it's pricier). both flavors resemble coffee in different ways
left: maxfit $17, right: ryze $41
I somehow like maxfit better, ryze has an interesting smell but saturates 1 cup of water with 2 tsp (I guess that's why it's pricier). both flavors resemble coffee in different ways


Comparatively If we do ICA on the Residuals Eigenvectors (N_eig = 2). Not only the nonlinear clustering is recovered but it remains stable as N_eig is increased unlike with the raw data eigenvectors.
Linear View (left): The linear assignment is absent
Nonlinear View (right): Perfect separation
Linear View (left): The linear assignment is absent
Nonlinear View (right): Perfect separation


July 20, 2025 at 7:49 PM
Comparatively If we do ICA on the Residuals Eigenvectors (N_eig = 2). Not only the nonlinear clustering is recovered but it remains stable as N_eig is increased unlike with the raw data eigenvectors.
Linear View (left): The linear assignment is absent
Nonlinear View (right): Perfect separation
Linear View (left): The linear assignment is absent
Nonlinear View (right): Perfect separation
ICA on Raw Eigenvectors (N_eig = 7)
Linear View (left): The linear cluster separation is now distorted.
Nonlinear View (right): The global structure now more closely reflects the nonlinear states, but the result is not a clean separation.
Linear View (left): The linear cluster separation is now distorted.
Nonlinear View (right): The global structure now more closely reflects the nonlinear states, but the result is not a clean separation.


July 20, 2025 at 7:49 PM
ICA on Raw Eigenvectors (N_eig = 7)
Linear View (left): The linear cluster separation is now distorted.
Nonlinear View (right): The global structure now more closely reflects the nonlinear states, but the result is not a clean separation.
Linear View (left): The linear cluster separation is now distorted.
Nonlinear View (right): The global structure now more closely reflects the nonlinear states, but the result is not a clean separation.
Alternative: What about applying ICA to eigenvectors instead ?
ICA on Raw Eigenvectors (N_eig = 3)
Linear View (left): Still separates the 5 clusters well.
Nonlinear View (right): The nonlinear states appear as local patterns within the separated linear clusters.
ICA on Raw Eigenvectors (N_eig = 3)
Linear View (left): Still separates the 5 clusters well.
Nonlinear View (right): The nonlinear states appear as local patterns within the separated linear clusters.


July 20, 2025 at 7:49 PM
Alternative: What about applying ICA to eigenvectors instead ?
ICA on Raw Eigenvectors (N_eig = 3)
Linear View (left): Still separates the 5 clusters well.
Nonlinear View (right): The nonlinear states appear as local patterns within the separated linear clusters.
ICA on Raw Eigenvectors (N_eig = 3)
Linear View (left): Still separates the 5 clusters well.
Nonlinear View (right): The nonlinear states appear as local patterns within the separated linear clusters.
In comparison to PCA which fails again at recovering any kind of structure in the eigenvector of the correlation matrix of residuals. But as we will see later, the signal is there.

July 20, 2025 at 7:49 PM
In comparison to PCA which fails again at recovering any kind of structure in the eigenvector of the correlation matrix of residuals. But as we will see later, the signal is there.
Similarly to ICA above, UMAP is also able to recover the nonlinear structure in the residuals. Which suggests that UMAP shares something in common with ICA.


July 20, 2025 at 7:49 PM
Similarly to ICA above, UMAP is also able to recover the nonlinear structure in the residuals. Which suggests that UMAP shares something in common with ICA.
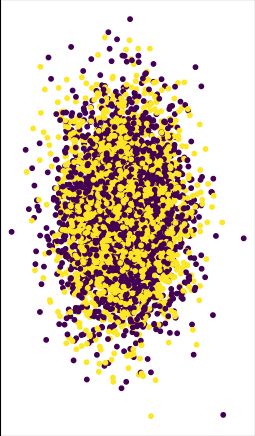
ICA on Residuals (The main result):
Linear View (left): The linear cluster structure is now gone, as it has been subtracted out.
Nonlinear View (right): A near-perfect separation of the 2 hidden states emerges.
Linear View (left): The linear cluster structure is now gone, as it has been subtracted out.
Nonlinear View (right): A near-perfect separation of the 2 hidden states emerges.


July 20, 2025 at 7:49 PM
ICA on Residuals (The main result):
Linear View (left): The linear cluster structure is now gone, as it has been subtracted out.
Nonlinear View (right): A near-perfect separation of the 2 hidden states emerges.
Linear View (left): The linear cluster structure is now gone, as it has been subtracted out.
Nonlinear View (right): A near-perfect separation of the 2 hidden states emerges.
UMAP on Raw Data
The result is identical.
Linear View (left): Shows 5 distinct groups.
Nonlinear View (right): No discernible strong structure related to the nonlinear states.
The result is identical.
Linear View (left): Shows 5 distinct groups.
Nonlinear View (right): No discernible strong structure related to the nonlinear states.


July 20, 2025 at 7:49 PM
UMAP on Raw Data
The result is identical.
Linear View (left): Shows 5 distinct groups.
Nonlinear View (right): No discernible strong structure related to the nonlinear states.
The result is identical.
Linear View (left): Shows 5 distinct groups.
Nonlinear View (right): No discernible strong structure related to the nonlinear states.
ICA on estimated linear coefficients from Raw Data
Linear View (left): As expected, it cleanly separates the 5 clusters.
Nonlinear View (right): The 2 states are completely mixed. The method is blind to this structure.
Linear View (left): As expected, it cleanly separates the 5 clusters.
Nonlinear View (right): The 2 states are completely mixed. The method is blind to this structure.


July 20, 2025 at 7:49 PM
ICA on estimated linear coefficients from Raw Data
Linear View (left): As expected, it cleanly separates the 5 clusters.
Nonlinear View (right): The 2 states are completely mixed. The method is blind to this structure.
Linear View (left): As expected, it cleanly separates the 5 clusters.
Nonlinear View (right): The 2 states are completely mixed. The method is blind to this structure.
First of all, PCA with N_eig = 2 is uninformative, I expected that. PCA is not optimize for cluster separation. Nothing dramatic here.
Linear View (left)
Nonlinear View (right).
Linear View (left)
Nonlinear View (right).


July 20, 2025 at 7:49 PM
First of all, PCA with N_eig = 2 is uninformative, I expected that. PCA is not optimize for cluster separation. Nothing dramatic here.
Linear View (left)
Nonlinear View (right).
Linear View (left)
Nonlinear View (right).
factor distributions. Left: the unimodal Gaussian for the linear signal. Right: the bimodal, U-shaped distribution for the nonlinear signal.
The inspiration is a simple idealized case of a dynamical system whose agents behavior depends both on interactions with similar agents but also two regimes.
The inspiration is a simple idealized case of a dynamical system whose agents behavior depends both on interactions with similar agents but also two regimes.

July 20, 2025 at 7:49 PM
factor distributions. Left: the unimodal Gaussian for the linear signal. Right: the bimodal, U-shaped distribution for the nonlinear signal.
The inspiration is a simple idealized case of a dynamical system whose agents behavior depends both on interactions with similar agents but also two regimes.
The inspiration is a simple idealized case of a dynamical system whose agents behavior depends both on interactions with similar agents but also two regimes.

Network snapshots: After 1,000 rounds, TMFG for ω=0 shows a tight core of high‐α/high‐r agents and peripherals of low performers. For ω=1, graph is more uniform: nodes mix regardless of α and r.


June 4, 2025 at 12:17 AM
Network snapshots: After 1,000 rounds, TMFG for ω=0 shows a tight core of high‐α/high‐r agents and peripherals of low performers. For ω=1, graph is more uniform: nodes mix regardless of α and r.
For ω=0, one strategy grabs ~80% usage: everyone chases a “meta.” As ω→0.5+, usage spreads: top 5–10 strategies each get ~10–20%. This promotes diversity.

June 4, 2025 at 12:17 AM
For ω=0, one strategy grabs ~80% usage: everyone chases a “meta.” As ω→0.5+, usage spreads: top 5–10 strategies each get ~10–20%. This promotes diversity.
We measure NDCG of each agent’s local ĉ ranking vs true ranking. At ω≈0, mean NDCG ≈0.70; at ω≈1, ≈0.85. Balanced games let agents learn matchups more accurately (or there’s nothing to learn since matchups are uniform)

June 4, 2025 at 12:17 AM
We measure NDCG of each agent’s local ĉ ranking vs true ranking. At ω≈0, mean NDCG ≈0.70; at ω≈1, ≈0.85. Balanced games let agents learn matchups more accurately (or there’s nothing to learn since matchups are uniform)
For ω≈0, r’s distribution is bimodal—some agents drive the dominant strategy, others slump. For ω near 1, r’s are unimodal but skewed left (most agents hover around average)

June 4, 2025 at 12:17 AM
For ω≈0, r’s distribution is bimodal—some agents drive the dominant strategy, others slump. For ω near 1, r’s are unimodal but skewed left (most agents hover around average)
Scatter of performance ratio r vs skill α for different ω. At ω=1 (balanced), r tracks α smoothly (diminishing returns). At low ω, points split into two blobs—high‐skill cluster and low‐skill cluster.

June 4, 2025 at 12:17 AM
Scatter of performance ratio r vs skill α for different ω. At ω=1 (balanced), r tracks α smoothly (diminishing returns). At low ω, points split into two blobs—high‐skill cluster and low‐skill cluster.
We model each pairwise win probability c_{i,j} using two intuitive knobs “balance” ω (how fair matchups are) and “noise” b (randomness). Low ω means rock-paper-scissors style; high ω means nearly 50-50 every pairing.

June 4, 2025 at 12:17 AM
We model each pairwise win probability c_{i,j} using two intuitive knobs “balance” ω (how fair matchups are) and “noise” b (randomness). Low ω means rock-paper-scissors style; high ω means nearly 50-50 every pairing.


Why does economics need complexity?
link.springer.com/article/10.1...
link.springer.com/article/10.1...

April 26, 2025 at 7:33 AM
Why does economics need complexity?
link.springer.com/article/10.1...
link.springer.com/article/10.1...
