


Supply Chain Logistics Consulting Inc.
@sclci.bsky.social
*Insights*&*Information*
#SupplyChainManagement #Logistics #Sustainability #Procurement #Statistics #GlobalTrade #Inventory #Consulting #Business #Innovation #Technology #LeadTheField
#SupplyChainManagement #Logistics #Sustainability #Procurement #Statistics #GlobalTrade #Inventory #Consulting #Business #Innovation #Technology #LeadTheField
Procurement pros surveyed said safety is usually the most important (🔝 weight) when selecting suppliers.
1️⃣ Safety,
2️⃣ Social Sustainability,
3️⃣ Governance
#supplychain #logistics #suppliercriteria
Report🔗 www.capsresearch.org/blog/posts/2...
@CAPSResearch www.capsresearch.org/blog/posts/2...
1️⃣ Safety,
2️⃣ Social Sustainability,
3️⃣ Governance
#supplychain #logistics #suppliercriteria
Report🔗 www.capsresearch.org/blog/posts/2...
@CAPSResearch www.capsresearch.org/blog/posts/2...

November 9, 2025 at 5:08 PM
Procurement pros surveyed said safety is usually the most important (🔝 weight) when selecting suppliers.
1️⃣ Safety,
2️⃣ Social Sustainability,
3️⃣ Governance
#supplychain #logistics #suppliercriteria
Report🔗 www.capsresearch.org/blog/posts/2...
@CAPSResearch www.capsresearch.org/blog/posts/2...
1️⃣ Safety,
2️⃣ Social Sustainability,
3️⃣ Governance
#supplychain #logistics #suppliercriteria
Report🔗 www.capsresearch.org/blog/posts/2...
@CAPSResearch www.capsresearch.org/blog/posts/2...
What’s a smart city?
✅ Data-driven services
✅ Inclusive governance
✅ Resilient infrastructure
✅ Climate-smart policies
#Supplychainlogistics #urbaninfrastructure
#WorldCitiesDay is Oct. 31
✅ Data-driven services
✅ Inclusive governance
✅ Resilient infrastructure
✅ Climate-smart policies
#Supplychainlogistics #urbaninfrastructure
#WorldCitiesDay is Oct. 31

October 15, 2025 at 2:47 PM
What’s a smart city?
✅ Data-driven services
✅ Inclusive governance
✅ Resilient infrastructure
✅ Climate-smart policies
#Supplychainlogistics #urbaninfrastructure
#WorldCitiesDay is Oct. 31
✅ Data-driven services
✅ Inclusive governance
✅ Resilient infrastructure
✅ Climate-smart policies
#Supplychainlogistics #urbaninfrastructure
#WorldCitiesDay is Oct. 31
Update: U.S. tariffs 🇺🇸 on Canadian🇨🇦 goods.
❌📃No deal yet:
The CA + US are prioritizing agreements on steel⚙️, aluminum🥫, and energy🛢️, first before others.
➡️ Read more here: theglobeandmail.com/world/article-… @GlobalTradeMa#supplychaonlogisticsc#econskyk#tradeskyky
❌📃No deal yet:
The CA + US are prioritizing agreements on steel⚙️, aluminum🥫, and energy🛢️, first before others.
➡️ Read more here: theglobeandmail.com/world/article-… @GlobalTradeMa#supplychaonlogisticsc#econskyk#tradeskyky

October 9, 2025 at 2:35 PM
Update: U.S. tariffs 🇺🇸 on Canadian🇨🇦 goods.
❌📃No deal yet:
The CA + US are prioritizing agreements on steel⚙️, aluminum🥫, and energy🛢️, first before others.
➡️ Read more here: theglobeandmail.com/world/article-… @GlobalTradeMa#supplychaonlogisticsc#econskyk#tradeskyky
❌📃No deal yet:
The CA + US are prioritizing agreements on steel⚙️, aluminum🥫, and energy🛢️, first before others.
➡️ Read more here: theglobeandmail.com/world/article-… @GlobalTradeMa#supplychaonlogisticsc#econskyk#tradeskyky
🌽Feeding the world is no small task. It’s a prime example of how globalization keeps the world connected.
🍁For Canada, exports of corn, wheat, barley and canola have significant importance as exports to global buyers.
🍁For Canada, exports of corn, wheat, barley and canola have significant importance as exports to global buyers.
October 3, 2025 at 2:13 PM
🌽Feeding the world is no small task. It’s a prime example of how globalization keeps the world connected.
🍁For Canada, exports of corn, wheat, barley and canola have significant importance as exports to global buyers.
🍁For Canada, exports of corn, wheat, barley and canola have significant importance as exports to global buyers.
Visualized 🇨🇦Canadian Natural Resources
🧪 Potash 1.1B t
🛢️ Oil 168B barrels
☢️ Uranium 589K t
👑 Gold 3.2K t
🌲 Forest 3.5M sq. km
💧Water 2.3T cubic m
#supplychain #logistics #CanadaExports #intltrade @VisualCap
🧪 Potash 1.1B t
🛢️ Oil 168B barrels
☢️ Uranium 589K t
👑 Gold 3.2K t
🌲 Forest 3.5M sq. km
💧Water 2.3T cubic m
#supplychain #logistics #CanadaExports #intltrade @VisualCap

October 2, 2025 at 1:34 PM
Visualized 🇨🇦Canadian Natural Resources
🧪 Potash 1.1B t
🛢️ Oil 168B barrels
☢️ Uranium 589K t
👑 Gold 3.2K t
🌲 Forest 3.5M sq. km
💧Water 2.3T cubic m
#supplychain #logistics #CanadaExports #intltrade @VisualCap
🧪 Potash 1.1B t
🛢️ Oil 168B barrels
☢️ Uranium 589K t
👑 Gold 3.2K t
🌲 Forest 3.5M sq. km
💧Water 2.3T cubic m
#supplychain #logistics #CanadaExports #intltrade @VisualCap
Visualized 🌎 Global Airline Traffic by Total Daily Flights
….✈️
5668 American
4515 Delta
4249 United
3406 Southwest
2564 China Eastern
2242 Ryanair
2238 IndiGo
1728 Air China
1567 LATAM
Data @AirNavRadar 🛩️
#supplychain #logistics #airtraffic #flights
….✈️
5668 American
4515 Delta
4249 United
3406 Southwest
2564 China Eastern
2242 Ryanair
2238 IndiGo
1728 Air China
1567 LATAM
Data @AirNavRadar 🛩️
#supplychain #logistics #airtraffic #flights

September 16, 2025 at 1:22 AM
Visualized 🌎 Global Airline Traffic by Total Daily Flights
….✈️
5668 American
4515 Delta
4249 United
3406 Southwest
2564 China Eastern
2242 Ryanair
2238 IndiGo
1728 Air China
1567 LATAM
Data @AirNavRadar 🛩️
#supplychain #logistics #airtraffic #flights
….✈️
5668 American
4515 Delta
4249 United
3406 Southwest
2564 China Eastern
2242 Ryanair
2238 IndiGo
1728 Air China
1567 LATAM
Data @AirNavRadar 🛩️
#supplychain #logistics #airtraffic #flights
Visualized: Global Vehicle Production in 2024 🏎️💨
🌎Top Vehicle Producers
🇨🇳CN 31.3 million vehicle
🇺🇸US 10.6 million vehicle
🇯🇵JP 8.2 million vehicle
🇮🇳IN 6.0 million vehicle
🇲🇽MX 4.2 million vehicle
SupplyChainLogistics.net
#supplychain #automotive
#logistics #valuechain
🌎Top Vehicle Producers
🇨🇳CN 31.3 million vehicle
🇺🇸US 10.6 million vehicle
🇯🇵JP 8.2 million vehicle
🇮🇳IN 6.0 million vehicle
🇲🇽MX 4.2 million vehicle
SupplyChainLogistics.net
#supplychain #automotive
#logistics #valuechain

September 1, 2025 at 3:51 PM
Visualized: Global Vehicle Production in 2024 🏎️💨
🌎Top Vehicle Producers
🇨🇳CN 31.3 million vehicle
🇺🇸US 10.6 million vehicle
🇯🇵JP 8.2 million vehicle
🇮🇳IN 6.0 million vehicle
🇲🇽MX 4.2 million vehicle
SupplyChainLogistics.net
#supplychain #automotive
#logistics #valuechain
🌎Top Vehicle Producers
🇨🇳CN 31.3 million vehicle
🇺🇸US 10.6 million vehicle
🇯🇵JP 8.2 million vehicle
🇮🇳IN 6.0 million vehicle
🇲🇽MX 4.2 million vehicle
SupplyChainLogistics.net
#supplychain #automotive
#logistics #valuechain
Identifying where each belongs assists in vendor management strategies:
Strategic: Partnership
Leverage Item: Price
Bottleneck: Contract
Non Critical: Efficiency
#supplychain #procurement #riskmanagement
Strategic: Partnership
Leverage Item: Price
Bottleneck: Contract
Non Critical: Efficiency
#supplychain #procurement #riskmanagement


August 14, 2025 at 2:00 PM
Identifying where each belongs assists in vendor management strategies:
Strategic: Partnership
Leverage Item: Price
Bottleneck: Contract
Non Critical: Efficiency
#supplychain #procurement #riskmanagement
Strategic: Partnership
Leverage Item: Price
Bottleneck: Contract
Non Critical: Efficiency
#supplychain #procurement #riskmanagement
How to establish a risk profile for vendors?
Try Kraljic’s Purchasing Portfolio Matrix + Visualize reliance on materials;
➡️Vulnerability of the material (supply risk)
➡️Impact from loss of supply (strategic impact)
➡️Criticality of materials (circle size)
#supplychain #analysis
Try Kraljic’s Purchasing Portfolio Matrix + Visualize reliance on materials;
➡️Vulnerability of the material (supply risk)
➡️Impact from loss of supply (strategic impact)
➡️Criticality of materials (circle size)
#supplychain #analysis

August 14, 2025 at 1:59 PM
How to establish a risk profile for vendors?
Try Kraljic’s Purchasing Portfolio Matrix + Visualize reliance on materials;
➡️Vulnerability of the material (supply risk)
➡️Impact from loss of supply (strategic impact)
➡️Criticality of materials (circle size)
#supplychain #analysis
Try Kraljic’s Purchasing Portfolio Matrix + Visualize reliance on materials;
➡️Vulnerability of the material (supply risk)
➡️Impact from loss of supply (strategic impact)
➡️Criticality of materials (circle size)
#supplychain #analysis
Update: USA | EU Trade.
The USA🇺🇸 imported €584 Billion of goods⬅️ from EU🇪🇺 (2024)
Combined, EU Nation Members imports into the USA exceed any other single Country.
EU goods exported to➡️US up 44%, last 10 yrs.
🔧New Tariffs on EU Steel (see comments ⤵️)
ec.europa.eu/commission/p...
The USA🇺🇸 imported €584 Billion of goods⬅️ from EU🇪🇺 (2024)
Combined, EU Nation Members imports into the USA exceed any other single Country.
EU goods exported to➡️US up 44%, last 10 yrs.
🔧New Tariffs on EU Steel (see comments ⤵️)
ec.europa.eu/commission/p...

August 12, 2025 at 1:30 AM
Update: USA | EU Trade.
The USA🇺🇸 imported €584 Billion of goods⬅️ from EU🇪🇺 (2024)
Combined, EU Nation Members imports into the USA exceed any other single Country.
EU goods exported to➡️US up 44%, last 10 yrs.
🔧New Tariffs on EU Steel (see comments ⤵️)
ec.europa.eu/commission/p...
The USA🇺🇸 imported €584 Billion of goods⬅️ from EU🇪🇺 (2024)
Combined, EU Nation Members imports into the USA exceed any other single Country.
EU goods exported to➡️US up 44%, last 10 yrs.
🔧New Tariffs on EU Steel (see comments ⤵️)
ec.europa.eu/commission/p...

More forecasted impacts since tariffs on revenues:
Nike profit -$1 billion
Hasboro toys -$1 million
Caterpillar -$1.5 billion
More forecasted impacts since tariffs on revenues:
Nike profit -$1 billion
Hasboro toys -$1 million
Caterpillar -$1.5 billion
bnnbloomberg.ca/business/2025/…
Nike profit -$1 billion
Hasboro toys -$1 million
Caterpillar -$1.5 billion
More forecasted impacts since tariffs on revenues:
Nike profit -$1 billion
Hasboro toys -$1 million
Caterpillar -$1.5 billion
bnnbloomberg.ca/business/2025/…


August 6, 2025 at 1:47 PM
More forecasted impacts since tariffs on revenues:
Nike profit -$1 billion
Hasboro toys -$1 million
Caterpillar -$1.5 billion
More forecasted impacts since tariffs on revenues:
Nike profit -$1 billion
Hasboro toys -$1 million
Caterpillar -$1.5 billion
bnnbloomberg.ca/business/2025/…
Nike profit -$1 billion
Hasboro toys -$1 million
Caterpillar -$1.5 billion
More forecasted impacts since tariffs on revenues:
Nike profit -$1 billion
Hasboro toys -$1 million
Caterpillar -$1.5 billion
bnnbloomberg.ca/business/2025/…
Visualized: Top 10 Most Valuable Goods in USA🇺🇸Canadian🇨🇦+ Mexican🇲🇽 trade.
🛣️Top 5🛣️
$270 B Vehicles + Parts
$239B Computers +
Equipment
$208B Fuel Products
$182B Machinery
$60B Non Commercial + Special Handling Items
#supplychain #globaltrade chart @VisualCap Data @bts_usdot
🛣️Top 5🛣️
$270 B Vehicles + Parts
$239B Computers +
Equipment
$208B Fuel Products
$182B Machinery
$60B Non Commercial + Special Handling Items
#supplychain #globaltrade chart @VisualCap Data @bts_usdot

August 1, 2025 at 1:00 AM
Visualized: Top 10 Most Valuable Goods in USA🇺🇸Canadian🇨🇦+ Mexican🇲🇽 trade.
🛣️Top 5🛣️
$270 B Vehicles + Parts
$239B Computers +
Equipment
$208B Fuel Products
$182B Machinery
$60B Non Commercial + Special Handling Items
#supplychain #globaltrade chart @VisualCap Data @bts_usdot
🛣️Top 5🛣️
$270 B Vehicles + Parts
$239B Computers +
Equipment
$208B Fuel Products
$182B Machinery
$60B Non Commercial + Special Handling Items
#supplychain #globaltrade chart @VisualCap Data @bts_usdot
Visualized: Global Steel Production by Country
in 2024 🏭
🌎 Top 5 Countries
🇨🇳CN 1 B tonne
🇮🇳IN 149.4 M t
🇯🇵JP 84 M t
🇺🇸US 79.5 M t
🇷🇺RU 71 M t
#supplychain #globaltrade #maufacturing chart @VisualCap data from @worldsteel
in 2024 🏭
🌎 Top 5 Countries
🇨🇳CN 1 B tonne
🇮🇳IN 149.4 M t
🇯🇵JP 84 M t
🇺🇸US 79.5 M t
🇷🇺RU 71 M t
#supplychain #globaltrade #maufacturing chart @VisualCap data from @worldsteel

July 30, 2025 at 3:04 PM
Visualized: Global Steel Production by Country
in 2024 🏭
🌎 Top 5 Countries
🇨🇳CN 1 B tonne
🇮🇳IN 149.4 M t
🇯🇵JP 84 M t
🇺🇸US 79.5 M t
🇷🇺RU 71 M t
#supplychain #globaltrade #maufacturing chart @VisualCap data from @worldsteel
in 2024 🏭
🌎 Top 5 Countries
🇨🇳CN 1 B tonne
🇮🇳IN 149.4 M t
🇯🇵JP 84 M t
🇺🇸US 79.5 M t
🇷🇺RU 71 M t
#supplychain #globaltrade #maufacturing chart @VisualCap data from @worldsteel
77% of CEO’s surveyed say the business Operating model is failing.
Acceleration requires varying types of innovation; 💡🚀
🛠️Tactical focused on efficiency (💧🚜sweat the assets)
🔀 Transformational: disrupts industries and business models (⛓️💥🆕 formative/disruptive)
#supplychain #innovation #growth
Acceleration requires varying types of innovation; 💡🚀
🛠️Tactical focused on efficiency (💧🚜sweat the assets)
🔀 Transformational: disrupts industries and business models (⛓️💥🆕 formative/disruptive)
#supplychain #innovation #growth

June 21, 2025 at 2:35 AM
77% of CEO’s surveyed say the business Operating model is failing.
Acceleration requires varying types of innovation; 💡🚀
🛠️Tactical focused on efficiency (💧🚜sweat the assets)
🔀 Transformational: disrupts industries and business models (⛓️💥🆕 formative/disruptive)
#supplychain #innovation #growth
Acceleration requires varying types of innovation; 💡🚀
🛠️Tactical focused on efficiency (💧🚜sweat the assets)
🔀 Transformational: disrupts industries and business models (⛓️💥🆕 formative/disruptive)
#supplychain #innovation #growth
Which countries produce the most coffee? (2024)
Number of 60kg bags 💰🫘
🇧🇷 Brazil 66.4 M 💰 🫘
🇻🇳 Vietnam 30.1 M 💰🫘
🇨🇴 Colombia 12.9 M💰🫘
🇮🇩 Indonesia 10.9 M 💰🫘
🇪🇹 Ethiopia 8.36 M 💰🫘
#supplychain #logistics #coffeechain Data @usda-bot.bsky.social
Number of 60kg bags 💰🫘
🇧🇷 Brazil 66.4 M 💰 🫘
🇻🇳 Vietnam 30.1 M 💰🫘
🇨🇴 Colombia 12.9 M💰🫘
🇮🇩 Indonesia 10.9 M 💰🫘
🇪🇹 Ethiopia 8.36 M 💰🫘
#supplychain #logistics #coffeechain Data @usda-bot.bsky.social

June 17, 2025 at 12:26 AM
Which countries produce the most coffee? (2024)
Number of 60kg bags 💰🫘
🇧🇷 Brazil 66.4 M 💰 🫘
🇻🇳 Vietnam 30.1 M 💰🫘
🇨🇴 Colombia 12.9 M💰🫘
🇮🇩 Indonesia 10.9 M 💰🫘
🇪🇹 Ethiopia 8.36 M 💰🫘
#supplychain #logistics #coffeechain Data @usda-bot.bsky.social
Number of 60kg bags 💰🫘
🇧🇷 Brazil 66.4 M 💰 🫘
🇻🇳 Vietnam 30.1 M 💰🫘
🇨🇴 Colombia 12.9 M💰🫘
🇮🇩 Indonesia 10.9 M 💰🫘
🇪🇹 Ethiopia 8.36 M 💰🫘
#supplychain #logistics #coffeechain Data @usda-bot.bsky.social

June 15, 2025 at 2:56 AM
Customer-Centric Companies invest in:
📊 Analytics,
📍🗺️ Journey mapping
🎒📚✨Training + Talent
Results of Customer Focused Supply Chains;
⏰ Predictability
🚚 On-Time Deliveries
☑️💨Faster Order Fulfilment
bit.ly/gartner-tf25
#supplychain #customerdriven #logistics
📊 Analytics,
📍🗺️ Journey mapping
🎒📚✨Training + Talent
Results of Customer Focused Supply Chains;
⏰ Predictability
🚚 On-Time Deliveries
☑️💨Faster Order Fulfilment
bit.ly/gartner-tf25
#supplychain #customerdriven #logistics

June 13, 2025 at 11:58 AM
Customer-Centric Companies invest in:
📊 Analytics,
📍🗺️ Journey mapping
🎒📚✨Training + Talent
Results of Customer Focused Supply Chains;
⏰ Predictability
🚚 On-Time Deliveries
☑️💨Faster Order Fulfilment
bit.ly/gartner-tf25
#supplychain #customerdriven #logistics
📊 Analytics,
📍🗺️ Journey mapping
🎒📚✨Training + Talent
Results of Customer Focused Supply Chains;
⏰ Predictability
🚚 On-Time Deliveries
☑️💨Faster Order Fulfilment
bit.ly/gartner-tf25
#supplychain #customerdriven #logistics
🌏 Global GDP nearly $110 trillion (2024)
📈Emerging and developing economies account for nearly 60% of global GDP
💻Advanced economies comprise over 40%…
🇨🇳China + 🇮🇳India have sustained high growth rates over a long period
🇧🇷Brazil’s economy was surpassed by Italy (2024)
#supplychain #logistics
📈Emerging and developing economies account for nearly 60% of global GDP
💻Advanced economies comprise over 40%…
🇨🇳China + 🇮🇳India have sustained high growth rates over a long period
🇧🇷Brazil’s economy was surpassed by Italy (2024)
#supplychain #logistics

June 11, 2025 at 3:17 PM
🌏 Global GDP nearly $110 trillion (2024)
📈Emerging and developing economies account for nearly 60% of global GDP
💻Advanced economies comprise over 40%…
🇨🇳China + 🇮🇳India have sustained high growth rates over a long period
🇧🇷Brazil’s economy was surpassed by Italy (2024)
#supplychain #logistics
📈Emerging and developing economies account for nearly 60% of global GDP
💻Advanced economies comprise over 40%…
🇨🇳China + 🇮🇳India have sustained high growth rates over a long period
🇧🇷Brazil’s economy was surpassed by Italy (2024)
#supplychain #logistics
🔹Ocean related goods trade lower than services (2023) ↘️
🏝️Services:
#1 Tourism
#2 Marine Freight
🔹💲Ocean Exports are Mostly Services, example: Tourism $725B ⛱️
🏝️Small island states have surpluses in both 🚢 Services🍹+ Goods 🍌🥥
#oceantrade #globaltrade #valuechain #oceanvaluechain #marinesupplychain
🏝️Services:
#1 Tourism
#2 Marine Freight
🔹💲Ocean Exports are Mostly Services, example: Tourism $725B ⛱️
🏝️Small island states have surpluses in both 🚢 Services🍹+ Goods 🍌🥥
#oceantrade #globaltrade #valuechain #oceanvaluechain #marinesupplychain


June 10, 2025 at 4:34 PM
🔹Ocean related goods trade lower than services (2023) ↘️
🏝️Services:
#1 Tourism
#2 Marine Freight
🔹💲Ocean Exports are Mostly Services, example: Tourism $725B ⛱️
🏝️Small island states have surpluses in both 🚢 Services🍹+ Goods 🍌🥥
#oceantrade #globaltrade #valuechain #oceanvaluechain #marinesupplychain
🏝️Services:
#1 Tourism
#2 Marine Freight
🔹💲Ocean Exports are Mostly Services, example: Tourism $725B ⛱️
🏝️Small island states have surpluses in both 🚢 Services🍹+ Goods 🍌🥥
#oceantrade #globaltrade #valuechain #oceanvaluechain #marinesupplychain
Visualized: Smart Phone Components 📲🏭⚙️
RARE EARTHS
📳 8 Rare Earths are needed for one Smart Phone
#supplychain #logistics #resources #manufacturing @visualcap.bsky.social
RARE EARTHS
📳 8 Rare Earths are needed for one Smart Phone
#supplychain #logistics #resources #manufacturing @visualcap.bsky.social

May 22, 2025 at 1:29 PM
Visualized: Smart Phone Components 📲🏭⚙️
RARE EARTHS
📳 8 Rare Earths are needed for one Smart Phone
#supplychain #logistics #resources #manufacturing @visualcap.bsky.social
RARE EARTHS
📳 8 Rare Earths are needed for one Smart Phone
#supplychain #logistics #resources #manufacturing @visualcap.bsky.social
Visualized: US Critical Mineral List (2022)
Minerals that USA government deemed critical to;
1️⃣ Economic security, and
2️⃣ National security
#supplychain #logistics #resources
Minerals that USA government deemed critical to;
1️⃣ Economic security, and
2️⃣ National security
#supplychain #logistics #resources

May 22, 2025 at 1:22 PM
Visualized: US Critical Mineral List (2022)
Minerals that USA government deemed critical to;
1️⃣ Economic security, and
2️⃣ National security
#supplychain #logistics #resources
Minerals that USA government deemed critical to;
1️⃣ Economic security, and
2️⃣ National security
#supplychain #logistics #resources
Visualized: The Global Recycling Rates of Various Metals (2021)
✨Precious,
⚠️Critical, and
🔅Rare Earths
🌍♻️👑
86% Gold 👑
60% Palladium 🔬
60% Nickel
50% Silver 💍
46% Copper 🔌
42% Aluminum✈️
34% Chromium
33% Zinc 🔗
32% Cobalt 🔋
0.5% Lithium 🔋
0.2% REEs📱
#supplychain #logistics #wastemanagement
✨Precious,
⚠️Critical, and
🔅Rare Earths
🌍♻️👑
86% Gold 👑
60% Palladium 🔬
60% Nickel
50% Silver 💍
46% Copper 🔌
42% Aluminum✈️
34% Chromium
33% Zinc 🔗
32% Cobalt 🔋
0.5% Lithium 🔋
0.2% REEs📱
#supplychain #logistics #wastemanagement

May 22, 2025 at 1:19 PM
Visualized: The Global Recycling Rates of Various Metals (2021)
✨Precious,
⚠️Critical, and
🔅Rare Earths
🌍♻️👑
86% Gold 👑
60% Palladium 🔬
60% Nickel
50% Silver 💍
46% Copper 🔌
42% Aluminum✈️
34% Chromium
33% Zinc 🔗
32% Cobalt 🔋
0.5% Lithium 🔋
0.2% REEs📱
#supplychain #logistics #wastemanagement
✨Precious,
⚠️Critical, and
🔅Rare Earths
🌍♻️👑
86% Gold 👑
60% Palladium 🔬
60% Nickel
50% Silver 💍
46% Copper 🔌
42% Aluminum✈️
34% Chromium
33% Zinc 🔗
32% Cobalt 🔋
0.5% Lithium 🔋
0.2% REEs📱
#supplychain #logistics #wastemanagement
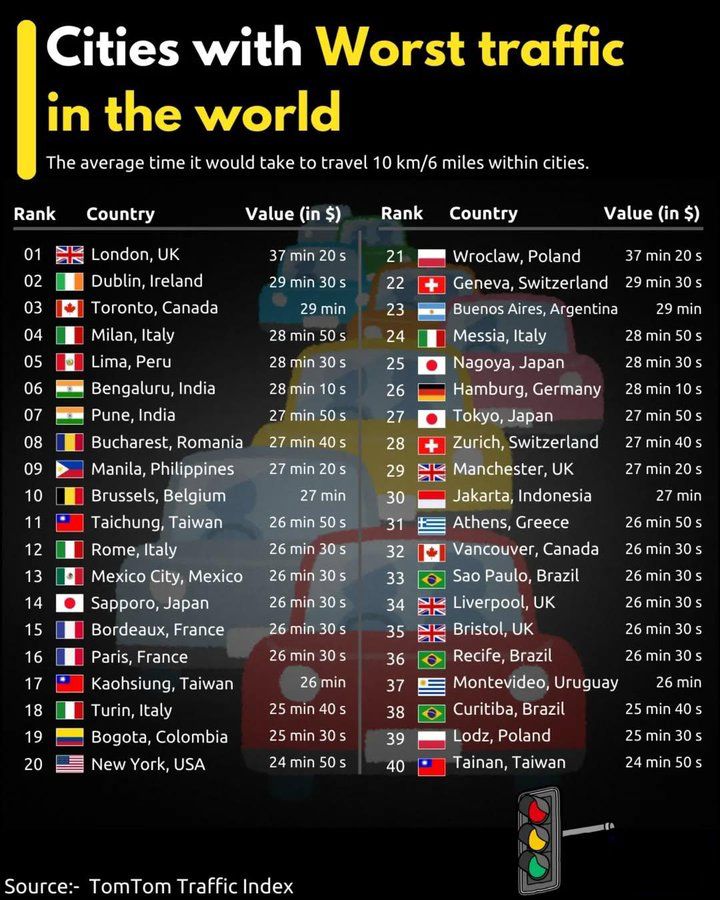
40 Slowest Cities (Worst Traffic) 🚦🚗🚕🚓?
Travel Time ⏰ for
10 Kilometer’s 🏁
1. 🇬🇧 London UK 37:20s
2. 🇮🇪 Dublin IE 29:30s
3. 🇨🇦 Toronto CA 29m
4. 🇮🇹 Milan IT 28:50s
5. 🇵🇪 Lima PE 28:30s
6. 🇮🇳 Bengaluru IN 28:10s
7. 🇮🇳 Pune IN 27:50s
8. 🇷🇴 Bucharest RO 27:40s
9. 🇵🇭 Manila PH 27:20s
10. 🇧🇪 Brussels BE 27m
Travel Time ⏰ for
10 Kilometer’s 🏁
1. 🇬🇧 London UK 37:20s
2. 🇮🇪 Dublin IE 29:30s
3. 🇨🇦 Toronto CA 29m
4. 🇮🇹 Milan IT 28:50s
5. 🇵🇪 Lima PE 28:30s
6. 🇮🇳 Bengaluru IN 28:10s
7. 🇮🇳 Pune IN 27:50s
8. 🇷🇴 Bucharest RO 27:40s
9. 🇵🇭 Manila PH 27:20s
10. 🇧🇪 Brussels BE 27m
May 21, 2025 at 12:55 PM
40 Slowest Cities (Worst Traffic) 🚦🚗🚕🚓?
Travel Time ⏰ for
10 Kilometer’s 🏁
1. 🇬🇧 London UK 37:20s
2. 🇮🇪 Dublin IE 29:30s
3. 🇨🇦 Toronto CA 29m
4. 🇮🇹 Milan IT 28:50s
5. 🇵🇪 Lima PE 28:30s
6. 🇮🇳 Bengaluru IN 28:10s
7. 🇮🇳 Pune IN 27:50s
8. 🇷🇴 Bucharest RO 27:40s
9. 🇵🇭 Manila PH 27:20s
10. 🇧🇪 Brussels BE 27m
Travel Time ⏰ for
10 Kilometer’s 🏁
1. 🇬🇧 London UK 37:20s
2. 🇮🇪 Dublin IE 29:30s
3. 🇨🇦 Toronto CA 29m
4. 🇮🇹 Milan IT 28:50s
5. 🇵🇪 Lima PE 28:30s
6. 🇮🇳 Bengaluru IN 28:10s
7. 🇮🇳 Pune IN 27:50s
8. 🇷🇴 Bucharest RO 27:40s
9. 🇵🇭 Manila PH 27:20s
10. 🇧🇪 Brussels BE 27m
Visualized: The World’s Recycled Plastic Waste 🌏♻️🚯 (Globally, 2023)
Disposal Method:
9% Recycled
19% Incinerated
22% Mismanaged
49% Landfilled
#supplychain #logistics #wastemanagement Chart by @visualcap.bsky.social data from @oecd-ocde.bsky.social
Disposal Method:
9% Recycled
19% Incinerated
22% Mismanaged
49% Landfilled
#supplychain #logistics #wastemanagement Chart by @visualcap.bsky.social data from @oecd-ocde.bsky.social

May 20, 2025 at 7:28 PM
Visualized: The World’s Recycled Plastic Waste 🌏♻️🚯 (Globally, 2023)
Disposal Method:
9% Recycled
19% Incinerated
22% Mismanaged
49% Landfilled
#supplychain #logistics #wastemanagement Chart by @visualcap.bsky.social data from @oecd-ocde.bsky.social
Disposal Method:
9% Recycled
19% Incinerated
22% Mismanaged
49% Landfilled
#supplychain #logistics #wastemanagement Chart by @visualcap.bsky.social data from @oecd-ocde.bsky.social