


Robbi Bishop-Taylor 🛰️🌏
@satellitesci.bsky.social
Coastal Earth Observation Scientist from Canberra, Australia. Using satellite remote sensing 🛰️, open-source geospatial 🔓🗺️, Python + R 🧑💻 and dataviz 🎨 to map the earth through space + time... 🌏
Last chance to register for free online attendance at the #AusYCSEC Young Coastal Scientists & Engineers Conference!
Come along to hear lots of exciting coastal research happening across Australasia... plus a special new data announcement from Geoscience Aus in the opening session! 🤩🌊📷🛰️
Come along to hear lots of exciting coastal research happening across Australasia... plus a special new data announcement from Geoscience Aus in the opening session! 🤩🌊📷🛰️

September 24, 2025 at 7:29 AM
Last chance to register for free online attendance at the #AusYCSEC Young Coastal Scientists & Engineers Conference!
Come along to hear lots of exciting coastal research happening across Australasia... plus a special new data announcement from Geoscience Aus in the opening session! 🤩🌊📷🛰️
Come along to hear lots of exciting coastal research happening across Australasia... plus a special new data announcement from Geoscience Aus in the opening session! 🤩🌊📷🛰️
Wonderful to be at #IGARSS2025 in Brisbane! 🛰️Hopefully a nice Take 2 from my first IGARSS in Pasedena, CA where I spent half of the conference locked up in COVID hotel quarantine!

August 3, 2025 at 11:17 PM
Wonderful to be at #IGARSS2025 in Brisbane! 🛰️Hopefully a nice Take 2 from my first IGARSS in Pasedena, CA where I spent half of the conference locked up in COVID hotel quarantine!
I did a tour of the Spit Sand Bypass System a few days ago - it apparently pre-dates the Tweed Sand Bypass and was the first system like it in the world (the new backpass was hit pretty badly by Cyclone Alfred so is currently out of operation)


June 8, 2025 at 5:12 AM
I did a tour of the Spit Sand Bypass System a few days ago - it apparently pre-dates the Tweed Sand Bypass and was the first system like it in the world (the new backpass was hit pretty badly by Cyclone Alfred so is currently out of operation)
Had a fantastic time presenting our new #eotides tide modelling Python package at #CoasttoCoast2025 - couldn't have asked for a more relevant coastal setting than the City of Gold Coast, still recovering from the impacts of #CycloneAlfred!
June 6, 2025 at 5:38 AM
Had a fantastic time presenting our new #eotides tide modelling Python package at #CoasttoCoast2025 - couldn't have asked for a more relevant coastal setting than the City of Gold Coast, still recovering from the impacts of #CycloneAlfred!
Excited to share a new paper in @joss-openjournals.bsky.social: "eo-tides: Tide modelling tools for large-scale satellite Earth observation analysis" 🌊🛰️
A new #opensource Python package designed to help combine satellite data with ocean tide modelling!
joss.theoj.org/papers/10.21...
A new #opensource Python package designed to help combine satellite data with ocean tide modelling!
joss.theoj.org/papers/10.21...
June 5, 2025 at 1:05 AM
Excited to share a new paper in @joss-openjournals.bsky.social: "eo-tides: Tide modelling tools for large-scale satellite Earth observation analysis" 🌊🛰️
A new #opensource Python package designed to help combine satellite data with ocean tide modelling!
joss.theoj.org/papers/10.21...
A new #opensource Python package designed to help combine satellite data with ocean tide modelling!
joss.theoj.org/papers/10.21...
New #DEACoastlines annual shoreline data for 2024 is now live! 🌊🛰️🎉
2024 was a relatively stable year for coastal change across Australia, with mostly moderate and balanced rates of growth and retreat across our coastline.
Interactive map: maps.dea.ga.gov.au/story/DEACoa...
2024 was a relatively stable year for coastal change across Australia, with mostly moderate and balanced rates of growth and retreat across our coastline.
Interactive map: maps.dea.ga.gov.au/story/DEACoa...
May 19, 2025 at 1:23 AM
New #DEACoastlines annual shoreline data for 2024 is now live! 🌊🛰️🎉
2024 was a relatively stable year for coastal change across Australia, with mostly moderate and balanced rates of growth and retreat across our coastline.
Interactive map: maps.dea.ga.gov.au/story/DEACoa...
2024 was a relatively stable year for coastal change across Australia, with mostly moderate and balanced rates of growth and retreat across our coastline.
Interactive map: maps.dea.ga.gov.au/story/DEACoa...
Beautiful mangrove forests and intertidal mudflats stretching across the deeply embayed Saint George Basin in Australia's remote and rugged Kimberley Region.
#Sentinel2 Analysis Ready Data from #DigitalEarthAU: maps.dea.ga.gov.au#share=s-aD1Y...
#Sentinel2 Analysis Ready Data from #DigitalEarthAU: maps.dea.ga.gov.au#share=s-aD1Y...

March 11, 2025 at 6:06 AM
Beautiful mangrove forests and intertidal mudflats stretching across the deeply embayed Saint George Basin in Australia's remote and rugged Kimberley Region.
#Sentinel2 Analysis Ready Data from #DigitalEarthAU: maps.dea.ga.gov.au#share=s-aD1Y...
#Sentinel2 Analysis Ready Data from #DigitalEarthAU: maps.dea.ga.gov.au#share=s-aD1Y...
Longer term view from our #DigitalEarthAU Coastlines coastal change dataset: maps.dea.ga.gov.au#share=s-zreP...
March 10, 2025 at 3:55 AM
Longer term view from our #DigitalEarthAU Coastlines coastal change dataset: maps.dea.ga.gov.au#share=s-zreP...
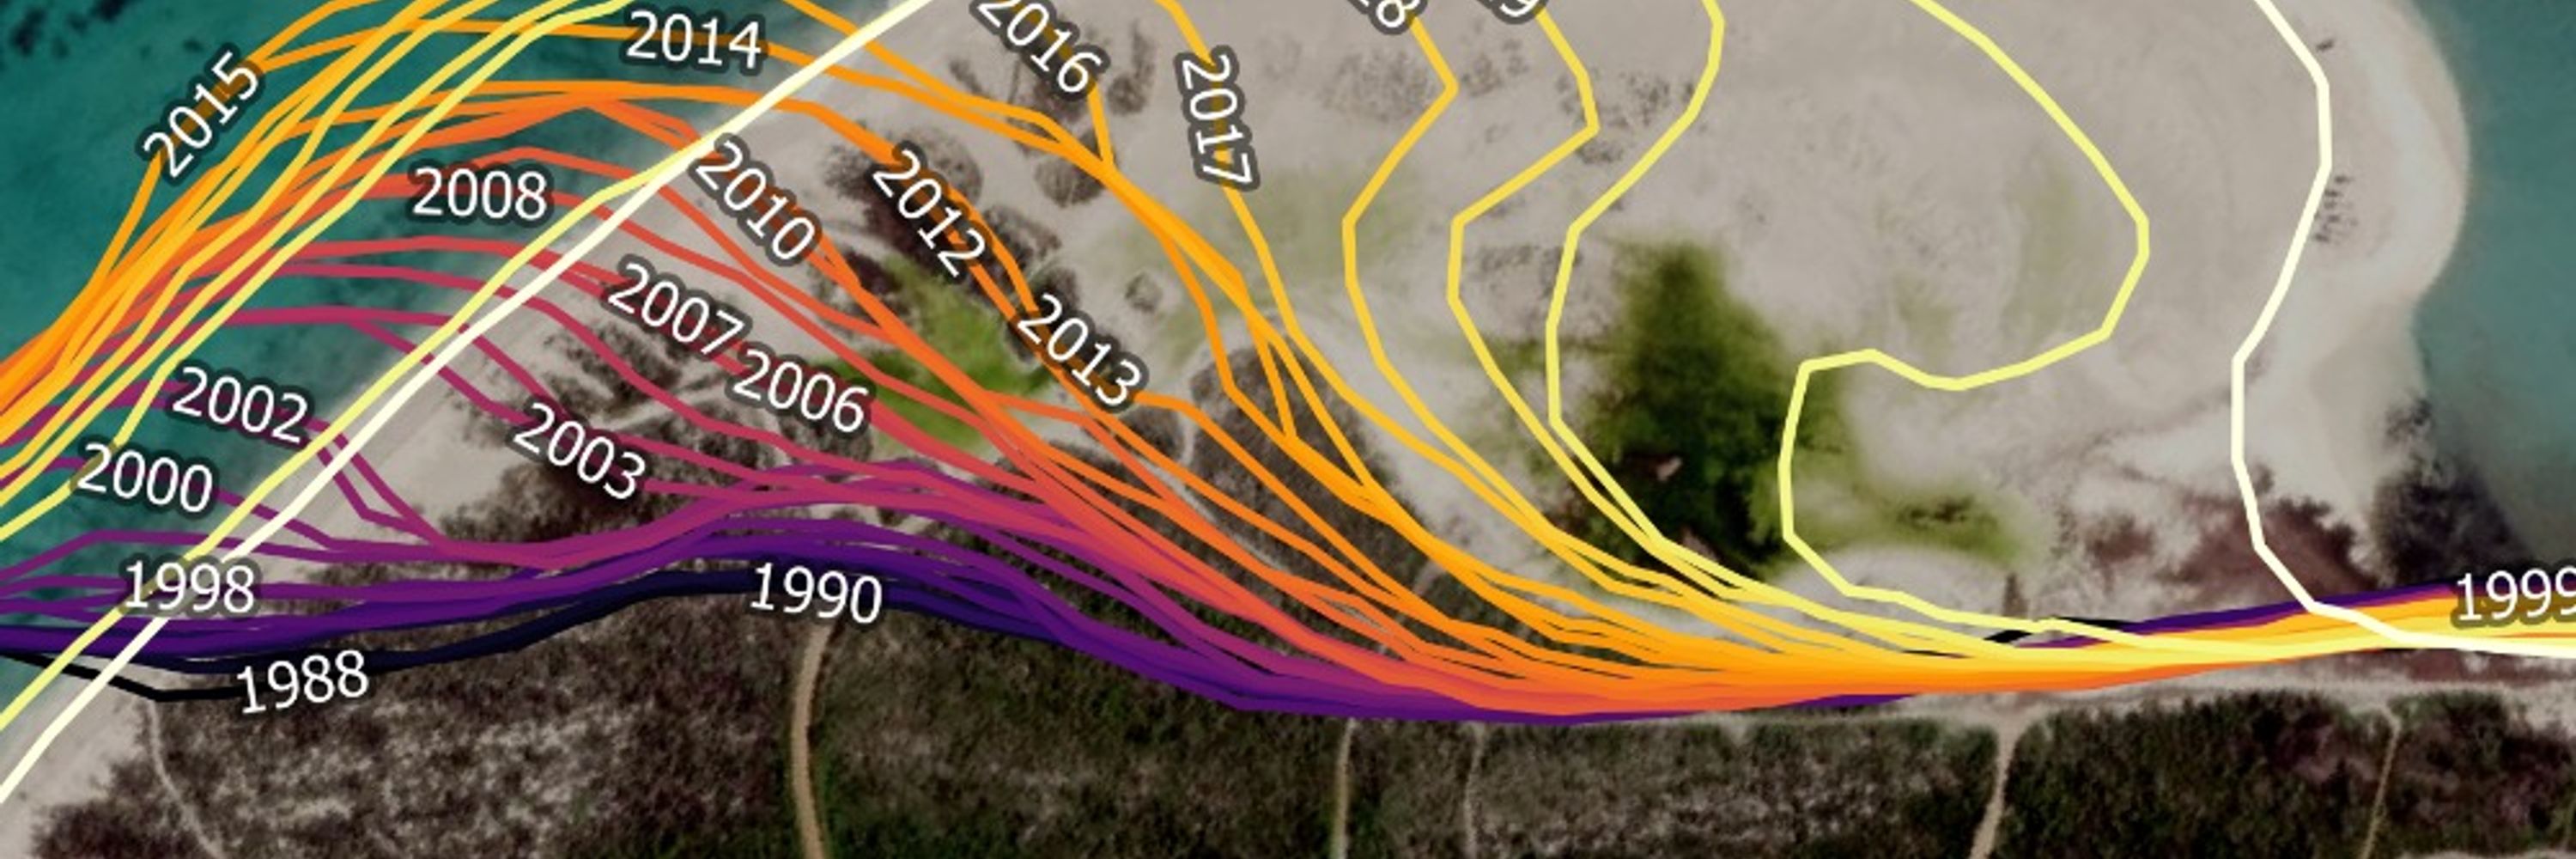
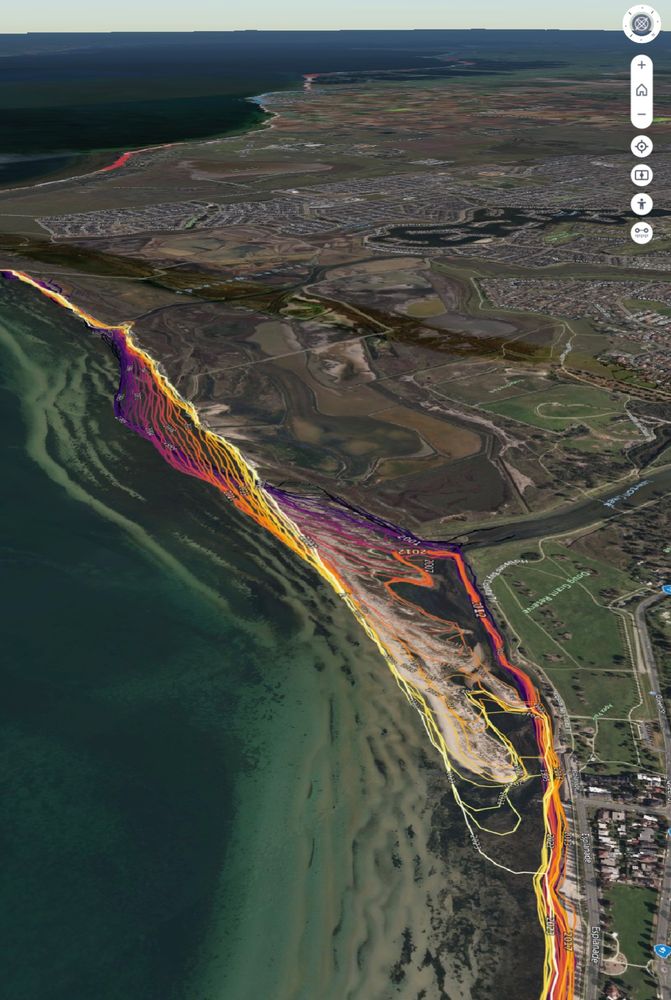
The slow growth of a large sand spit as it intrudes into Melbourne's Altona Beach, captured by #Sentinel2 🛰️
This spit has been moving towards Altona for about 25 years now, averaging 50 metres of growth per year since 2000. It's now over 1.3 km long with no sign of slowing down!
This spit has been moving towards Altona for about 25 years now, averaging 50 metres of growth per year since 2000. It's now over 1.3 km long with no sign of slowing down!
March 10, 2025 at 3:52 AM
The slow growth of a large sand spit as it intrudes into Melbourne's Altona Beach, captured by #Sentinel2 🛰️
This spit has been moving towards Altona for about 25 years now, averaging 50 metres of growth per year since 2000. It's now over 1.3 km long with no sign of slowing down!
This spit has been moving towards Altona for about 25 years now, averaging 50 metres of growth per year since 2000. It's now over 1.3 km long with no sign of slowing down!
Optical satellite remote sensing is often suprisingly useless during extreme events like #CycloneAlfred- there's just too many clouds.🛰️☁️
We were recently lucky to get a rare glimpse through the clouds from #Landsat + #Sentinel2 at Mooloolaba Beach, Queensland - 25-45 metres of erosion since Feb:
We were recently lucky to get a rare glimpse through the clouds from #Landsat + #Sentinel2 at Mooloolaba Beach, Queensland - 25-45 metres of erosion since Feb:


March 10, 2025 at 12:34 AM
Optical satellite remote sensing is often suprisingly useless during extreme events like #CycloneAlfred- there's just too many clouds.🛰️☁️
We were recently lucky to get a rare glimpse through the clouds from #Landsat + #Sentinel2 at Mooloolaba Beach, Queensland - 25-45 metres of erosion since Feb:
We were recently lucky to get a rare glimpse through the clouds from #Landsat + #Sentinel2 at Mooloolaba Beach, Queensland - 25-45 metres of erosion since Feb:
The gradual increase in tide range from left to right? That's part of a longer cycle of long-period tide interactions that are especially pronounced in the Gulf - more context in the figure below:

February 23, 2025 at 10:52 AM
The gradual increase in tide range from left to right? That's part of a longer cycle of long-period tide interactions that are especially pronounced in the Gulf - more context in the figure below:
Some extra observations from VIIRS/NOAA-21 too:


February 14, 2025 at 7:39 AM
Some extra observations from VIIRS/NOAA-21 too:
DEA Hotspots does include Himawari AHI data - you need to add it to the map though as it's not on by default:


February 14, 2025 at 7:36 AM
DEA Hotspots does include Himawari AHI data - you need to add it to the map though as it's not on by default:
And 30 Nov 2024 is the most recent date (at least for this specific variable):

February 13, 2025 at 4:43 AM
And 30 Nov 2024 is the most recent date (at least for this specific variable):
I think the time values themselves are fine, but there appears to be many empty timesteps on either end of the timeseries... 1st Jan 1940 is the first timestep I can see that has data:


February 13, 2025 at 4:40 AM
I think the time values themselves are fine, but there appears to be many empty timesteps on either end of the timeseries... 1st Jan 1940 is the first timestep I can see that has data:
More about these satellite data + tide biases in our 2019 intertidal mapping paper, including some figures plotting out how they compare across Australia: www.sciencedirect.com/science/arti...

February 6, 2025 at 6:18 AM
More about these satellite data + tide biases in our 2019 intertidal mapping paper, including some figures plotting out how they compare across Australia: www.sciencedirect.com/science/arti...
^ This is for a site with a strong bias towards low tide imagery in Landsat and Sentinel-2 data. These biases vary greatly across the world's coastlines - a major challenge for coastal analyses that rely on #EarthObservation data!
e.g. a different site where overpass time is a bit less important:
e.g. a different site where overpass time is a bit less important:
February 6, 2025 at 6:18 AM
^ This is for a site with a strong bias towards low tide imagery in Landsat and Sentinel-2 data. These biases vary greatly across the world's coastlines - a major challenge for coastal analyses that rely on #EarthObservation data!
e.g. a different site where overpass time is a bit less important:
e.g. a different site where overpass time is a bit less important:
An unintentionally hilarious bouncing plot, simulating how overpass time affects how well a hypothetical #EO satellite like Landsat can monitor the tide cycle! 🏀🛰️🌊
Dots = what the satellite sees when it takes an image. Each frame is a different simulated overpass time - e.g. ~10-11 am for Landsat.
Dots = what the satellite sees when it takes an image. Each frame is a different simulated overpass time - e.g. ~10-11 am for Landsat.
February 6, 2025 at 6:15 AM
An unintentionally hilarious bouncing plot, simulating how overpass time affects how well a hypothetical #EO satellite like Landsat can monitor the tide cycle! 🏀🛰️🌊
Dots = what the satellite sees when it takes an image. Each frame is a different simulated overpass time - e.g. ~10-11 am for Landsat.
Dots = what the satellite sees when it takes an image. Each frame is a different simulated overpass time - e.g. ~10-11 am for Landsat.
A shifting tapestry of fire scars and vegetation regrowth etched across the landscape in remote north-eastern Western Australia.🔥🛰️
(Mapped with 30 years of #DigitalEarthAU Landsat imagery)
(Mapped with 30 years of #DigitalEarthAU Landsat imagery)
January 31, 2025 at 3:16 AM
A shifting tapestry of fire scars and vegetation regrowth etched across the landscape in remote north-eastern Western Australia.🔥🛰️
(Mapped with 30 years of #DigitalEarthAU Landsat imagery)
(Mapped with 30 years of #DigitalEarthAU Landsat imagery)
Lake Machattie! It's pretty spectacular - here's a few years of @esa.int Sentinel-2 imagery from floods in 2021-23:
#DigitalEarthAU
#DigitalEarthAU
January 24, 2025 at 11:14 PM
Lake Machattie! It's pretty spectacular - here's a few years of @esa.int Sentinel-2 imagery from floods in 2021-23:
#DigitalEarthAU
#DigitalEarthAU
It's alive! 😱 In all seriousness, that one is probably my favourite: Drosera binata from eastern Australia which has incredible tentacled leaves...
January 23, 2025 at 9:29 PM
It's alive! 😱 In all seriousness, that one is probably my favourite: Drosera binata from eastern Australia which has incredible tentacled leaves...
I did a uni GIS course, but first really used it for an archeology project in Bulgaria: mapping soils and Bronze Age artefacts, and comparing our data against Soviet maps + spy satellite photography!
So a pretty exciting intro, which led me to follow up with a geospatial science PhD! #GISchat
So a pretty exciting intro, which led me to follow up with a geospatial science PhD! #GISchat


January 22, 2025 at 10:16 PM
I did a uni GIS course, but first really used it for an archeology project in Bulgaria: mapping soils and Bronze Age artefacts, and comparing our data against Soviet maps + spy satellite photography!
So a pretty exciting intro, which led me to follow up with a geospatial science PhD! #GISchat
So a pretty exciting intro, which led me to follow up with a geospatial science PhD! #GISchat
We just reported our carnivorous plants too! Looking a little worse for wear right now, but much more room to grow than the small IKEA vase we had them in earlier

January 21, 2025 at 12:48 AM
We just reported our carnivorous plants too! Looking a little worse for wear right now, but much more room to grow than the small IKEA vase we had them in earlier
Absolutely torrential rain at my family home north of Sydney: 84 mm / 3.3 inches in half an hour, and already beating our 35 year monthly rainfall record with half a month left to go!
This used to be our raised driveway...
This used to be our raised driveway...

January 16, 2025 at 10:17 PM
Absolutely torrential rain at my family home north of Sydney: 84 mm / 3.3 inches in half an hour, and already beating our 35 year monthly rainfall record with half a month left to go!
This used to be our raised driveway...
This used to be our raised driveway...
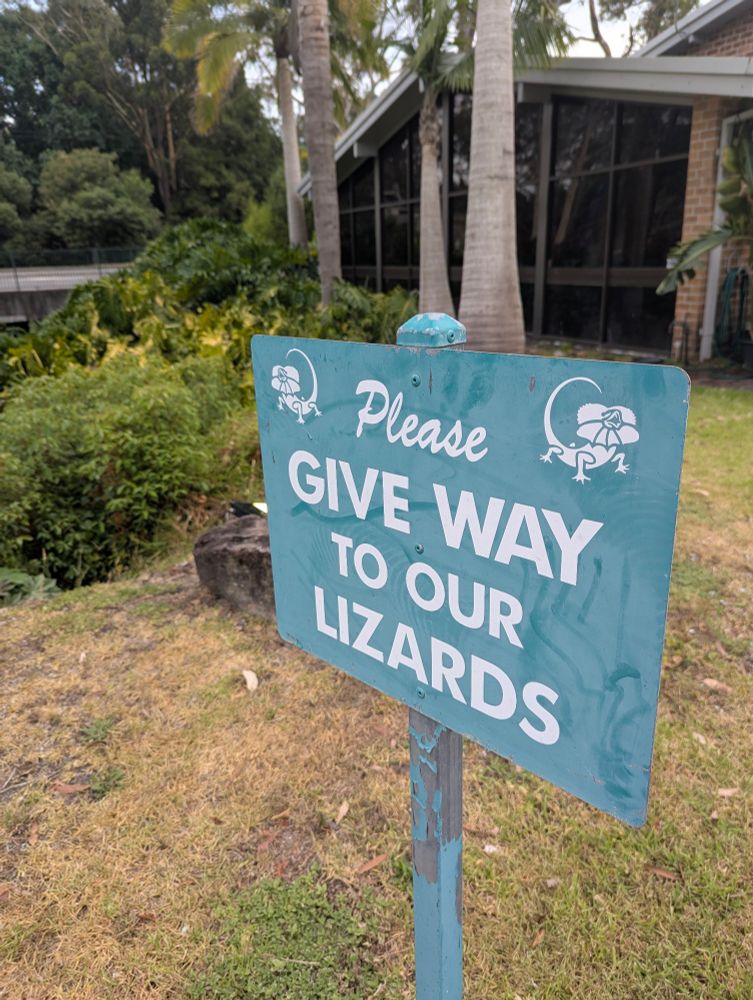
My kind of motel!
30+ lizards in the carpark, and even some on the very top of the two storey building! 😂🦎 #wildoz
(Eastern Water Dragon, Intellagama lesueurii)
30+ lizards in the carpark, and even some on the very top of the two storey building! 😂🦎 #wildoz
(Eastern Water Dragon, Intellagama lesueurii)


January 9, 2025 at 1:07 AM
My kind of motel!
30+ lizards in the carpark, and even some on the very top of the two storey building! 😂🦎 #wildoz
(Eastern Water Dragon, Intellagama lesueurii)
30+ lizards in the carpark, and even some on the very top of the two storey building! 😂🦎 #wildoz
(Eastern Water Dragon, Intellagama lesueurii)