


Evgenii Salganik
@salganik.bsky.social
ice researcher and architecture photographer
Alfred Wegener Institute @awi.de
Alfred Wegener Institute @awi.de
New nice preprint led by Dmitry Divine (@oceanseaicenpi.bsky.social) on #Arctic sea ice ridge volume in the Fram Strait, derived from moored sonar observations from 2012–2019: doi.org/10.5194/egus...

November 19, 2025 at 11:07 AM
New nice preprint led by Dmitry Divine (@oceanseaicenpi.bsky.social) on #Arctic sea ice ridge volume in the Fram Strait, derived from moored sonar observations from 2012–2019: doi.org/10.5194/egus...
A new thesis about the inclusion of air bubbles into the mushy layer model of sea ice by Joseph Fishlock from the University of Oxford @ox.ac.uk: ora.ox.ac.uk/objects/uuid...

September 29, 2025 at 9:41 AM
A new thesis about the inclusion of air bubbles into the mushy layer model of sea ice by Joseph Fishlock from the University of Oxford @ox.ac.uk: ora.ox.ac.uk/objects/uuid...
It also features exciting sea ice draft data from mooring observations in the northwestern Barents Sea (2018–2021):

June 28, 2025 at 12:12 PM
It also features exciting sea ice draft data from mooring observations in the northwestern Barents Sea (2018–2021):
The Nansen Legacy data paper also includes ice and snow thickness measurements from both on-ice and helicopter-borne electromagnetic surveys:

June 28, 2025 at 12:06 PM
The Nansen Legacy data paper also includes ice and snow thickness measurements from both on-ice and helicopter-borne electromagnetic surveys:
Sea ice density data from Nansen Legacy show seasonality and temperature dependence very similar to the MOSAiC observations we recently analyzed: doi.org/10.5194/tc-19-1259-2025

June 28, 2025 at 12:02 PM
Sea ice density data from Nansen Legacy show seasonality and temperature dependence very similar to the MOSAiC observations we recently analyzed: doi.org/10.5194/tc-19-1259-2025
Great to see a data paper from the Nansen Legacy cruises (2018–2022), led by Dmitry Divine (@oceanseaicenpi.bsky.social), including sea ice density measurements that clearly show strong seasonality: doi.org/10.1002/gdj3.70001

June 28, 2025 at 12:02 PM
Great to see a data paper from the Nansen Legacy cruises (2018–2022), led by Dmitry Divine (@oceanseaicenpi.bsky.social), including sea ice density measurements that clearly show strong seasonality: doi.org/10.1002/gdj3.70001
Sea ice density data from Nansen Legacy show seasonality and temperature dependence very similar to the MOSAiC observations we recently analyzed: doi.org/10.5194/tc-1...
June 28, 2025 at 12:00 PM
Sea ice density data from Nansen Legacy show seasonality and temperature dependence very similar to the MOSAiC observations we recently analyzed: doi.org/10.5194/tc-1...
An example of how data from ROV-based multibeam sonar was used to quantify ridge-enhanced melt rates can be found here: doi.org/10.5194/tc-1...

June 6, 2025 at 9:01 AM
An example of how data from ROV-based multibeam sonar was used to quantify ridge-enhanced melt rates can be found here: doi.org/10.5194/tc-1...
The study includes an overview of >80 surveys including measurements of ice draft from sonar, solar irradiance and radiance (see below), hyperspectral images, physical, chemical (pH, nitrate, oxygen), and bio-optical (fluorometry, ultra-violet and visible absorbance spectroscopy) water properties.

June 6, 2025 at 8:54 AM
The study includes an overview of >80 surveys including measurements of ice draft from sonar, solar irradiance and radiance (see below), hyperspectral images, physical, chemical (pH, nitrate, oxygen), and bio-optical (fluorometry, ultra-violet and visible absorbance spectroscopy) water properties.
Our new data paper about under-ice observations from a remotely operated vehicle (ROV) during MOSAiC led by Philipp Anhaus from @awi.de: www.nature.com/articles/s41...

June 6, 2025 at 8:49 AM
Our new data paper about under-ice observations from a remotely operated vehicle (ROV) during MOSAiC led by Philipp Anhaus from @awi.de: www.nature.com/articles/s41...
A new study led by Niels Fuchs uses hydrological models to predict the locations of melt ponds: doi.org/10.1029/2025GL115033

May 8, 2025 at 8:06 PM
A new study led by Niels Fuchs uses hydrological models to predict the locations of melt ponds: doi.org/10.1029/2025GL115033
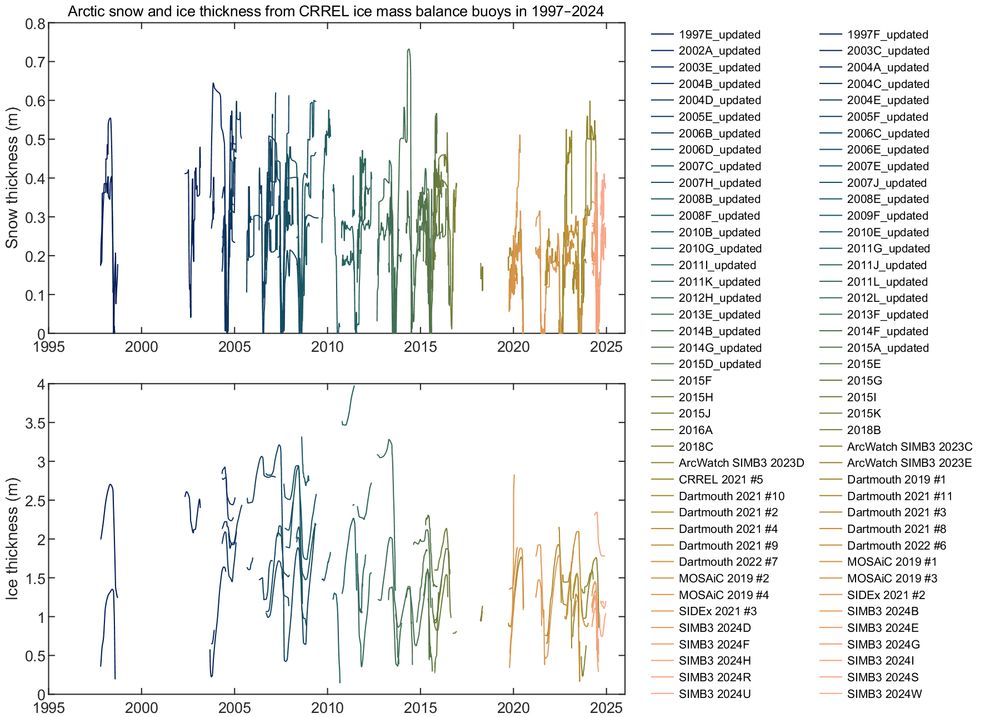
Ice Mass Balance (IMB) buoys are unique in their ability to distinguish between ice surface and bottom melt, which relates to the way solar energy is distributed. Models still do a poor job of capturing this. You can find the updated Wiki article here: en.wikipedia.org/wiki/Ice_mass_balance_buoy

March 29, 2025 at 10:16 AM
Ice Mass Balance (IMB) buoys are unique in their ability to distinguish between ice surface and bottom melt, which relates to the way solar energy is distributed. Models still do a poor job of capturing this. You can find the updated Wiki article here: en.wikipedia.org/wiki/Ice_mass_balance_buoy
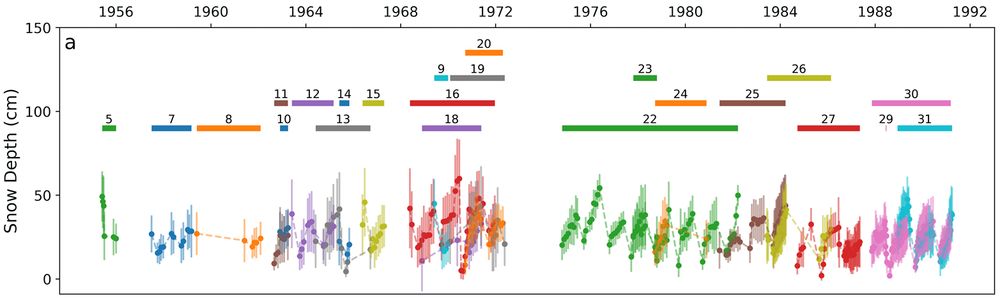
And if you are interested in longer observations of snow thickness from drifting stations in 1937–1991, I can recommend a wonderful PhD thesis by @robbiemallett.bsky.social: discovery.ucl.ac.uk/id/eprint/10161766
March 28, 2025 at 2:04 PM
And if you are interested in longer observations of snow thickness from drifting stations in 1937–1991, I can recommend a wonderful PhD thesis by @robbiemallett.bsky.social: discovery.ucl.ac.uk/id/eprint/10161766
And if you are working with the data from the MOSAiC expedition, here are an additional 24 Digital Thermistor Chain (DTC) datasets led by Mario Hoppmann from @awi.de and processed by me: doi.org/10.1594/PANGAEA.964023

March 28, 2025 at 8:47 AM
And if you are working with the data from the MOSAiC expedition, here are an additional 24 Digital Thermistor Chain (DTC) datasets led by Mario Hoppmann from @awi.de and processed by me: doi.org/10.1594/PANGAEA.964023
If you are into Arctic sea ice thermodynamics, here is our new dataset of 82 CRREL ice mass balance buoys deployed in 1997–2024 with estimates of snow and ice thickness and their interface evolution: doi.org/10.5281/zenodo.15096485
March 28, 2025 at 8:30 AM
If you are into Arctic sea ice thermodynamics, here is our new dataset of 82 CRREL ice mass balance buoys deployed in 1997–2024 with estimates of snow and ice thickness and their interface evolution: doi.org/10.5281/zenodo.15096485
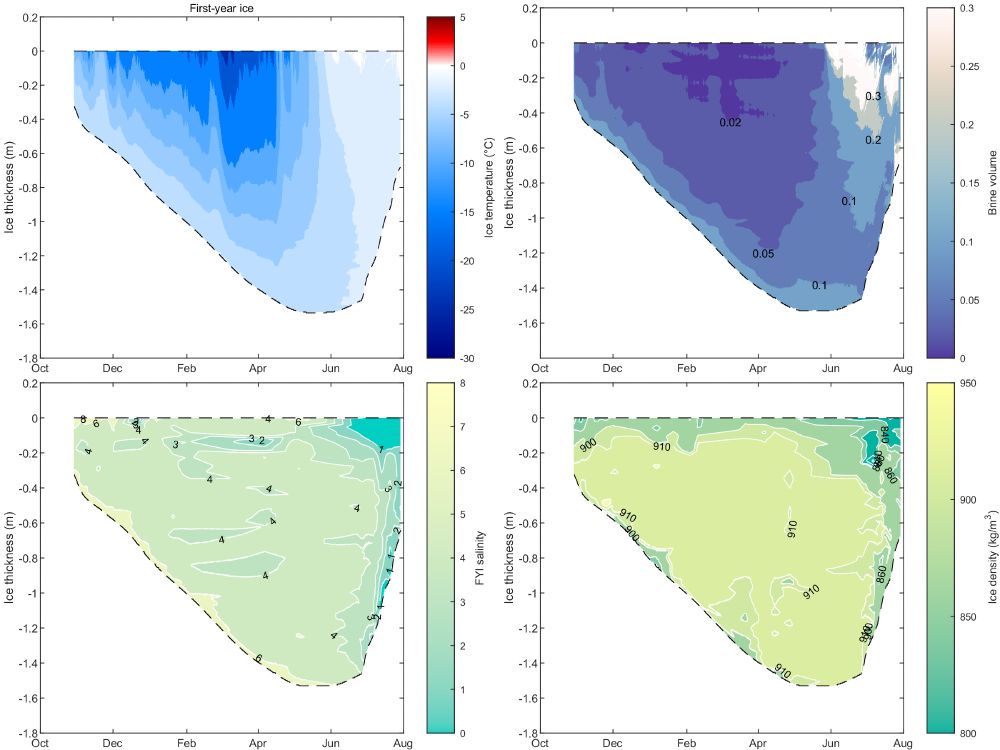
If you are into modeling of sea ice physical properties (salinity, brine volume, or density), we combined coring datasets to have a seasonal evolution for first- and second-year level ice: doi.org/10.5281/zeno...
The coring datasets have many more parameters, including isotopes and nutrients.
The coring datasets have many more parameters, including isotopes and nutrients.
March 21, 2025 at 10:47 AM
If you are into modeling of sea ice physical properties (salinity, brine volume, or density), we combined coring datasets to have a seasonal evolution for first- and second-year level ice: doi.org/10.5281/zeno...
The coring datasets have many more parameters, including isotopes and nutrients.
The coring datasets have many more parameters, including isotopes and nutrients.
Finally, I wanted to thank my co-authors Odile Crabeck @universitedeliege.bsky.social, Niels Fuchs @cenunihh.bsky.social, Nils Hutter @awi.de
@geomarkiel.bsky.social, Philipp Anhaus @dlr-spaceagency.bsky.social, and Jack Christopher Landy (UiT), and Norwegian Polar Institute, where I made the study
@geomarkiel.bsky.social, Philipp Anhaus @dlr-spaceagency.bsky.social, and Jack Christopher Landy (UiT), and Norwegian Polar Institute, where I made the study

March 18, 2025 at 10:48 AM
Finally, I wanted to thank my co-authors Odile Crabeck @universitedeliege.bsky.social, Niels Fuchs @cenunihh.bsky.social, Nils Hutter @awi.de
@geomarkiel.bsky.social, Philipp Anhaus @dlr-spaceagency.bsky.social, and Jack Christopher Landy (UiT), and Norwegian Polar Institute, where I made the study
@geomarkiel.bsky.social, Philipp Anhaus @dlr-spaceagency.bsky.social, and Jack Christopher Landy (UiT), and Norwegian Polar Institute, where I made the study
What about historical observations? We measure sea ice density since 1927 by Malmgren. Seasonal evolution is complicated due to differences in melt onset timing in the Arctic Ocean. But the same data looks much tidier when plotted against ice temperature, with MOSAiC values fitting previous values:

March 18, 2025 at 10:40 AM
What about historical observations? We measure sea ice density since 1927 by Malmgren. Seasonal evolution is complicated due to differences in melt onset timing in the Arctic Ocean. But the same data looks much tidier when plotted against ice temperature, with MOSAiC values fitting previous values:
The densities were similar from all used methods. This means that weighing is the most affordable and accurate way with minor errors from brine loss. Here we show that ice is typically not in hydrostatic balance on scales of 10 meters, which leads to artificially large spreads of density estimates:

March 18, 2025 at 10:33 AM
The densities were similar from all used methods. This means that weighing is the most affordable and accurate way with minor errors from brine loss. Here we show that ice is typically not in hydrostatic balance on scales of 10 meters, which leads to artificially large spreads of density estimates:
But why does ice get lighter upon warming? We linked the increase in air volume to two factors: (1) internal melt, which creates voids, enlarges bubbles, and nucleates new bubbles, and (2) the replacement of liquid brine by air in drained inclusions. Air occupies much more than 10% of brine:

March 18, 2025 at 10:26 AM
But why does ice get lighter upon warming? We linked the increase in air volume to two factors: (1) internal melt, which creates voids, enlarges bubbles, and nucleates new bubbles, and (2) the replacement of liquid brine by air in drained inclusions. Air occupies much more than 10% of brine:
When do these density changes happen? When it is getting warmer (d), its air volume fraction increases (h). The strongest changes were observed in first-year ice, but weaker effects were also observed in second-year ice and pressure ridges (g). So, after all, air bubbles matter even for altimetry:

March 18, 2025 at 10:14 AM
When do these density changes happen? When it is getting warmer (d), its air volume fraction increases (h). The strongest changes were observed in first-year ice, but weaker effects were also observed in second-year ice and pressure ridges (g). So, after all, air bubbles matter even for altimetry:
Colors matter too. Here are measurements of snow freeboard (fb) from an airborne laser scanner, snow thickness (sn) from transects, and ice draft (d) from underwater sonar with a colormap from @fabiocrameri.ch. Ice just doesn't want to go down.

March 18, 2025 at 10:08 AM
Colors matter too. Here are measurements of snow freeboard (fb) from an airborne laser scanner, snow thickness (sn) from transects, and ice draft (d) from underwater sonar with a colormap from @fabiocrameri.ch. Ice just doesn't want to go down.
Scale matters. We also observed a similar increasing ice freeboard at 1 km² CO2 ice floe and at 40 km² coverage of airborne laser scanner (ALS full) surveys. Ice type matters too, and a less pronounced effect was observed for ridges due to their three times faster melt.

March 18, 2025 at 10:03 AM
Scale matters. We also observed a similar increasing ice freeboard at 1 km² CO2 ice floe and at 40 km² coverage of airborne laser scanner (ALS full) surveys. Ice type matters too, and a less pronounced effect was observed for ridges due to their three times faster melt.
The snow and ice freeboard was measured by coring and by a combination of laser scanner snow freeboard and snow thickness from automatic probe surveys along the floe. The evolution of ice draft was measured by coring, by sonar on a remotely operated vehicle (ROV), and by temperature buoys (IMB):

March 18, 2025 at 9:55 AM
The snow and ice freeboard was measured by coring and by a combination of laser scanner snow freeboard and snow thickness from automatic probe surveys along the floe. The evolution of ice draft was measured by coring, by sonar on a remotely operated vehicle (ROV), and by temperature buoys (IMB):
The sampling was done in May–July 2020 in Fram Strait. Ice coring included weighing of ice cores. The freeboard of the whole ice floe was measured by laser scanner, while a smaller (purple) area also had draft measurements from underwater sonar. Ice floe included first- and second-year ice:

March 18, 2025 at 9:48 AM
The sampling was done in May–July 2020 in Fram Strait. Ice coring included weighing of ice cores. The freeboard of the whole ice floe was measured by laser scanner, while a smaller (purple) area also had draft measurements from underwater sonar. Ice floe included first- and second-year ice: