


Alex
@s3alfisc.bsky.social
Data Science, open source and economics. Currently working on fwildclusterboot and pyfixest.
https://github.com/s3alfisc
https://github.com/s3alfisc
Oh interesting, this does not look good. For me everything has been working well, I just upgraded to the newest fixest release via conda-forge a few weeks ago without any problems (as it happens, on windows!).
October 2, 2025 at 9:16 PM
Oh interesting, this does not look good. For me everything has been working well, I just upgraded to the newest fixest release via conda-forge a few weeks ago without any problems (as it happens, on windows!).
No global R or Python installation needed! And if you have these, no interference with your global installations.
Big fan. pixi.sh/latest/
Big fan. pixi.sh/latest/
October 2, 2025 at 8:47 PM
No global R or Python installation needed! And if you have these, no interference with your global installations.
Big fan. pixi.sh/latest/
Big fan. pixi.sh/latest/
Next step is to rewrite the vignette (more to the point & I need to make a better case for the methods usefulness in business contexts).
August 16, 2025 at 8:37 AM
Next step is to rewrite the vignette (more to the point & I need to make a better case for the methods usefulness in business contexts).
Also works with "negative" effects:
August 16, 2025 at 8:35 AM
Also works with "negative" effects:
In contrast to uv, it is cross-language and also allows to pin down non-python dependencies in the same env (R, Julia, etc). And it also has nice "pixi run command" options (you can even define tasks as in justfiles, which I personally use a lot). pixi.sh/latest/
August 15, 2025 at 9:38 PM
In contrast to uv, it is cross-language and also allows to pin down non-python dependencies in the same env (R, Julia, etc). And it also has nice "pixi run command" options (you can even define tasks as in justfiles, which I personally use a lot). pixi.sh/latest/
For pyfixest's development, we've been using pixi for a while, which I really enjoy. More or less it is the conda-forge (free & open source) equivalent to uv (it actually runs uv for PyPi dependency resolution). Really fast both for PyPi & conda-forge dependency resolution.
August 15, 2025 at 9:38 PM
For pyfixest's development, we've been using pixi for a while, which I really enjoy. More or less it is the conda-forge (free & open source) equivalent to uv (it actually runs uv for PyPi dependency resolution). Really fast both for PyPi & conda-forge dependency resolution.
This I will still have to explore (as matplotlib does not always auto-scale). Generally there are two options to handle this as of now - users can keep / drop covariates via a function arg, or simply combine many of them into a single "combined" covariate in the estimation process.
August 13, 2025 at 6:50 AM
This I will still have to explore (as matplotlib does not always auto-scale). Generally there are two options to handle this as of now - users can keep / drop covariates via a function arg, or simply combine many of them into a single "combined" covariate in the estimation process.
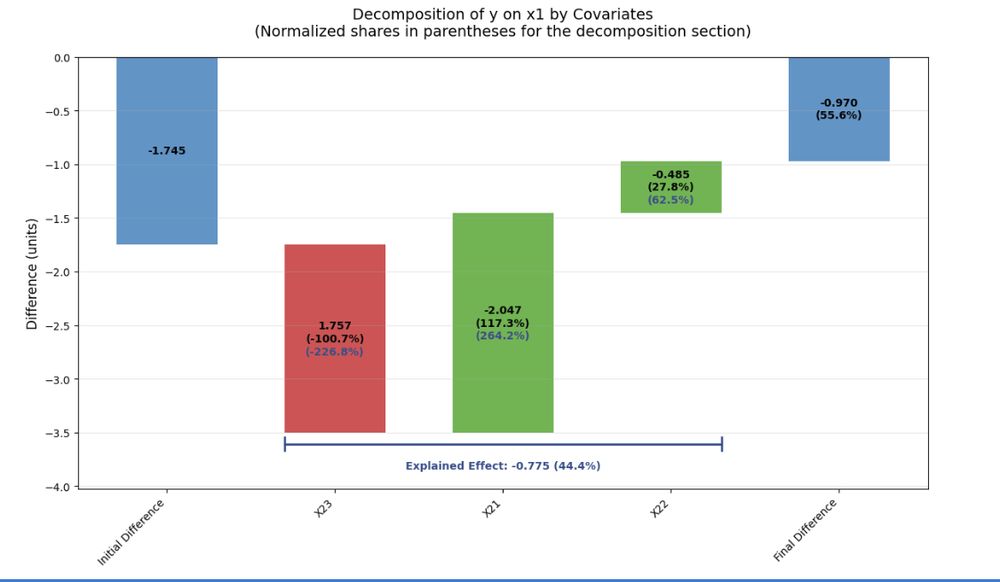
Yes, negative contributions should be handled and would be colored red and should add to the "initial difference" bar
August 13, 2025 at 6:48 AM
Yes, negative contributions should be handled and would be colored red and should add to the "initial difference" bar
My attempt - how to tell you I work in industry without telling you ;) what do you think?

August 12, 2025 at 9:41 PM
My attempt - how to tell you I work in industry without telling you ;) what do you think?
For the ladder I'll make sure that all defaults can be easily changed.
July 31, 2025 at 6:48 PM
For the ladder I'll make sure that all defaults can be easily changed.
I agree - optimally I am looking for default labels that make it immediately clear to the econometricians what is being shown (this is the status quo) but that also allows non-technical stake holder to easily understand the substantive message.
July 31, 2025 at 6:48 PM
I agree - optimally I am looking for default labels that make it immediately clear to the econometricians what is being shown (this is the status quo) but that also allows non-technical stake holder to easily understand the substantive message.
Thanks - I actually control for x21 in the short regression ... will have to think about a good naming convention for this case.
July 31, 2025 at 6:44 PM
Thanks - I actually control for x21 in the short regression ... will have to think about a good naming convention for this case.
Yes this makes a lot of sense. Had also wondered if anyone had seen any great visualizations. Am sold that we should add a plot method. Thanks!
July 31, 2025 at 6:42 PM
Yes this makes a lot of sense. Had also wondered if anyone had seen any great visualizations. Am sold that we should add a plot method. Thanks!
cc @gelbach.bsky.social , and also @nickchk.com, whose blog post (nickchk.substack.com/p/decomposit...) convinced me of the value of decomp methods in industry - maybe you have some tips on effective communication?
July 30, 2025 at 8:38 PM
cc @gelbach.bsky.social , and also @nickchk.com, whose blog post (nickchk.substack.com/p/decomposit...) convinced me of the value of decomp methods in industry - maybe you have some tips on effective communication?
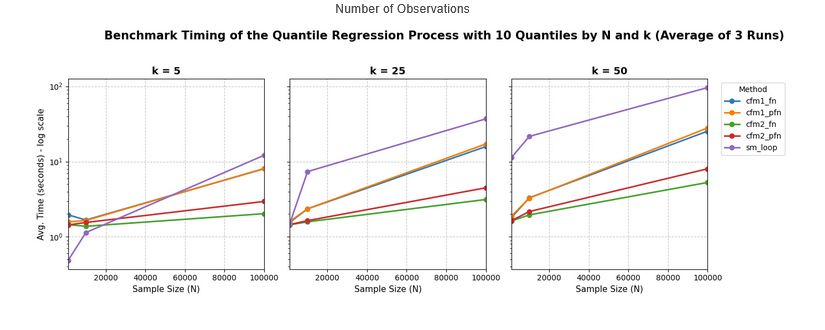
Re fast routines for the quantile regression process - we follow Chernozhukov et al (2019) and their algo's are quite an improvement over "naive" for loops over quantiles:
July 6, 2025 at 10:54 AM
Re fast routines for the quantile regression process - we follow Chernozhukov et al (2019) and their algo's are quite an improvement over "naive" for loops over quantiles:
This release has had 8 new contributors (none of which I think are around here) - thanks all for your help!
July 6, 2025 at 10:26 AM
This release has had 8 new contributors (none of which I think are around here) - thanks all for your help!
You can find the full changelog here: py-econometrics.github.io/pyfixest/cha...
July 6, 2025 at 10:26 AM
You can find the full changelog here: py-econometrics.github.io/pyfixest/cha...
Second, we have added support for 𝐪𝐮𝐚𝐧𝐭𝐢𝐥𝐞 𝐫𝐞𝐠𝐫𝐞𝐬𝐬𝐢𝐨𝐧 based on a Frisch-Newton Solver, including iid, heteroskedastic, and cluster robust standard errors, as well as fast routines for fitting the entire quantile regression process.
July 6, 2025 at 10:26 AM
Second, we have added support for 𝐪𝐮𝐚𝐧𝐭𝐢𝐥𝐞 𝐫𝐞𝐠𝐫𝐞𝐬𝐬𝐢𝐨𝐧 based on a Frisch-Newton Solver, including iid, heteroskedastic, and cluster robust standard errors, as well as fast routines for fitting the entire quantile regression process.