


Stefan Reifenberg
@reyfenberg.bsky.social
Information Designer / Creative Developer / Freelancer / 3D & Geo enjoyer / stefanreifenberg.com / kaldera.dev
Gave geo-projections.com a long overdue refresh
Tooltips showing area distortion
Tissot circles for visualization
City search & map dragging
Dark/Light mode
Many more fixes
Originally built it in 2021 while learning #d3js
#cartography #gischat #maps #cartography #qgis #gis
Tooltips showing area distortion
Tissot circles for visualization
City search & map dragging
Dark/Light mode
Many more fixes
Originally built it in 2021 while learning #d3js
#cartography #gischat #maps #cartography #qgis #gis
November 10, 2025 at 12:31 PM
Gave geo-projections.com a long overdue refresh
Tooltips showing area distortion
Tissot circles for visualization
City search & map dragging
Dark/Light mode
Many more fixes
Originally built it in 2021 while learning #d3js
#cartography #gischat #maps #cartography #qgis #gis
Tooltips showing area distortion
Tissot circles for visualization
City search & map dragging
Dark/Light mode
Many more fixes
Originally built it in 2021 while learning #d3js
#cartography #gischat #maps #cartography #qgis #gis
Just wrapped up my interactive fitness visualization with Svelte 5 and D3.js. Feeling fit and creative! 🏋️📊
fitness-viz-ov5k.vercel.app
#Svelte #D3js #FitnessViz #CreativeCoding #threejs #threejsJourney #DataVisualization
fitness-viz-ov5k.vercel.app
#Svelte #D3js #FitnessViz #CreativeCoding #threejs #threejsJourney #DataVisualization
March 17, 2025 at 11:51 AM
Just wrapped up my interactive fitness visualization with Svelte 5 and D3.js. Feeling fit and creative! 🏋️📊
fitness-viz-ov5k.vercel.app
#Svelte #D3js #FitnessViz #CreativeCoding #threejs #threejsJourney #DataVisualization
fitness-viz-ov5k.vercel.app
#Svelte #D3js #FitnessViz #CreativeCoding #threejs #threejsJourney #DataVisualization
My 2024 fitness #datavisualization is taking more and more shape :)
Great way to learn the new #svelte 5 runes and combining it with #d3.js.
Great way to learn the new #svelte 5 runes and combining it with #d3.js.

March 3, 2025 at 7:25 PM
My 2024 fitness #datavisualization is taking more and more shape :)
Great way to learn the new #svelte 5 runes and combining it with #d3.js.
Great way to learn the new #svelte 5 runes and combining it with #d3.js.
I am working on a #datavisualization to better understand my fitness trends over the past year, combining gym visit logs and Apple Health data.
Sneak peek to the hero section done with #svelte and the freshly released #threlte v8.
#D3js #FitnessAnalytics #WebDevelopment #CreativeCoding #threejs
Sneak peek to the hero section done with #svelte and the freshly released #threlte v8.
#D3js #FitnessAnalytics #WebDevelopment #CreativeCoding #threejs
February 12, 2025 at 7:33 PM
I am working on a #datavisualization to better understand my fitness trends over the past year, combining gym visit logs and Apple Health data.
Sneak peek to the hero section done with #svelte and the freshly released #threlte v8.
#D3js #FitnessAnalytics #WebDevelopment #CreativeCoding #threejs
Sneak peek to the hero section done with #svelte and the freshly released #threlte v8.
#D3js #FitnessAnalytics #WebDevelopment #CreativeCoding #threejs
Created a new REM map of the Neches River, Texas! 🌊🎨
This one was tricky—huge data size caused endless crashes in QGIS and Blender, but the result looks like a painting! Lidar data from the USGS Explorer.
#GIS #Blender3D #DataViz #NechesRiver #Mapping #Geospatial
This one was tricky—huge data size caused endless crashes in QGIS and Blender, but the result looks like a painting! Lidar data from the USGS Explorer.
#GIS #Blender3D #DataViz #NechesRiver #Mapping #Geospatial

February 6, 2025 at 12:02 PM
Created a new REM map of the Neches River, Texas! 🌊🎨
This one was tricky—huge data size caused endless crashes in QGIS and Blender, but the result looks like a painting! Lidar data from the USGS Explorer.
#GIS #Blender3D #DataViz #NechesRiver #Mapping #Geospatial
This one was tricky—huge data size caused endless crashes in QGIS and Blender, but the result looks like a painting! Lidar data from the USGS Explorer.
#GIS #Blender3D #DataViz #NechesRiver #Mapping #Geospatial
Created this REM of the Snake River meanders! 🐍🌊
Processed with QGIS, rendered in Blender using lidar data from the USGS Explorer. Inspired by the amazing @milos-makes-maps.bsky.social!
#GIS #DataViz #Blender3D #SnakeRiver #Mapping #Geospatial
Processed with QGIS, rendered in Blender using lidar data from the USGS Explorer. Inspired by the amazing @milos-makes-maps.bsky.social!
#GIS #DataViz #Blender3D #SnakeRiver #Mapping #Geospatial

January 30, 2025 at 5:22 PM
Created this REM of the Snake River meanders! 🐍🌊
Processed with QGIS, rendered in Blender using lidar data from the USGS Explorer. Inspired by the amazing @milos-makes-maps.bsky.social!
#GIS #DataViz #Blender3D #SnakeRiver #Mapping #Geospatial
Processed with QGIS, rendered in Blender using lidar data from the USGS Explorer. Inspired by the amazing @milos-makes-maps.bsky.social!
#GIS #DataViz #Blender3D #SnakeRiver #Mapping #Geospatial
Made this 3D map of Gottenheim, my home village in southern Germany! 🏡✨
Rendered in Blender using data from OpenStreetMap. Love blending technology and creativity to visualize local places!
#Blender3D #GIS #Mapping #DataViz #Cartography
Rendered in Blender using data from OpenStreetMap. Love blending technology and creativity to visualize local places!
#Blender3D #GIS #Mapping #DataViz #Cartography

January 26, 2025 at 9:56 AM
Made this 3D map of Gottenheim, my home village in southern Germany! 🏡✨
Rendered in Blender using data from OpenStreetMap. Love blending technology and creativity to visualize local places!
#Blender3D #GIS #Mapping #DataViz #Cartography
Rendered in Blender using data from OpenStreetMap. Love blending technology and creativity to visualize local places!
#Blender3D #GIS #Mapping #DataViz #Cartography
Hey @joewdavies.bsky.social i found a small bug in your observable notebook regarding the water. I checked my birthplace and there is a giant body of water going through it.
Coords are: 49.75 / 6.64
Here is my fork:
observablehq.com/d/97f1d7aba4...
Coords are: 49.75 / 6.64
Here is my fork:
observablehq.com/d/97f1d7aba4...

January 23, 2025 at 7:04 PM
Hey @joewdavies.bsky.social i found a small bug in your observable notebook regarding the water. I checked my birthplace and there is a giant body of water going through it.
Coords are: 49.75 / 6.64
Here is my fork:
observablehq.com/d/97f1d7aba4...
Coords are: 49.75 / 6.64
Here is my fork:
observablehq.com/d/97f1d7aba4...
Reposted by Stefan Reifenberg
Threlte 8 is Here! 🤗
Six months in the making, Threlte 8 redefines performance, flexibility, and developer experience for 3D web graphics using Svelte. It’s our biggest leap yet, powered by Svelte 5, exciting updates from Three.js, and tons of community input.
1/9
Six months in the making, Threlte 8 redefines performance, flexibility, and developer experience for 3D web graphics using Svelte. It’s our biggest leap yet, powered by Svelte 5, exciting updates from Three.js, and tons of community input.
1/9
January 21, 2025 at 6:05 PM
Threlte 8 is Here! 🤗
Six months in the making, Threlte 8 redefines performance, flexibility, and developer experience for 3D web graphics using Svelte. It’s our biggest leap yet, powered by Svelte 5, exciting updates from Three.js, and tons of community input.
1/9
Six months in the making, Threlte 8 redefines performance, flexibility, and developer experience for 3D web graphics using Svelte. It’s our biggest leap yet, powered by Svelte 5, exciting updates from Three.js, and tons of community input.
1/9
Meanders are nature’s art, reshaping entire landscapes. 🌊✨
This REM of the Humboldt River was made using lidar data from the USGS, processed in QGIS, and rendered in Blender.
#GIS #Blender3D #LidarData #HumboldtRiver #DataViz #Map #Mapping
This REM of the Humboldt River was made using lidar data from the USGS, processed in QGIS, and rendered in Blender.
#GIS #Blender3D #LidarData #HumboldtRiver #DataViz #Map #Mapping

January 20, 2025 at 7:50 AM
Meanders are nature’s art, reshaping entire landscapes. 🌊✨
This REM of the Humboldt River was made using lidar data from the USGS, processed in QGIS, and rendered in Blender.
#GIS #Blender3D #LidarData #HumboldtRiver #DataViz #Map #Mapping
This REM of the Humboldt River was made using lidar data from the USGS, processed in QGIS, and rendered in Blender.
#GIS #Blender3D #LidarData #HumboldtRiver #DataViz #Map #Mapping
Hey @joewdavies.bsky.social thanks for sharing your observable notebook.
I created this map of my hometown #freiburg
#3DMapping #Blender3D #DataVisualization #GIS #Freiburg #DigitalArt #CreativeCoding #UrbanDesign #MappingArt
I created this map of my hometown #freiburg
#3DMapping #Blender3D #DataVisualization #GIS #Freiburg #DigitalArt #CreativeCoding #UrbanDesign #MappingArt

January 16, 2025 at 5:01 PM
Hey @joewdavies.bsky.social thanks for sharing your observable notebook.
I created this map of my hometown #freiburg
#3DMapping #Blender3D #DataVisualization #GIS #Freiburg #DigitalArt #CreativeCoding #UrbanDesign #MappingArt
I created this map of my hometown #freiburg
#3DMapping #Blender3D #DataVisualization #GIS #Freiburg #DigitalArt #CreativeCoding #UrbanDesign #MappingArt
Just finished this 3D map of the Black Forest! 🌲
Created using QGIS for data processing and Blender for rendering. Loving the blend of data and design!
#QGIS #Blender3D #DataViz #GIS #Mapping #BlackForest #DigitalArt #Map
Created using QGIS for data processing and Blender for rendering. Loving the blend of data and design!
#QGIS #Blender3D #DataViz #GIS #Mapping #BlackForest #DigitalArt #Map

January 13, 2025 at 6:59 PM
Just finished this 3D map of the Black Forest! 🌲
Created using QGIS for data processing and Blender for rendering. Loving the blend of data and design!
#QGIS #Blender3D #DataViz #GIS #Mapping #BlackForest #DigitalArt #Map
Created using QGIS for data processing and Blender for rendering. Loving the blend of data and design!
#QGIS #Blender3D #DataViz #GIS #Mapping #BlackForest #DigitalArt #Map
Inspired by the incredible work of Florent Lavergne, I created my own version of his “Home” map! 🌍
Processed raster data in QGIS, rendered with Blender, and added final touches in Lightroom.
Loving the blend of data + art!
#DataViz #GIS #Blender #Mapping #DigitalArt
Processed raster data in QGIS, rendered with Blender, and added final touches in Lightroom.
Loving the blend of data + art!
#DataViz #GIS #Blender #Mapping #DigitalArt

January 4, 2025 at 11:22 AM
Inspired by the incredible work of Florent Lavergne, I created my own version of his “Home” map! 🌍
Processed raster data in QGIS, rendered with Blender, and added final touches in Lightroom.
Loving the blend of data + art!
#DataViz #GIS #Blender #Mapping #DigitalArt
Processed raster data in QGIS, rendered with Blender, and added final touches in Lightroom.
Loving the blend of data + art!
#DataViz #GIS #Blender #Mapping #DigitalArt
#dataisbeautiful Traffic noise pollution in Freiburg im Breisgau, Germany. #maps #dataviz
Made with #QGIS and #Blender
Made with #QGIS and #Blender


December 29, 2024 at 4:38 PM
#dataisbeautiful Traffic noise pollution in Freiburg im Breisgau, Germany. #maps #dataviz
Made with #QGIS and #Blender
Made with #QGIS and #Blender
My #dataviz of Freiburg’s 2012 road noise mapping shows Brühl as the noisiest district, while Herdern takes the crown for tranquility. #gischat #mapping #threejs #webgl @sveltesociety.dev
Interactive app: lnkd.in/ewdM5_Km
Data source: lnkd.in/egqhTFQB
Tools: #Qgis, #blender, @svelte.dev
Interactive app: lnkd.in/ewdM5_Km
Data source: lnkd.in/egqhTFQB
Tools: #Qgis, #blender, @svelte.dev


December 1, 2024 at 12:00 PM
My #dataviz of Freiburg’s 2012 road noise mapping shows Brühl as the noisiest district, while Herdern takes the crown for tranquility. #gischat #mapping #threejs #webgl @sveltesociety.dev
Interactive app: lnkd.in/ewdM5_Km
Data source: lnkd.in/egqhTFQB
Tools: #Qgis, #blender, @svelte.dev
Interactive app: lnkd.in/ewdM5_Km
Data source: lnkd.in/egqhTFQB
Tools: #Qgis, #blender, @svelte.dev
Officially back on the grind after being sick af for two weeks 💪

November 24, 2024 at 3:36 PM
Officially back on the grind after being sick af for two weeks 💪
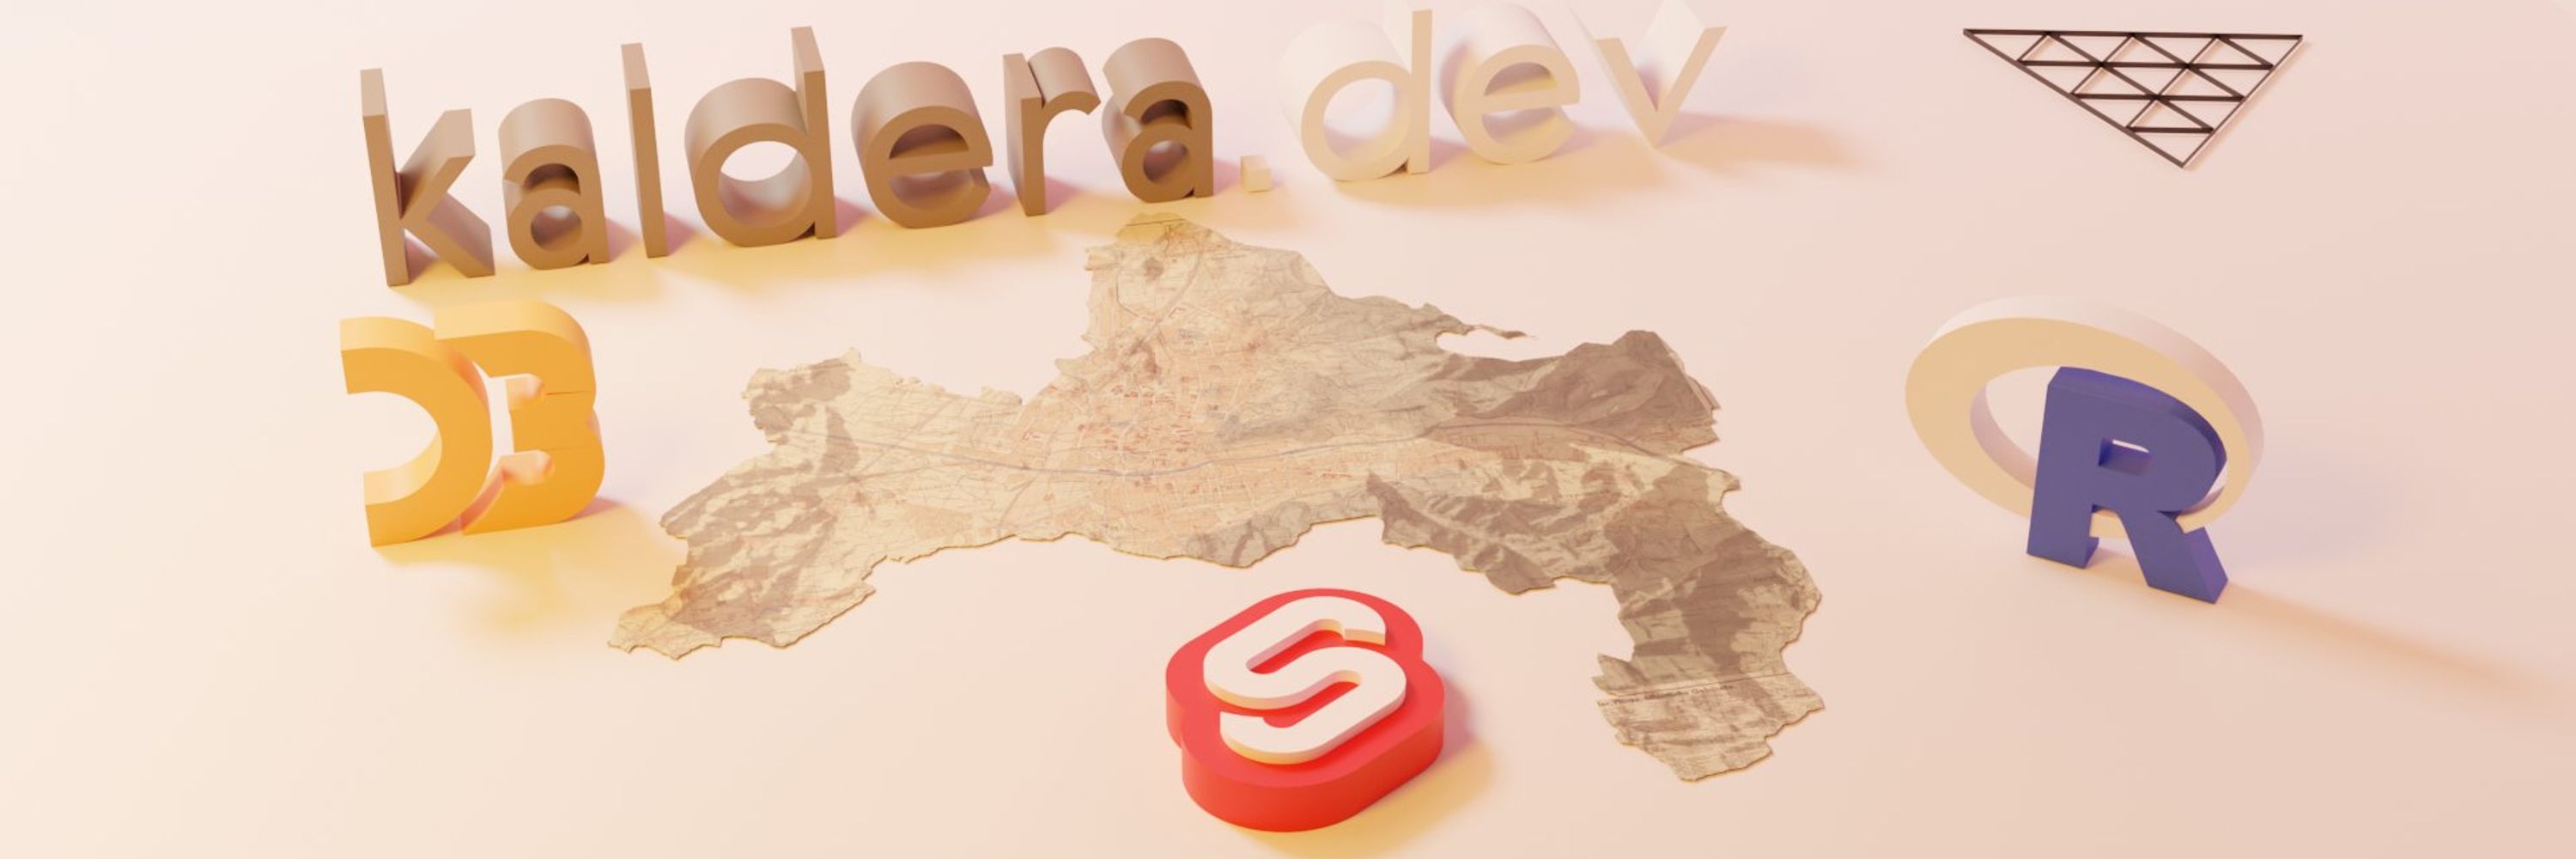
Started collecting all my #threejs projects i did over the last couple of years. Some of them are finished, some not, lots of experimental stuff & projects from tutorials. Still a lot is missing, will update over time.
Featuring @threlte.xyz and #R3F.
threejs-project-collection.vercel.app
Featuring @threlte.xyz and #R3F.
threejs-project-collection.vercel.app

Over the years I have created lots of Three.js projects. Some are "finished" and some are just experiments or prototypes. Have fun exploring them!
threejs-project-collection.vercel.app
November 22, 2024 at 7:06 AM
Started collecting all my #threejs projects i did over the last couple of years. Some of them are finished, some not, lots of experimental stuff & projects from tutorials. Still a lot is missing, will update over time.
Featuring @threlte.xyz and #R3F.
threejs-project-collection.vercel.app
Featuring @threlte.xyz and #R3F.
threejs-project-collection.vercel.app

New #dataviz exploring traffic noise pollution in #Freiburg
Made with @svelte.dev #threejs
Data from open data freiburg
Link: freiburg-noise.vercel.app
Made with @svelte.dev #threejs
Data from open data freiburg
Link: freiburg-noise.vercel.app

May 21, 2024 at 3:54 PM
New #dataviz exploring traffic noise pollution in #Freiburg
Made with @svelte.dev #threejs
Data from open data freiburg
Link: freiburg-noise.vercel.app
Made with @svelte.dev #threejs
Data from open data freiburg
Link: freiburg-noise.vercel.app