


Red Blob Games
@redblobgames.com
Hi! I'm Amit Patel. I explain algorithms and math with interactive web pages (incl. pathfinding, hexagons, procgen maps, voronoi). Wrote Solar Realms Elite; helped w/Barren Realms Elite and Realm of the Mad God. https://www.redblobgames.com/
Side project blog post—from 2010 to 2024,
RotMG.com had used maps from my mapgen2 project. There are 2^33 possible maps. I didn't know which seeds they used. I figured … let me just try them all … how hard could it be? ;----)
Spoiler: found some! not all. www.redblobgames.com/blog/2025-11...
RotMG.com had used maps from my mapgen2 project. There are 2^33 possible maps. I didn't know which seeds they used. I figured … let me just try them all … how hard could it be? ;----)
Spoiler: found some! not all. www.redblobgames.com/blog/2025-11...


November 12, 2025 at 12:45 AM
Side project blog post—from 2010 to 2024,
RotMG.com had used maps from my mapgen2 project. There are 2^33 possible maps. I didn't know which seeds they used. I figured … let me just try them all … how hard could it be? ;----)
Spoiler: found some! not all. www.redblobgames.com/blog/2025-11...
RotMG.com had used maps from my mapgen2 project. There are 2^33 possible maps. I didn't know which seeds they used. I figured … let me just try them all … how hard could it be? ;----)
Spoiler: found some! not all. www.redblobgames.com/blog/2025-11...
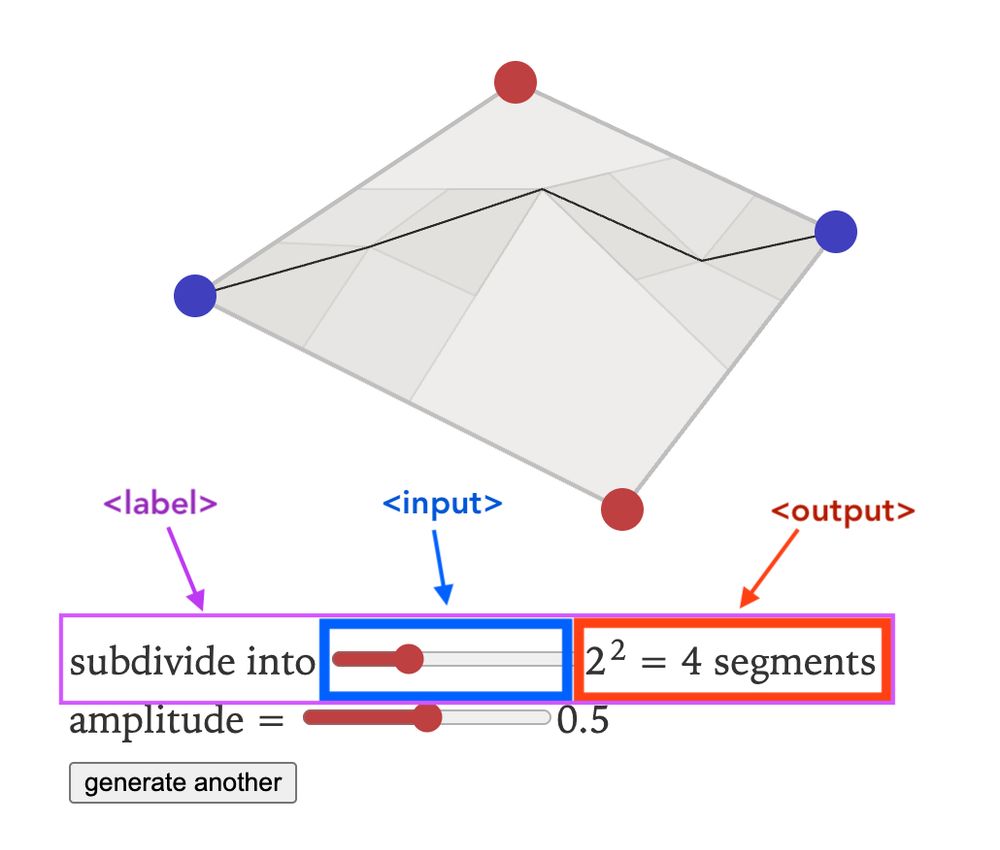
Yeah! I like <output> but don't use it fully, and haven't done enough for screen readers. I've mostly used this to display the result of <input> elements, like this:
October 11, 2025 at 3:17 PM
Yeah! I like <output> but don't use it fully, and haven't done enough for screen readers. I've mostly used this to display the result of <input> elements, like this:
I've been fixing numerical precision issues in #mapgen4 but some of those issues led to interesting textures that I liked.
(It may be hard to see them on the screenshots)
I'd like to have interesting textures that are intentional instead of the result of a bug …
(It may be hard to see them on the screenshots)
I'd like to have interesting textures that are intentional instead of the result of a bug …


October 5, 2025 at 1:19 AM
I've been fixing numerical precision issues in #mapgen4 but some of those issues led to interesting textures that I liked.
(It may be hard to see them on the screenshots)
I'd like to have interesting textures that are intentional instead of the result of a bug …
(It may be hard to see them on the screenshots)
I'd like to have interesting textures that are intentional instead of the result of a bug …
New blog post: rewriting the mapgen4 river render www.redblobgames.com/blog/2025-09...
I had been drawing river segments on the cpu to a texture, and then reading that texture on the gpu. I changed it to draw river segments on the gpu directly.
I had been drawing river segments on the cpu to a texture, and then reading that texture on the gpu. I changed it to draw river segments on the gpu directly.


October 3, 2025 at 8:10 PM
New blog post: rewriting the mapgen4 river render www.redblobgames.com/blog/2025-09...
I had been drawing river segments on the cpu to a texture, and then reading that texture on the gpu. I changed it to draw river segments on the gpu directly.
I had been drawing river segments on the cpu to a texture, and then reading that texture on the gpu. I changed it to draw river segments on the gpu directly.
I'm outputting to a WebGL R16F texture in mapgen4. It has a float channel, so I thought … I can set my frag shader to write to "out float" instead of "out vec4". But nope! :) I will change it back to "out vec4" and output three dummy values, which get thrown away.
(I'm learning WebGL2 this week)
(I'm learning WebGL2 this week)

October 3, 2025 at 8:07 PM
I'm outputting to a WebGL R16F texture in mapgen4. It has a float channel, so I thought … I can set my frag shader to write to "out float" instead of "out vec4". But nope! :) I will change it back to "out vec4" and output three dummy values, which get thrown away.
(I'm learning WebGL2 this week)
(I'm learning WebGL2 this week)
New blog post: after a long break, I'm upgrading some of mapgen4's code (features, performance, bugs, ui, etc.) www.redblobgames.com/blog/2025-09...

October 1, 2025 at 5:33 PM
New blog post: after a long break, I'm upgrading some of mapgen4's code (features, performance, bugs, ui, etc.) www.redblobgames.com/blog/2025-09...
Weekend project: writing a simple search engine. Part 2 is about document ranking: www.redblobgames.com/blog/2025-08...

September 1, 2025 at 10:30 PM
Weekend project: writing a simple search engine. Part 2 is about document ranking: www.redblobgames.com/blog/2025-08...
Failed experiment in tectonic plate collision. I was trying to do something quick&easy but it didn't work as well as I had hoped. www.redblobgames.com/x/2319-mapge...
If none of my experiments fail, I'm not being ambitious enough. So I'm ok with having many failures. This was a fun experiment.
If none of my experiments fail, I'm not being ambitious enough. So I'm ok with having many failures. This was a fun experiment.
June 22, 2025 at 6:18 PM
Failed experiment in tectonic plate collision. I was trying to do something quick&easy but it didn't work as well as I had hoped. www.redblobgames.com/x/2319-mapge...
If none of my experiments fail, I'm not being ambitious enough. So I'm ok with having many failures. This was a fun experiment.
If none of my experiments fail, I'm not being ambitious enough. So I'm ok with having many failures. This was a fun experiment.
This models where every drop of rain would flow after it falls to the ground. Most of it flows underground in the soil, so I don't want to actually draw those rivers. I only draw the ones above a certain threshold.
I use a triangle mesh, so the triangles can have flow like this:
I use a triangle mesh, so the triangles can have flow like this:

June 12, 2025 at 3:14 PM
This models where every drop of rain would flow after it falls to the ground. Most of it flows underground in the soil, so I don't want to actually draw those rivers. I only draw the ones above a certain threshold.
I use a triangle mesh, so the triangles can have flow like this:
I use a triangle mesh, so the triangles can have flow like this:
Overall: I simulate evaporation from oceans, humidity, wind, rainfall including orographic (en.wikipedia.org/wiki/Orograp...), then calculate flow rate at *every* point on the map:

June 12, 2025 at 3:12 PM
Overall: I simulate evaporation from oceans, humidity, wind, rainfall including orographic (en.wikipedia.org/wiki/Orograp...), then calculate flow rate at *every* point on the map:
Agreed — I want to tweak the curvature based on the inner corner's angle. Larger angles need the curve to be curvier, I think.

June 11, 2025 at 9:58 PM
Agreed — I want to tweak the curvature based on the inner corner's angle. Larger angles need the curve to be curvier, I think.
The new river renderer is sharper (using a shader instead of a texture). Another example for comparison:


June 11, 2025 at 3:54 PM
The new river renderer is sharper (using a shader instead of a texture). Another example for comparison:
While reviewing my mapgen4 rendering code, I realized I could render rivers in a much simpler way. The output isn't quite the same though. Left: old, right: new.


June 11, 2025 at 3:47 PM
While reviewing my mapgen4 rendering code, I realized I could render rivers in a much simpler way. The output isn't quite the same though. Left: old, right: new.
It looks really weird! but it matched the "hand drawn" style I wanted. The mountains always point up as you rotate.
June 6, 2025 at 6:20 PM
It looks really weird! but it matched the "hand drawn" style I wanted. The mountains always point up as you rotate.
While reviewing my mapgen4 rendering code, I realized I was using 'nearest' filtering for the biome colors. What happens if I use 'linear'?
(a) I get some river valleys shaded in, even where rivers have dried out
(b) I get smoother colors in the oceans
(added it to a list of future investigations)
(a) I get some river valleys shaded in, even where rivers have dried out
(b) I get smoother colors in the oceans
(added it to a list of future investigations)

June 6, 2025 at 3:28 AM
While reviewing my mapgen4 rendering code, I realized I was using 'nearest' filtering for the biome colors. What happens if I use 'linear'?
(a) I get some river valleys shaded in, even where rivers have dried out
(b) I get smoother colors in the oceans
(added it to a list of future investigations)
(a) I get some river valleys shaded in, even where rivers have dried out
(b) I get smoother colors in the oceans
(added it to a list of future investigations)
Looks cool when animated. Maybe useful as a very cheap approximation to erosion.
June 5, 2025 at 3:08 PM
Looks cool when animated. Maybe useful as a very cheap approximation to erosion.
While reviewing my mapgen4 geometry code, I noticed a parameter that I had hard-coded instead of exposing through sliders. I took screenshots of it at 1.00, 0.95, 0.90, 0.85, and added it to the todo list.


June 5, 2025 at 3:02 PM
While reviewing my mapgen4 geometry code, I noticed a parameter that I had hard-coded instead of exposing through sliders. I took screenshots of it at 1.00, 0.95, 0.90, 0.85, and added it to the todo list.
Today, working on the Delaunator guide.
1. what it looks like now - point and triangle diagrams showing a *subset* of the data
2. new version - diagrams showing *complete* data including edge cases
3. complete example, with code you can copy/paste, and numbers you can see in the diagram
1. what it looks like now - point and triangle diagrams showing a *subset* of the data
2. new version - diagrams showing *complete* data including edge cases
3. complete example, with code you can copy/paste, and numbers you can see in the diagram


May 30, 2025 at 11:08 PM
Today, working on the Delaunator guide.
1. what it looks like now - point and triangle diagrams showing a *subset* of the data
2. new version - diagrams showing *complete* data including edge cases
3. complete example, with code you can copy/paste, and numbers you can see in the diagram
1. what it looks like now - point and triangle diagrams showing a *subset* of the data
2. new version - diagrams showing *complete* data including edge cases
3. complete example, with code you can copy/paste, and numbers you can see in the diagram
New blog post: Using flow field pathfinding on a voronoi procedurally generated map to simulate 20,000 traders moving around
www.redblobgames.com/blog/2025-05...
www.redblobgames.com/blog/2025-05...
May 15, 2025 at 11:57 PM
New blog post: Using flow field pathfinding on a voronoi procedurally generated map to simulate 20,000 traders moving around
www.redblobgames.com/blog/2025-05...
www.redblobgames.com/blog/2025-05...
The information density on weatherspark is amazing. The icons on this map are a year's worth of weather data. Left to right on the icon is Jan to Dec. Bottom to top is hours of the day. Each pixel color tells you temperature (blue = cold, red = hot).
weatherspark.com/map?pageType...
weatherspark.com/map?pageType...

May 8, 2025 at 7:15 PM
The information density on weatherspark is amazing. The icons on this map are a year's worth of weather data. Left to right on the icon is Jan to Dec. Bottom to top is hours of the day. Each pixel color tells you temperature (blue = cold, red = hot).
weatherspark.com/map?pageType...
weatherspark.com/map?pageType...
Working on a blog post, making many diagrams, throwing out many diagrams to simplify the post. This is one that I'm throwing out.

May 8, 2025 at 6:10 PM
Working on a blog post, making many diagrams, throwing out many diagrams to simplify the post. This is one that I'm throwing out.
Fun variant: add iTime to the angle
float angle = random(p) * 2.0 * PI + iTime;
and then you'll see the little black/white circles rotating around the triangle vertices (easier if you zoom in by changing the /50.0 to /200.0 at the end)
float angle = random(p) * 2.0 * PI + iTime;
and then you'll see the little black/white circles rotating around the triangle vertices (easier if you zoom in by changing the /50.0 to /200.0 at the end)
April 22, 2025 at 2:07 AM
Fun variant: add iTime to the angle
float angle = random(p) * 2.0 * PI + iTime;
and then you'll see the little black/white circles rotating around the triangle vertices (easier if you zoom in by changing the /50.0 to /200.0 at the end)
float angle = random(p) * 2.0 * PI + iTime;
and then you'll see the little black/white circles rotating around the triangle vertices (easier if you zoom in by changing the /50.0 to /200.0 at the end)
These visualizations are from a notebook I mostly made for myself. I share it occasionally— www.redblobgames.com/x/1830-jitte...
April 20, 2025 at 12:47 AM
These visualizations are from a notebook I mostly made for myself. I share it occasionally— www.redblobgames.com/x/1830-jitte...
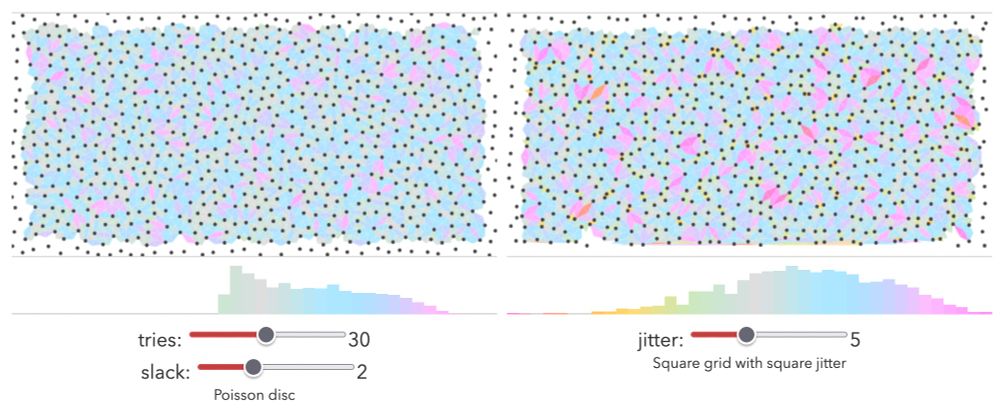
So I have another visualization showing the *angles* between the points. Here, Poisson Disk has no particular angle. Neither does Jittered Grid.
If I decrease the jitter, the angles become uniform.
So what I'm looking for is even distribution of angles *and* a tight distribution of distances.
If I decrease the jitter, the angles become uniform.
So what I'm looking for is even distribution of angles *and* a tight distribution of distances.


April 16, 2025 at 4:55 PM
So I have another visualization showing the *angles* between the points. Here, Poisson Disk has no particular angle. Neither does Jittered Grid.
If I decrease the jitter, the angles become uniform.
So what I'm looking for is even distribution of angles *and* a tight distribution of distances.
If I decrease the jitter, the angles become uniform.
So what I'm looking for is even distribution of angles *and* a tight distribution of distances.