


Philipp Jäger
@ph-jaeg.bsky.social
Policy Fellow @DelorsBerlin, covering EU econ & climate policy || previously at EU Commission, working on Germany's recovery || Econ at LSE
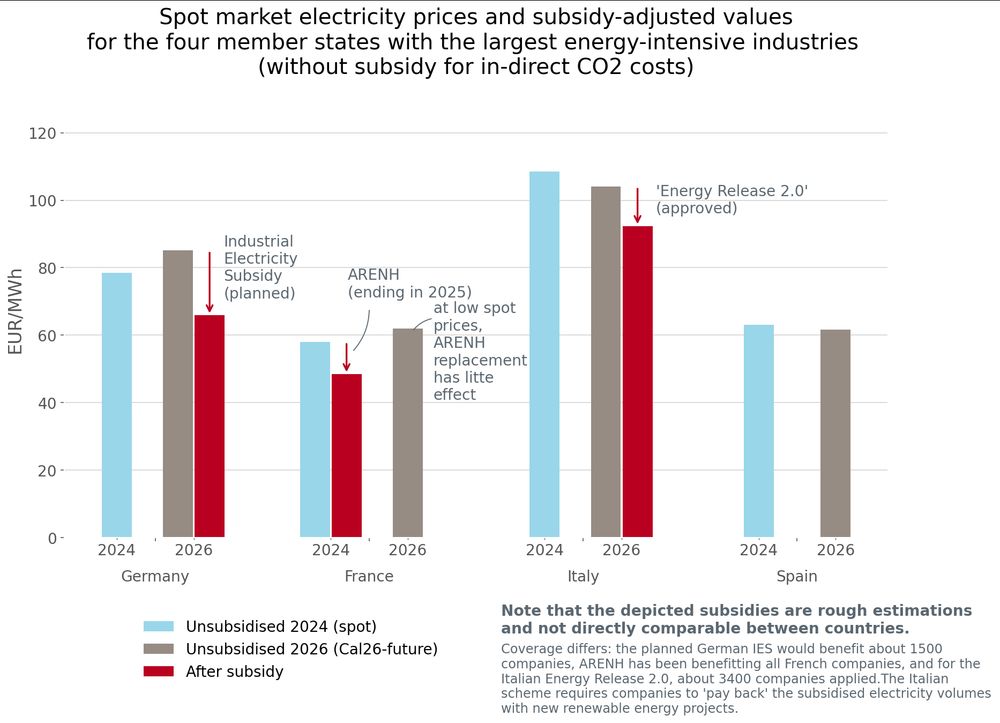
Is the German IES a competitiveness threat for other EU countries?
➡️ As I (very roughly) calculate, the German subsidy won’t dramatically undercut competitors - because German prices are high to start with. (10/23)
➡️ As I (very roughly) calculate, the German subsidy won’t dramatically undercut competitors - because German prices are high to start with. (10/23)
October 21, 2025 at 3:12 PM
Is the German IES a competitiveness threat for other EU countries?
➡️ As I (very roughly) calculate, the German subsidy won’t dramatically undercut competitors - because German prices are high to start with. (10/23)
➡️ As I (very roughly) calculate, the German subsidy won’t dramatically undercut competitors - because German prices are high to start with. (10/23)
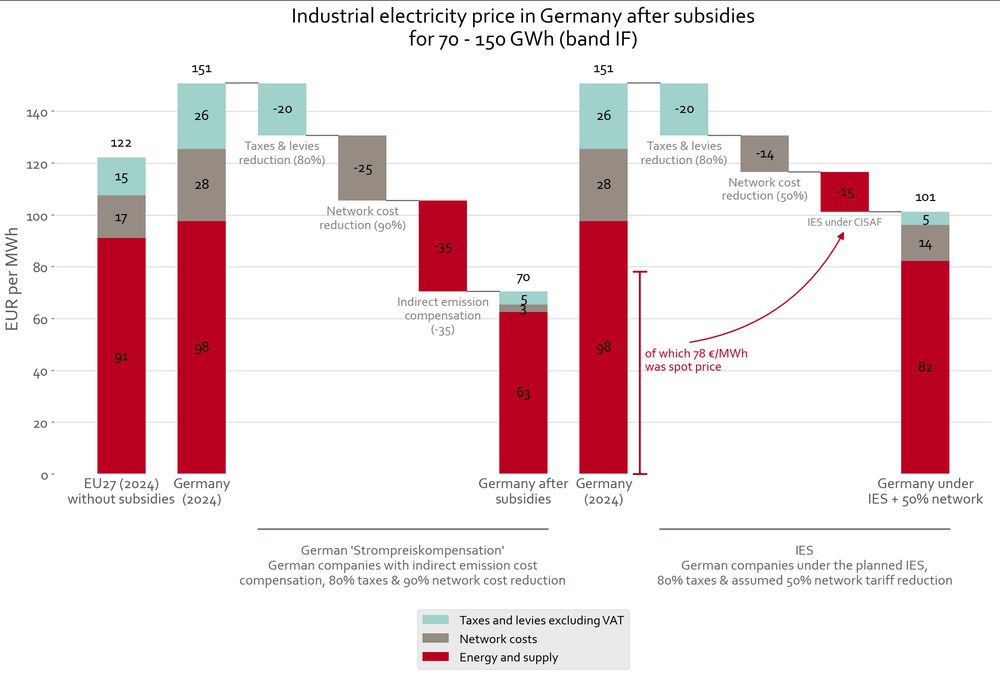
There are also massive subsidies for network tariffs for some industry. Together with these, my rough calculation yields that the IES in Germany will lower electricity prices by a third (for companies benefiting from the indirect emission cost subsidy, it's even more; left side of the chart) (9/23)
October 21, 2025 at 3:12 PM
There are also massive subsidies for network tariffs for some industry. Together with these, my rough calculation yields that the IES in Germany will lower electricity prices by a third (for companies benefiting from the indirect emission cost subsidy, it's even more; left side of the chart) (9/23)
Third, what does the IES (Industriestrompreis) actually imply for German electricity prices for industry?
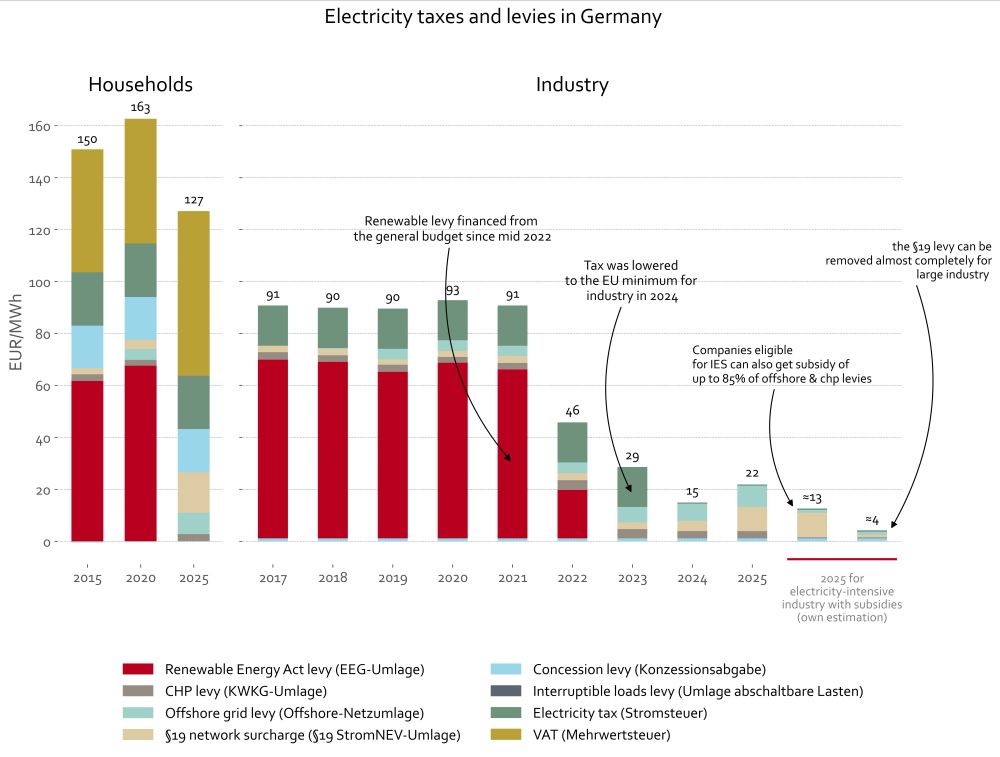
Note that Germany, and other MS, offer big subsidies on taxes&levies. Companies eligible for the IES pay almost nothing for those in Germany (especially compared to households). (8/23)
Note that Germany, and other MS, offer big subsidies on taxes&levies. Companies eligible for the IES pay almost nothing for those in Germany (especially compared to households). (8/23)
October 21, 2025 at 3:11 PM
Third, what does the IES (Industriestrompreis) actually imply for German electricity prices for industry?
Note that Germany, and other MS, offer big subsidies on taxes&levies. Companies eligible for the IES pay almost nothing for those in Germany (especially compared to households). (8/23)
Note that Germany, and other MS, offer big subsidies on taxes&levies. Companies eligible for the IES pay almost nothing for those in Germany (especially compared to households). (8/23)
Is the IES (Industriestrompreis) or Indirect Emission Cost subsidy bigger? Almost always the latter, but it depends on prices & the country's electricity mix.
You can play around with the assumptions for all EU countries here: delors-data.eu/IES/
The chart below shows it for Germany. (7/23)
You can play around with the assumptions for all EU countries here: delors-data.eu/IES/
The chart below shows it for Germany. (7/23)

October 21, 2025 at 3:11 PM
Is the IES (Industriestrompreis) or Indirect Emission Cost subsidy bigger? Almost always the latter, but it depends on prices & the country's electricity mix.
You can play around with the assumptions for all EU countries here: delors-data.eu/IES/
The chart below shows it for Germany. (7/23)
You can play around with the assumptions for all EU countries here: delors-data.eu/IES/
The chart below shows it for Germany. (7/23)
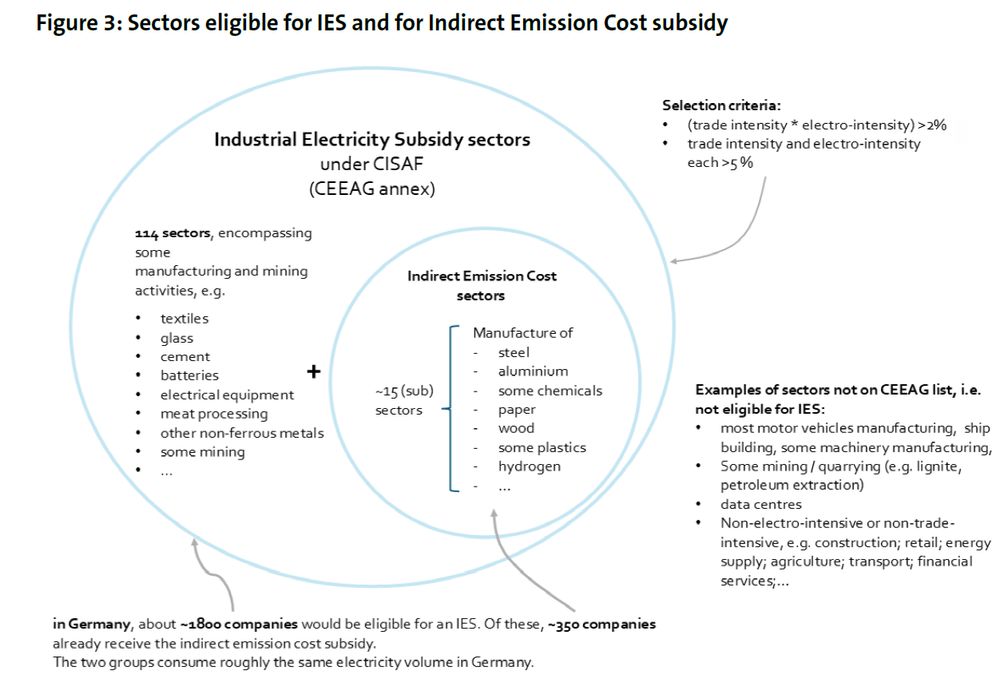
Second, who is eligible for the subsidy?
➡️ Energy- and trade-intensive sectors. But some of these can already get another subsidy the (often massive) indirect emission cost compensation - companies can de-facto only get either/or. In DE, this other subsidy is called "Strompreiskompensation" (6/23)
➡️ Energy- and trade-intensive sectors. But some of these can already get another subsidy the (often massive) indirect emission cost compensation - companies can de-facto only get either/or. In DE, this other subsidy is called "Strompreiskompensation" (6/23)
October 21, 2025 at 3:11 PM
Second, who is eligible for the subsidy?
➡️ Energy- and trade-intensive sectors. But some of these can already get another subsidy the (often massive) indirect emission cost compensation - companies can de-facto only get either/or. In DE, this other subsidy is called "Strompreiskompensation" (6/23)
➡️ Energy- and trade-intensive sectors. But some of these can already get another subsidy the (often massive) indirect emission cost compensation - companies can de-facto only get either/or. In DE, this other subsidy is called "Strompreiskompensation" (6/23)
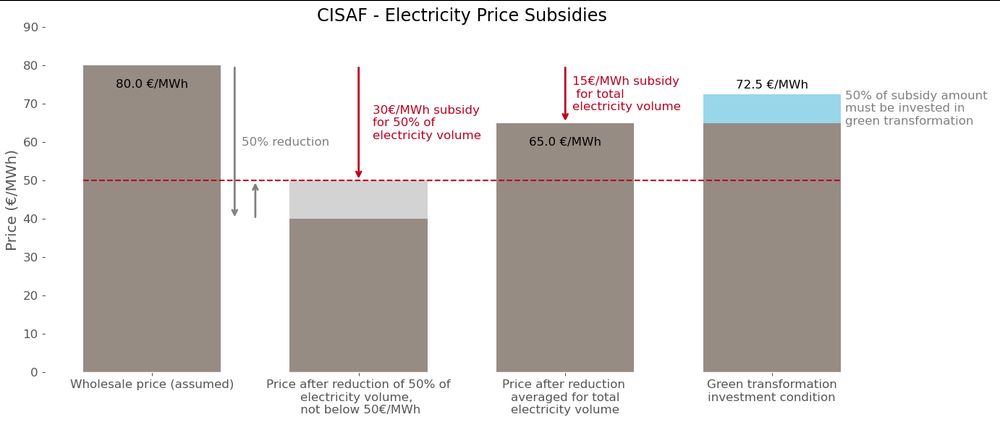
First: how big is the maximum subsidy per MWh for the IES, taking into account the restrictions of the new state aid rules?
➡️ It depends on the country's wholesale prices. For Germany, at wholesale prices of ~80€/MWh, the maximum subsidy would be about ~15€/MWh. (5/23)
➡️ It depends on the country's wholesale prices. For Germany, at wholesale prices of ~80€/MWh, the maximum subsidy would be about ~15€/MWh. (5/23)

October 21, 2025 at 3:11 PM
First: how big is the maximum subsidy per MWh for the IES, taking into account the restrictions of the new state aid rules?
➡️ It depends on the country's wholesale prices. For Germany, at wholesale prices of ~80€/MWh, the maximum subsidy would be about ~15€/MWh. (5/23)
➡️ It depends on the country's wholesale prices. For Germany, at wholesale prices of ~80€/MWh, the maximum subsidy would be about ~15€/MWh. (5/23)
The new EU state aid framework CISAF is out. It allows to subsidise electricity prices for some EII (allowing versions of the DE "Industriestrompreis"). Given restrictions, the actual subsidy is smaller than one might think, as I illustrated below (inspired by a Handelsblatt article from yesterday)
June 25, 2025 at 3:27 PM
The new EU state aid framework CISAF is out. It allows to subsidise electricity prices for some EII (allowing versions of the DE "Industriestrompreis"). Given restrictions, the actual subsidy is smaller than one might think, as I illustrated below (inspired by a Handelsblatt article from yesterday)
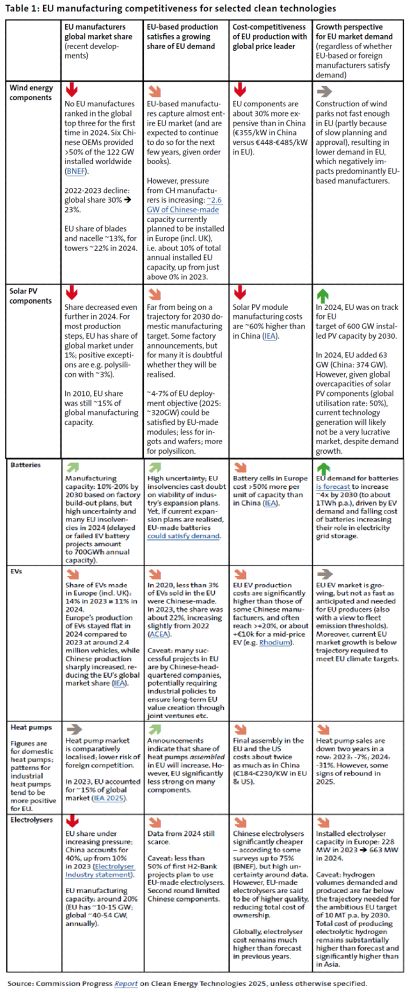
The CID implementation needs to be very bold, given the massive challenges of the sectors.
On clean tech, Chinese products are often MUCH cheaper. And EU-based producers continue to lose market share in the EU and globally. The chart shows the recent developments (higher quality in PDF): (5/n)
On clean tech, Chinese products are often MUCH cheaper. And EU-based producers continue to lose market share in the EU and globally. The chart shows the recent developments (higher quality in PDF): (5/n)
June 20, 2025 at 2:55 PM
The CID implementation needs to be very bold, given the massive challenges of the sectors.
On clean tech, Chinese products are often MUCH cheaper. And EU-based producers continue to lose market share in the EU and globally. The chart shows the recent developments (higher quality in PDF): (5/n)
On clean tech, Chinese products are often MUCH cheaper. And EU-based producers continue to lose market share in the EU and globally. The chart shows the recent developments (higher quality in PDF): (5/n)
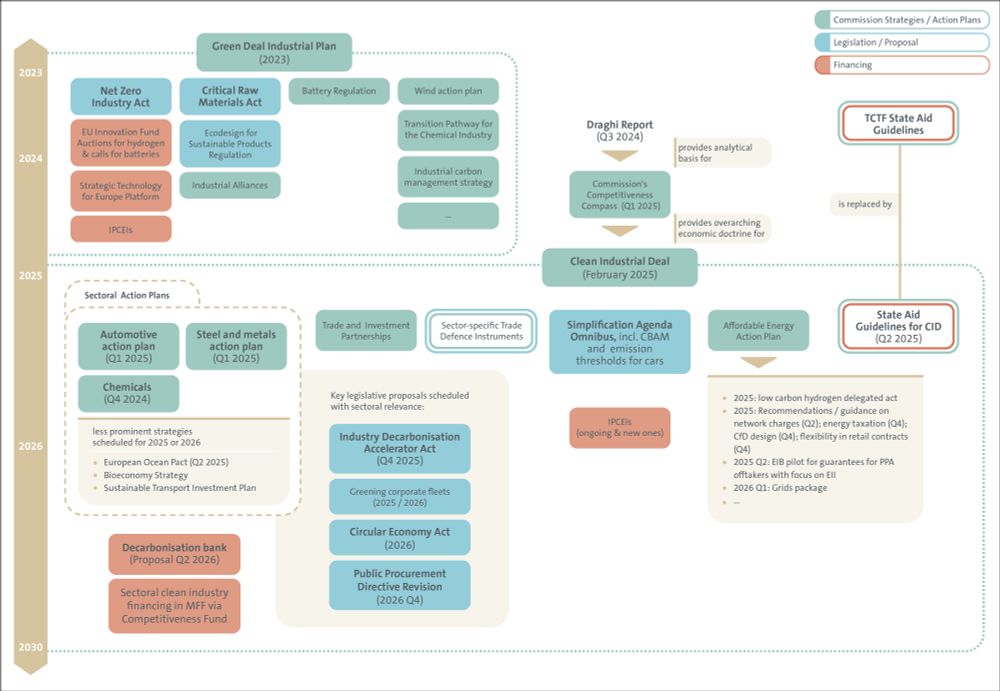
As a result, the success of the CID hinges on how the many blanks for instruments like lead markets are filled in in COM proposals, and then by co-legislators, over the next 1-2 years.
The chart shows how previous EU sectoral policy relates to the CID, and what legislation to expect: (4/n)
The chart shows how previous EU sectoral policy relates to the CID, and what legislation to expect: (4/n)
June 20, 2025 at 2:55 PM
As a result, the success of the CID hinges on how the many blanks for instruments like lead markets are filled in in COM proposals, and then by co-legislators, over the next 1-2 years.
The chart shows how previous EU sectoral policy relates to the CID, and what legislation to expect: (4/n)
The chart shows how previous EU sectoral policy relates to the CID, and what legislation to expect: (4/n)
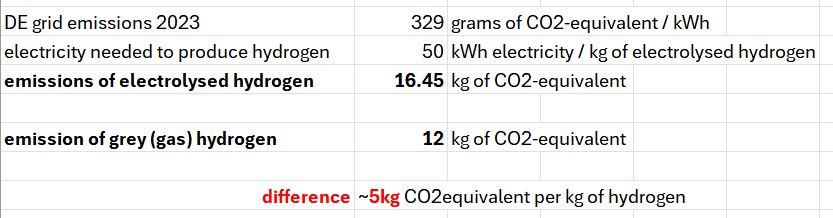
Arguably these rules are rather strict and plausibly slow down the hydrogen ramp-up. However, if rules are amended, changes must be targeted, and cannot throw out the baby with the bathwater. Another quick&dirty calculation shows high CO2 emissions for 2030, if using electricity from the DE grid:

January 7, 2025 at 5:15 PM
Arguably these rules are rather strict and plausibly slow down the hydrogen ramp-up. However, if rules are amended, changes must be targeted, and cannot throw out the baby with the bathwater. Another quick&dirty calculation shows high CO2 emissions for 2030, if using electricity from the DE grid:
If hydrogen was simply produced by using electricity from the German grid, this would cause about 5kg MORE emissions than just using fossil hydrogen, i.e. defeats the climate purpose, as shown in this quick & dirty calculation below:
January 7, 2025 at 5:15 PM
If hydrogen was simply produced by using electricity from the German grid, this would cause about 5kg MORE emissions than just using fossil hydrogen, i.e. defeats the climate purpose, as shown in this quick & dirty calculation below:
On producing green hydrogen, SPD & Greens are both calling for looser EU rules - see Scholz' recent letter to von der Leyen below. However, if rules are made more flexible, it's critical not to overdo it - otherwise, green hydrogen harms the climate, instead of protecting it. Short 🧵

January 7, 2025 at 5:15 PM
On producing green hydrogen, SPD & Greens are both calling for looser EU rules - see Scholz' recent letter to von der Leyen below. However, if rules are made more flexible, it's critical not to overdo it - otherwise, green hydrogen harms the climate, instead of protecting it. Short 🧵
However, auctions only work well as long as certain conditions are fulfilled (see below). When they're not, other mechanisms are needed, such as competitive calls --> 3️⃣ COM should quickly devise "as-a-service" mechanisms for tools beyond auctions (which COM has already started working on). (12/n)

December 20, 2024 at 11:14 AM
However, auctions only work well as long as certain conditions are fulfilled (see below). When they're not, other mechanisms are needed, such as competitive calls --> 3️⃣ COM should quickly devise "as-a-service" mechanisms for tools beyond auctions (which COM has already started working on). (12/n)
Second, a new tool proposed in the paper is "state aid templates", that define the selection process and disbursement mechanism, and member states should use instead of coming up with their own scheme that differs from country to country.
Below the alignment potential of different tools: (9/n)
Below the alignment potential of different tools: (9/n)

December 20, 2024 at 11:14 AM
Second, a new tool proposed in the paper is "state aid templates", that define the selection process and disbursement mechanism, and member states should use instead of coming up with their own scheme that differs from country to country.
Below the alignment potential of different tools: (9/n)
Below the alignment potential of different tools: (9/n)
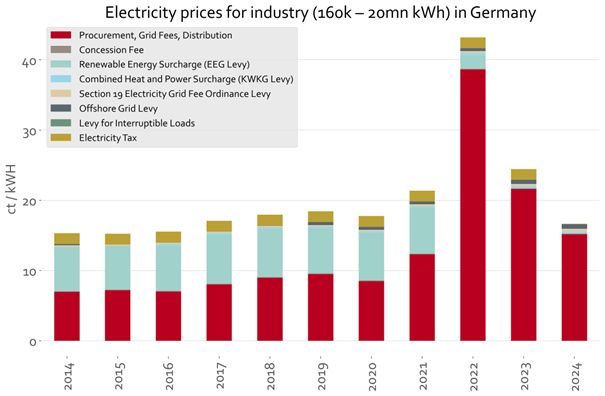
First, energy prices have come down already a lot since the peak of the energy crisis – German energy costs are comparable to a few years ago, when car companies in Germany thrived. This alone means some skepticism is warranted, if lowering energy prices is depicted as a silver bullet. Source: BDEW
December 4, 2024 at 12:29 PM
First, energy prices have come down already a lot since the peak of the energy crisis – German energy costs are comparable to a few years ago, when car companies in Germany thrived. This alone means some skepticism is warranted, if lowering energy prices is depicted as a silver bullet. Source: BDEW
With the German automotive companies in crisis, high energy prices are often cited as a major culprit – e.g. by Habeck (bit.ly/3VoSEc1), and in the DE expert report just published. But are they really that crucial? And what does it mean for EU energy policy?
Short thread
report: bit.ly/3OD3qHJ
Short thread
report: bit.ly/3OD3qHJ

December 4, 2024 at 12:29 PM
With the German automotive companies in crisis, high energy prices are often cited as a major culprit – e.g. by Habeck (bit.ly/3VoSEc1), and in the DE expert report just published. But are they really that crucial? And what does it mean for EU energy policy?
Short thread
report: bit.ly/3OD3qHJ
Short thread
report: bit.ly/3OD3qHJ
To get electricity prices for industry down, one part of the DE policy package is to reduce the electricity tax for businesses to the legal EU minimum of 0.05cent / kWh. How does this compare to the rates applicable in other EU countries?

November 13, 2023 at 1:45 PM
To get electricity prices for industry down, one part of the DE policy package is to reduce the electricity tax for businesses to the legal EU minimum of 0.05cent / kWh. How does this compare to the rates applicable in other EU countries?
We recommend 4 things for EU IP: 1) The EU needs to consider its strengths and weaknesses, and be more selective in which areas it wants to support, and for which reason (economy/climate/resilience?).
2) More R&D spending, to catch up with US etc (see chart below). (7/17)
2) More R&D spending, to catch up with US etc (see chart below). (7/17)

October 27, 2023 at 12:49 PM
We recommend 4 things for EU IP: 1) The EU needs to consider its strengths and weaknesses, and be more selective in which areas it wants to support, and for which reason (economy/climate/resilience?).
2) More R&D spending, to catch up with US etc (see chart below). (7/17)
2) More R&D spending, to catch up with US etc (see chart below). (7/17)
On various key metrics, the EU is being outperformed by peers like the US. One metric that epitomizes a lot of the problems is GDP growth, where the US has been doing better than the EU. Another one is ICT patents. (2/17)

October 27, 2023 at 12:48 PM
On various key metrics, the EU is being outperformed by peers like the US. One metric that epitomizes a lot of the problems is GDP growth, where the US has been doing better than the EU. Another one is ICT patents. (2/17)
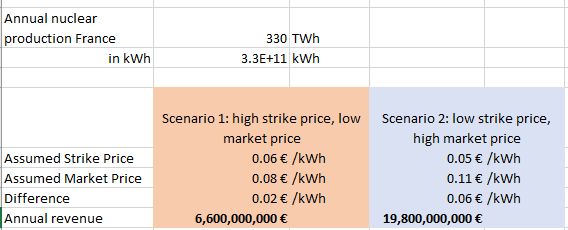
I did some (very!) quick-and-dirty calculations on revenues. Assuming all nuclear output was to be covered by CfDs, and a strike price of 5 or 6 cents is set, France could spend billions each year (in low scenario €6.6bn, high scenario €20bn) to lower electricity prices.
October 18, 2023 at 11:17 AM
I did some (very!) quick-and-dirty calculations on revenues. Assuming all nuclear output was to be covered by CfDs, and a strike price of 5 or 6 cents is set, France could spend billions each year (in low scenario €6.6bn, high scenario €20bn) to lower electricity prices.