


Omid V. Ebrahimi
@omidvebrahimi.bsky.social
Research Fellow | University of Oxford | Magdalen College.
Head of Oxford EDGE Lab | @edgelab.bsky.social.
Clinical Psychologist | Public Health | Statistics.
I study how people transition into and recover from mental disorders.
Head of Oxford EDGE Lab | @edgelab.bsky.social.
Clinical Psychologist | Public Health | Statistics.
I study how people transition into and recover from mental disorders.
Honoured to receive the Teaching Excellence Award at University of Oxford after my 1st year with the university
The real credit goes to the students: teaching such talented minds is a privilege
📸 Thanks to my lovely colleague, Kate Nation
@ox.ac.uk @oxexppsy.bsky.social @magdalenoxford.bsky.social
The real credit goes to the students: teaching such talented minds is a privilege
📸 Thanks to my lovely colleague, Kate Nation
@ox.ac.uk @oxexppsy.bsky.social @magdalenoxford.bsky.social

October 30, 2025 at 10:46 AM
Honoured to receive the Teaching Excellence Award at University of Oxford after my 1st year with the university
The real credit goes to the students: teaching such talented minds is a privilege
📸 Thanks to my lovely colleague, Kate Nation
@ox.ac.uk @oxexppsy.bsky.social @magdalenoxford.bsky.social
The real credit goes to the students: teaching such talented minds is a privilege
📸 Thanks to my lovely colleague, Kate Nation
@ox.ac.uk @oxexppsy.bsky.social @magdalenoxford.bsky.social
9/9: I was fortunate to spend half my PhD at University of Amsterdam & University of Oxford
My gratitude to Denny Borsboom, Sacha Epskamp & Andrea Cipriani for their mentorship & generously welcoming me into their labs, enriching my development
Thx to all collaborators making this journey special:
My gratitude to Denny Borsboom, Sacha Epskamp & Andrea Cipriani for their mentorship & generously welcoming me into their labs, enriching my development
Thx to all collaborators making this journey special:

September 25, 2025 at 12:26 PM
9/9: I was fortunate to spend half my PhD at University of Amsterdam & University of Oxford
My gratitude to Denny Borsboom, Sacha Epskamp & Andrea Cipriani for their mentorship & generously welcoming me into their labs, enriching my development
Thx to all collaborators making this journey special:
My gratitude to Denny Borsboom, Sacha Epskamp & Andrea Cipriani for their mentorship & generously welcoming me into their labs, enriching my development
Thx to all collaborators making this journey special:
5: The work's real-time nature was a big challenge & growth opportunity.
Getting 'thrown into it' live on national news [NRK; Norwegian BBC] within 1st weeks of PhD, and 70+ times across news, TV, and radio formats, resulting in the Science Communication Award by Uni of Oslo during my 1st PhD year.
Getting 'thrown into it' live on national news [NRK; Norwegian BBC] within 1st weeks of PhD, and 70+ times across news, TV, and radio formats, resulting in the Science Communication Award by Uni of Oslo during my 1st PhD year.


September 25, 2025 at 12:26 PM
5: The work's real-time nature was a big challenge & growth opportunity.
Getting 'thrown into it' live on national news [NRK; Norwegian BBC] within 1st weeks of PhD, and 70+ times across news, TV, and radio formats, resulting in the Science Communication Award by Uni of Oslo during my 1st PhD year.
Getting 'thrown into it' live on national news [NRK; Norwegian BBC] within 1st weeks of PhD, and 70+ times across news, TV, and radio formats, resulting in the Science Communication Award by Uni of Oslo during my 1st PhD year.
4: Thesis focused on
▶️ Identifying characteristics associated w/risk & resilience patterns
▶️ Using dynamical systems approaches to model transitions to mental disorders in previously healthy individuals
▶️ Linking these patterns to post-pandemic treatment queues, helping explain rising wait times
▶️ Identifying characteristics associated w/risk & resilience patterns
▶️ Using dynamical systems approaches to model transitions to mental disorders in previously healthy individuals
▶️ Linking these patterns to post-pandemic treatment queues, helping explain rising wait times


September 25, 2025 at 12:26 PM
4: Thesis focused on
▶️ Identifying characteristics associated w/risk & resilience patterns
▶️ Using dynamical systems approaches to model transitions to mental disorders in previously healthy individuals
▶️ Linking these patterns to post-pandemic treatment queues, helping explain rising wait times
▶️ Identifying characteristics associated w/risk & resilience patterns
▶️ Using dynamical systems approaches to model transitions to mental disorders in previously healthy individuals
▶️ Linking these patterns to post-pandemic treatment queues, helping explain rising wait times
I'm beyond words honoured to receive the Doctoral Thesis of the Year Award by the Norwegian Psychological Association!
Deeply grateful to my supervisors and the wonderful colleagues I've had the privilege of working with.
Interview about findings and a 🧵:
www.psykologforeningen.no/aktuelt/pand...
Deeply grateful to my supervisors and the wonderful colleagues I've had the privilege of working with.
Interview about findings and a 🧵:
www.psykologforeningen.no/aktuelt/pand...

September 25, 2025 at 12:26 PM
I'm beyond words honoured to receive the Doctoral Thesis of the Year Award by the Norwegian Psychological Association!
Deeply grateful to my supervisors and the wonderful colleagues I've had the privilege of working with.
Interview about findings and a 🧵:
www.psykologforeningen.no/aktuelt/pand...
Deeply grateful to my supervisors and the wonderful colleagues I've had the privilege of working with.
Interview about findings and a 🧵:
www.psykologforeningen.no/aktuelt/pand...
Thx to dream team: Cloos, @bsiepe.bsky.social, @marilynpicciri1.bsky.social, @eikofried.bsky.social, @shirleybwang.bsky.social, @mahelmich.bsky.social, Hoffart & Johnson.
The results support accuracy & consistency of digital VAS & alleviate several key concerns about potential inaccuracies.
The results support accuracy & consistency of digital VAS & alleviate several key concerns about potential inaccuracies.

August 7, 2025 at 9:52 AM
Thx to dream team: Cloos, @bsiepe.bsky.social, @marilynpicciri1.bsky.social, @eikofried.bsky.social, @shirleybwang.bsky.social, @mahelmich.bsky.social, Hoffart & Johnson.
The results support accuracy & consistency of digital VAS & alleviate several key concerns about potential inaccuracies.
The results support accuracy & consistency of digital VAS & alleviate several key concerns about potential inaccuracies.
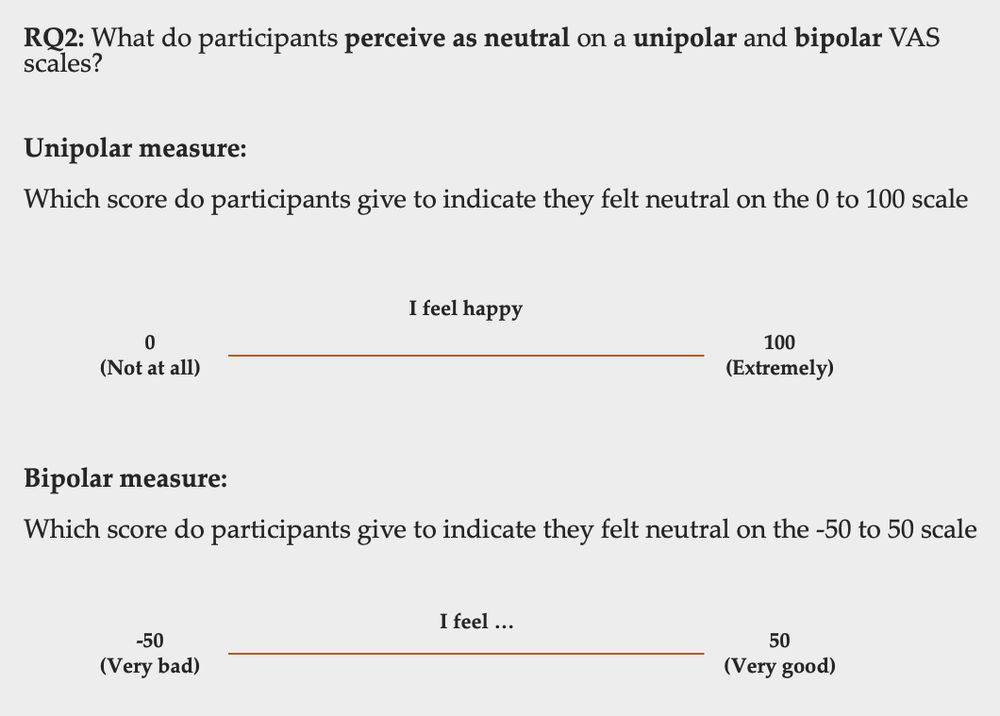
b) Between-person agreement
The majority of participants agreed & provided the expected neutral points on both unipolar (50) & bipolar (0) VAS item, with 82.19% & 88.89% indicating the scale midpoint (50 & 0, ± 5) as neutral point respectively
Subjects agreed more on neutral point for bipolar item
The majority of participants agreed & provided the expected neutral points on both unipolar (50) & bipolar (0) VAS item, with 82.19% & 88.89% indicating the scale midpoint (50 & 0, ± 5) as neutral point respectively
Subjects agreed more on neutral point for bipolar item


August 7, 2025 at 9:52 AM
b) Between-person agreement
The majority of participants agreed & provided the expected neutral points on both unipolar (50) & bipolar (0) VAS item, with 82.19% & 88.89% indicating the scale midpoint (50 & 0, ± 5) as neutral point respectively
Subjects agreed more on neutral point for bipolar item
The majority of participants agreed & provided the expected neutral points on both unipolar (50) & bipolar (0) VAS item, with 82.19% & 88.89% indicating the scale midpoint (50 & 0, ± 5) as neutral point respectively
Subjects agreed more on neutral point for bipolar item
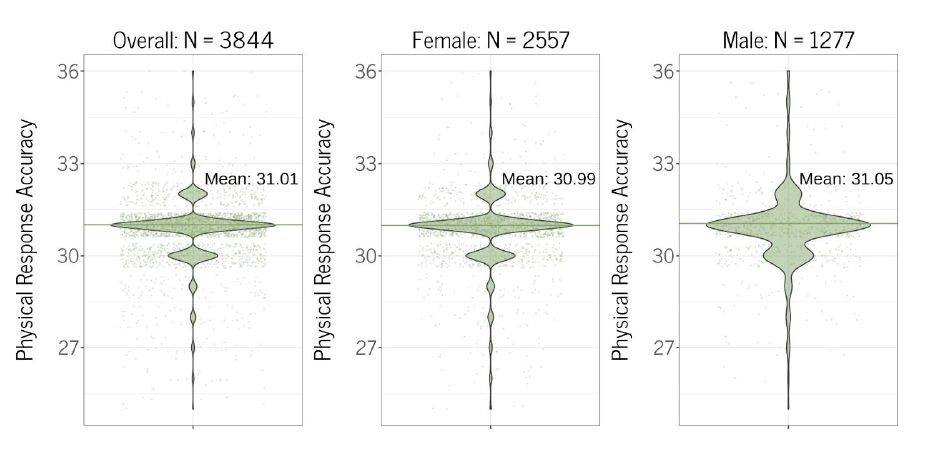
4: Results - a) Tactile precision & physical accuracy:
When instructed to provide a specific number '31', we found high precision (M = 31.01; SD = 3.28), with 87.0% of subjects scoring between 30-32.
We found no meaningful predictors (e.g., sex, age, education, BMI) influencing tactile precision.
When instructed to provide a specific number '31', we found high precision (M = 31.01; SD = 3.28), with 87.0% of subjects scoring between 30-32.
We found no meaningful predictors (e.g., sex, age, education, BMI) influencing tactile precision.

August 7, 2025 at 9:52 AM
4: Results - a) Tactile precision & physical accuracy:
When instructed to provide a specific number '31', we found high precision (M = 31.01; SD = 3.28), with 87.0% of subjects scoring between 30-32.
We found no meaningful predictors (e.g., sex, age, education, BMI) influencing tactile precision.
When instructed to provide a specific number '31', we found high precision (M = 31.01; SD = 3.28), with 87.0% of subjects scoring between 30-32.
We found no meaningful predictors (e.g., sex, age, education, BMI) influencing tactile precision.
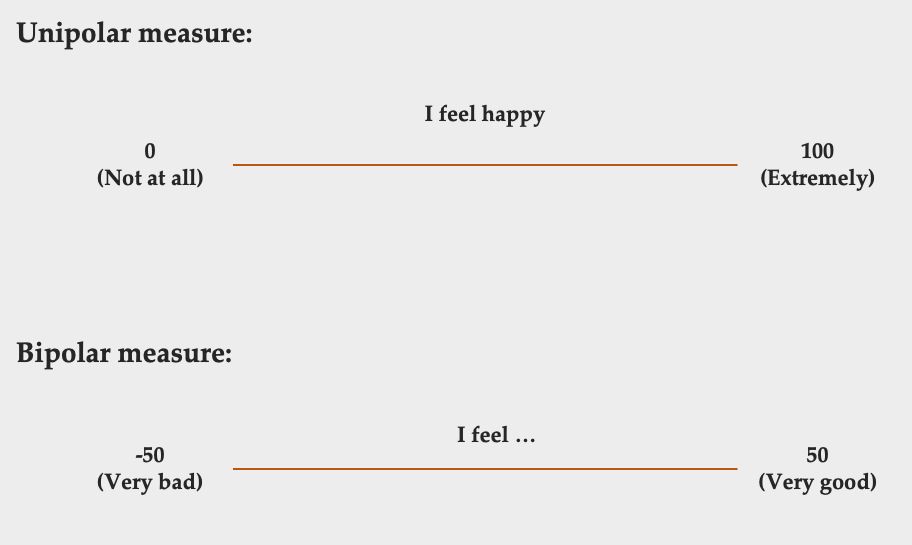
1: The ubiquity of digital technologies (ESM/EMA) has increased assessment of individuals' thoughts, behaviours & experiences via electronic devices, often measured via Visual Analogue Scales (VAS).
Two commonly used forms include a) unipolar (0-100) & b) bipolar (e.g. -50 to 50) VAS.
Two commonly used forms include a) unipolar (0-100) & b) bipolar (e.g. -50 to 50) VAS.

August 7, 2025 at 9:52 AM
1: The ubiquity of digital technologies (ESM/EMA) has increased assessment of individuals' thoughts, behaviours & experiences via electronic devices, often measured via Visual Analogue Scales (VAS).
Two commonly used forms include a) unipolar (0-100) & b) bipolar (e.g. -50 to 50) VAS.
Two commonly used forms include a) unipolar (0-100) & b) bipolar (e.g. -50 to 50) VAS.
📜 Our new paper assessing Fit Measures for Confirmatory Network Models is now out in Psychological Methods:
Most conventional SEM cut-offs (e.g. for RMSEA) generalise well to confirmatory network modelling.
psycnet.apa.org/doiLanding?d...
Most conventional SEM cut-offs (e.g. for RMSEA) generalise well to confirmatory network modelling.
psycnet.apa.org/doiLanding?d...

June 26, 2025 at 11:13 AM
📜 Our new paper assessing Fit Measures for Confirmatory Network Models is now out in Psychological Methods:
Most conventional SEM cut-offs (e.g. for RMSEA) generalise well to confirmatory network modelling.
psycnet.apa.org/doiLanding?d...
Most conventional SEM cut-offs (e.g. for RMSEA) generalise well to confirmatory network modelling.
psycnet.apa.org/doiLanding?d...
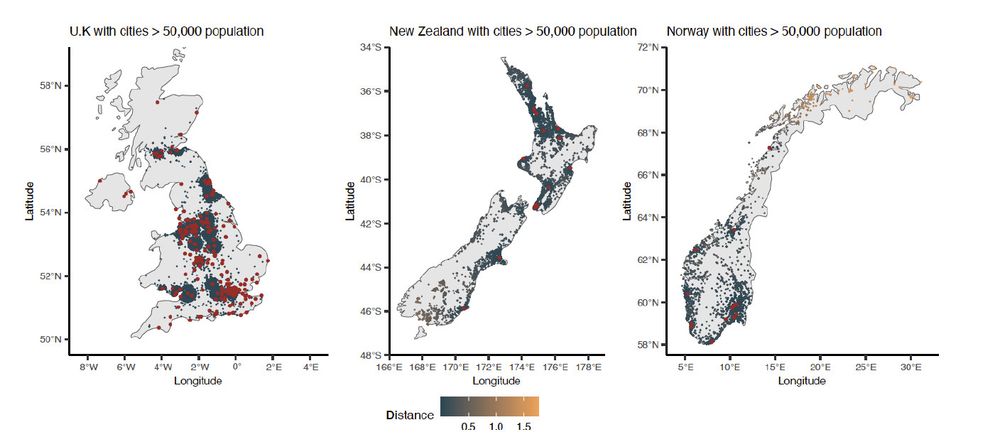
4 | Using a continuous measure of urbanicity developed by Finnemann et al, we examined the relationship between urbanicity and prevalence of mental disorders across:
- UK (N = 449,323)
- New Zealand (N = 33,042)
- Norway (N = 13,238)
Measure found here: www.science.org/doi/10.1126/...
- UK (N = 449,323)
- New Zealand (N = 33,042)
- Norway (N = 13,238)
Measure found here: www.science.org/doi/10.1126/...

June 12, 2025 at 10:09 AM
4 | Using a continuous measure of urbanicity developed by Finnemann et al, we examined the relationship between urbanicity and prevalence of mental disorders across:
- UK (N = 449,323)
- New Zealand (N = 33,042)
- Norway (N = 13,238)
Measure found here: www.science.org/doi/10.1126/...
- UK (N = 449,323)
- New Zealand (N = 33,042)
- Norway (N = 13,238)
Measure found here: www.science.org/doi/10.1126/...
How does where we live – urban, rural, or in-between – relate to our mental health? 🌆🏞️
In this cross-national study, we investigate the links between urbanicity, anxiety and depressive disorders in 500,000 adults across the UK, Norway, and New Zealand 🧵
www.sciencedirect.com/science/arti...
In this cross-national study, we investigate the links between urbanicity, anxiety and depressive disorders in 500,000 adults across the UK, Norway, and New Zealand 🧵
www.sciencedirect.com/science/arti...
June 12, 2025 at 10:09 AM
How does where we live – urban, rural, or in-between – relate to our mental health? 🌆🏞️
In this cross-national study, we investigate the links between urbanicity, anxiety and depressive disorders in 500,000 adults across the UK, Norway, and New Zealand 🧵
www.sciencedirect.com/science/arti...
In this cross-national study, we investigate the links between urbanicity, anxiety and depressive disorders in 500,000 adults across the UK, Norway, and New Zealand 🧵
www.sciencedirect.com/science/arti...
Very excited to speak at the Network Science Conference in Maastricht this week about the utility of psychometric networks in the precision diagnostics field.
Come to our session on Friday at 2pm & check out the program for the many great talks at the conference
@netsciconf.bsky.social #NetSci2025
Come to our session on Friday at 2pm & check out the program for the many great talks at the conference
@netsciconf.bsky.social #NetSci2025

June 3, 2025 at 11:57 AM
Very excited to speak at the Network Science Conference in Maastricht this week about the utility of psychometric networks in the precision diagnostics field.
Come to our session on Friday at 2pm & check out the program for the many great talks at the conference
@netsciconf.bsky.social #NetSci2025
Come to our session on Friday at 2pm & check out the program for the many great talks at the conference
@netsciconf.bsky.social #NetSci2025

May 18, 2025 at 3:34 PM
Had a great time giving a talk in Cambridge and exploring the city.
Thanks for hosting me, Trinity College!
@cambridgeuni.bsky.social
Thanks for hosting me, Trinity College!
@cambridgeuni.bsky.social


May 9, 2025 at 11:54 AM
Had a great time giving a talk in Cambridge and exploring the city.
Thanks for hosting me, Trinity College!
@cambridgeuni.bsky.social
Thanks for hosting me, Trinity College!
@cambridgeuni.bsky.social
Not the worst place to review a manuscript.
#UniversityOfOxford @ox.ac.uk @magdalenoxford.bsky.social
#UniversityOfOxford @ox.ac.uk @magdalenoxford.bsky.social

April 3, 2025 at 10:16 AM
Not the worst place to review a manuscript.
#UniversityOfOxford @ox.ac.uk @magdalenoxford.bsky.social
#UniversityOfOxford @ox.ac.uk @magdalenoxford.bsky.social
8: Other key factors underlying vaccine hesitancy:
➡️ The media's portrayal of rare incidents as fear amplifiers
➡️ Stigmatizing portrayal of vaccinated individuals (resulting in polarization & reluctance to vaccinate)
➡️ Information overload about vaccination
➡️ Fear of needles
➡️ The media's portrayal of rare incidents as fear amplifiers
➡️ Stigmatizing portrayal of vaccinated individuals (resulting in polarization & reluctance to vaccinate)
➡️ Information overload about vaccination
➡️ Fear of needles

March 13, 2025 at 11:01 AM
8: Other key factors underlying vaccine hesitancy:
➡️ The media's portrayal of rare incidents as fear amplifiers
➡️ Stigmatizing portrayal of vaccinated individuals (resulting in polarization & reluctance to vaccinate)
➡️ Information overload about vaccination
➡️ Fear of needles
➡️ The media's portrayal of rare incidents as fear amplifiers
➡️ Stigmatizing portrayal of vaccinated individuals (resulting in polarization & reluctance to vaccinate)
➡️ Information overload about vaccination
➡️ Fear of needles
7: Overall, the core predictors of vaccine hesitancy were:
➡️ Illusion of invulnerability
➡️ Distrust in official entities
➡️ Doubts about vaccine efficacy
➡️ Minimization of the societal impact of C19 virus
➡️ Health-related fears tied to vaccination
➡️ Illusion of invulnerability
➡️ Distrust in official entities
➡️ Doubts about vaccine efficacy
➡️ Minimization of the societal impact of C19 virus
➡️ Health-related fears tied to vaccination

March 13, 2025 at 11:01 AM
7: Overall, the core predictors of vaccine hesitancy were:
➡️ Illusion of invulnerability
➡️ Distrust in official entities
➡️ Doubts about vaccine efficacy
➡️ Minimization of the societal impact of C19 virus
➡️ Health-related fears tied to vaccination
➡️ Illusion of invulnerability
➡️ Distrust in official entities
➡️ Doubts about vaccine efficacy
➡️ Minimization of the societal impact of C19 virus
➡️ Health-related fears tied to vaccination
Where it started.
Pleasure working together on this, Shirley! Very rewarding.
Pleasure working together on this, Shirley! Very rewarding.

February 7, 2025 at 9:39 PM
Where it started.
Pleasure working together on this, Shirley! Very rewarding.
Pleasure working together on this, Shirley! Very rewarding.
b) Between-person agreement
The majority of participants agreed & provided the expected neutral points on both unipolar (50) & bipolar (0) VAS item, with 82.19% & 88.89% indicating the scale midpoint (50 & 0, ± 5) as neutral point respectively
Subjects agreed more on neutral point for bipolar item
The majority of participants agreed & provided the expected neutral points on both unipolar (50) & bipolar (0) VAS item, with 82.19% & 88.89% indicating the scale midpoint (50 & 0, ± 5) as neutral point respectively
Subjects agreed more on neutral point for bipolar item

February 7, 2025 at 11:59 AM
b) Between-person agreement
The majority of participants agreed & provided the expected neutral points on both unipolar (50) & bipolar (0) VAS item, with 82.19% & 88.89% indicating the scale midpoint (50 & 0, ± 5) as neutral point respectively
Subjects agreed more on neutral point for bipolar item
The majority of participants agreed & provided the expected neutral points on both unipolar (50) & bipolar (0) VAS item, with 82.19% & 88.89% indicating the scale midpoint (50 & 0, ± 5) as neutral point respectively
Subjects agreed more on neutral point for bipolar item
4: Results - a) Tactile precision & physical accuracy:
When instructed to provide a specific number '31', we found high precision (M = 31.01; SD = 3.28), with 87.0% of subjects scoring between 30-32.
We found no meaningful predictors (e.g., sex, age, education, BMI) influencing tactile precision.
When instructed to provide a specific number '31', we found high precision (M = 31.01; SD = 3.28), with 87.0% of subjects scoring between 30-32.
We found no meaningful predictors (e.g., sex, age, education, BMI) influencing tactile precision.
February 7, 2025 at 11:59 AM
4: Results - a) Tactile precision & physical accuracy:
When instructed to provide a specific number '31', we found high precision (M = 31.01; SD = 3.28), with 87.0% of subjects scoring between 30-32.
We found no meaningful predictors (e.g., sex, age, education, BMI) influencing tactile precision.
When instructed to provide a specific number '31', we found high precision (M = 31.01; SD = 3.28), with 87.0% of subjects scoring between 30-32.
We found no meaningful predictors (e.g., sex, age, education, BMI) influencing tactile precision.
@mahelmich.bsky.social, Hoffart & Johnson.
1: Ubiquity of digital technologies (ESM/EMA) has increased assessment of individuals' thoughts, behaviors & experiences via electronic devices, often measured via VAS.
Two commonly used forms include a) unipolar (0-100) & b) bipolar (e.g. -50 to 50) VAS.
1: Ubiquity of digital technologies (ESM/EMA) has increased assessment of individuals' thoughts, behaviors & experiences via electronic devices, often measured via VAS.
Two commonly used forms include a) unipolar (0-100) & b) bipolar (e.g. -50 to 50) VAS.
February 7, 2025 at 11:59 AM
@mahelmich.bsky.social, Hoffart & Johnson.
1: Ubiquity of digital technologies (ESM/EMA) has increased assessment of individuals' thoughts, behaviors & experiences via electronic devices, often measured via VAS.
Two commonly used forms include a) unipolar (0-100) & b) bipolar (e.g. -50 to 50) VAS.
1: Ubiquity of digital technologies (ESM/EMA) has increased assessment of individuals' thoughts, behaviors & experiences via electronic devices, often measured via VAS.
Two commonly used forms include a) unipolar (0-100) & b) bipolar (e.g. -50 to 50) VAS.

December 18, 2024 at 4:40 PM
6:
🇬🇧 In UK, anxiety & depression show a U-shaped curve: Highest in urban centers & rural areas, lowest in semi-urban zones
🇳🇿 New Zealand: Anxiety higher in urban areas & depression shows no variation by urbanity
🇳🇴 Norway: Rural areas show the highest rates of both depressive & anxiety disorders
🇬🇧 In UK, anxiety & depression show a U-shaped curve: Highest in urban centers & rural areas, lowest in semi-urban zones
🇳🇿 New Zealand: Anxiety higher in urban areas & depression shows no variation by urbanity
🇳🇴 Norway: Rural areas show the highest rates of both depressive & anxiety disorders


December 16, 2024 at 1:53 PM
6:
🇬🇧 In UK, anxiety & depression show a U-shaped curve: Highest in urban centers & rural areas, lowest in semi-urban zones
🇳🇿 New Zealand: Anxiety higher in urban areas & depression shows no variation by urbanity
🇳🇴 Norway: Rural areas show the highest rates of both depressive & anxiety disorders
🇬🇧 In UK, anxiety & depression show a U-shaped curve: Highest in urban centers & rural areas, lowest in semi-urban zones
🇳🇿 New Zealand: Anxiety higher in urban areas & depression shows no variation by urbanity
🇳🇴 Norway: Rural areas show the highest rates of both depressive & anxiety disorders
4 | Using a continuous measure of urbanicity developed by Finnemann et al, we examined the relationship between urbanicity and prevalence of mental disorders across:
- UK (N = 449,323)
- New Zealand (N = 33,042)
- Norway (N = 13,238)
Measure found here:
www.science.org/doi/10.1126/...
- UK (N = 449,323)
- New Zealand (N = 33,042)
- Norway (N = 13,238)
Measure found here:
www.science.org/doi/10.1126/...

December 16, 2024 at 1:53 PM
4 | Using a continuous measure of urbanicity developed by Finnemann et al, we examined the relationship between urbanicity and prevalence of mental disorders across:
- UK (N = 449,323)
- New Zealand (N = 33,042)
- Norway (N = 13,238)
Measure found here:
www.science.org/doi/10.1126/...
- UK (N = 449,323)
- New Zealand (N = 33,042)
- Norway (N = 13,238)
Measure found here:
www.science.org/doi/10.1126/...