


Michał Wypych
@mwypych.bsky.social
R / Shiny dev
Background in academia
#rstats | #python | #dataviz | #rshiny
https://mic-wypych.github.io/
Background in academia
#rstats | #python | #dataviz | #rshiny
https://mic-wypych.github.io/
Does anyone know of good extensions foe editing excel files that work in #positron? I tried excel viewer but it shows those weird notifications from wijmo.
I'm trying to convince my colleagues to give it a try (they currently use Rstudio) and that would be a great thing for them.
#rstats
I'm trying to convince my colleagues to give it a try (they currently use Rstudio) and that would be a great thing for them.
#rstats
November 5, 2025 at 1:33 PM
Anyone had a similar issue after the latest positron update?
I updated positron to the latest version and keep getting issues with extensions: "Some extensions are disabled due to version incompatibility". The extensions affected are e.g. Air so I guess they should be working?
#rstats #postrion
I updated positron to the latest version and keep getting issues with extensions: "Some extensions are disabled due to version incompatibility". The extensions affected are e.g. Air so I guess they should be working?
#rstats #postrion
October 13, 2025 at 8:00 AM
Basketball #tidytuesday
Adventures in {grid} part 2, tried to make a basketball court.
code: github.com/mic-wypych/t...
#rstats | #dataviz | #ggplot2
Adventures in {grid} part 2, tried to make a basketball court.
code: github.com/mic-wypych/t...
#rstats | #dataviz | #ggplot2

October 9, 2025 at 8:19 PM
Basketball #tidytuesday
Adventures in {grid} part 2, tried to make a basketball court.
code: github.com/mic-wypych/t...
#rstats | #dataviz | #ggplot2
Adventures in {grid} part 2, tried to make a basketball court.
code: github.com/mic-wypych/t...
#rstats | #dataviz | #ggplot2
only a week late to #Tidytuesday!
I started learning {grid} and while it's great its. so. many. iterations. One thing I learned so far: always draw by hand before coding!
#rstats | #dataviz | #ggplot2
I started learning {grid} and while it's great its. so. many. iterations. One thing I learned so far: always draw by hand before coding!
#rstats | #dataviz | #ggplot2

October 3, 2025 at 8:40 AM
only a week late to #Tidytuesday!
I started learning {grid} and while it's great its. so. many. iterations. One thing I learned so far: always draw by hand before coding!
#rstats | #dataviz | #ggplot2
I started learning {grid} and while it's great its. so. many. iterations. One thing I learned so far: always draw by hand before coding!
#rstats | #dataviz | #ggplot2
#tidytuesday
I looked at most active frog spotters and made a hopping cumulative plot.
code: github.com/mic-wypych/t...
#rstats #dataviz #ggplot2
I looked at most active frog spotters and made a hopping cumulative plot.
code: github.com/mic-wypych/t...
#rstats #dataviz #ggplot2

September 3, 2025 at 8:42 PM
#tidytuesday
I looked at most active frog spotters and made a hopping cumulative plot.
code: github.com/mic-wypych/t...
#rstats #dataviz #ggplot2
I looked at most active frog spotters and made a hopping cumulative plot.
code: github.com/mic-wypych/t...
#rstats #dataviz #ggplot2
I just won a very unfair battle with {renv} and I'm really proud.
Only had to reinstall R, add 4 system level dependencies and a few other things along the way...
#rstats
Only had to reinstall R, add 4 system level dependencies and a few other things along the way...
#rstats
August 22, 2025 at 8:06 AM
I just won a very unfair battle with {renv} and I'm really proud.
Only had to reinstall R, add 4 system level dependencies and a few other things along the way...
#rstats
Only had to reinstall R, add 4 system level dependencies and a few other things along the way...
#rstats
Another #tidytuesday.
I looked at inequality data for Poland from 1986 to 2023.
This one was largely inspired by W.E.B. Du Bois.
code: github.com/mic-wypych/t...
I love {ggforce} and the myriad options it opens.
#rstats #dataviz #ggplot2
I looked at inequality data for Poland from 1986 to 2023.
This one was largely inspired by W.E.B. Du Bois.
code: github.com/mic-wypych/t...
I love {ggforce} and the myriad options it opens.
#rstats #dataviz #ggplot2

August 8, 2025 at 7:38 PM
Another #tidytuesday.
I looked at inequality data for Poland from 1986 to 2023.
This one was largely inspired by W.E.B. Du Bois.
code: github.com/mic-wypych/t...
I love {ggforce} and the myriad options it opens.
#rstats #dataviz #ggplot2
I looked at inequality data for Poland from 1986 to 2023.
This one was largely inspired by W.E.B. Du Bois.
code: github.com/mic-wypych/t...
I love {ggforce} and the myriad options it opens.
#rstats #dataviz #ggplot2
I just got my copy of "Chart Art" for which I was super excited! The book arrived... but it's all in black and white. I'm not sure if the book is actually black and white (the reviews seems to suggest its not?) or sth is wrong with my copy?
Has this happened to anyone?
#dataviz #datavisualization
Has this happened to anyone?
#dataviz #datavisualization
August 6, 2025 at 7:29 PM
I just got my copy of "Chart Art" for which I was super excited! The book arrived... but it's all in black and white. I'm not sure if the book is actually black and white (the reviews seems to suggest its not?) or sth is wrong with my copy?
Has this happened to anyone?
#dataviz #datavisualization
Has this happened to anyone?
#dataviz #datavisualization
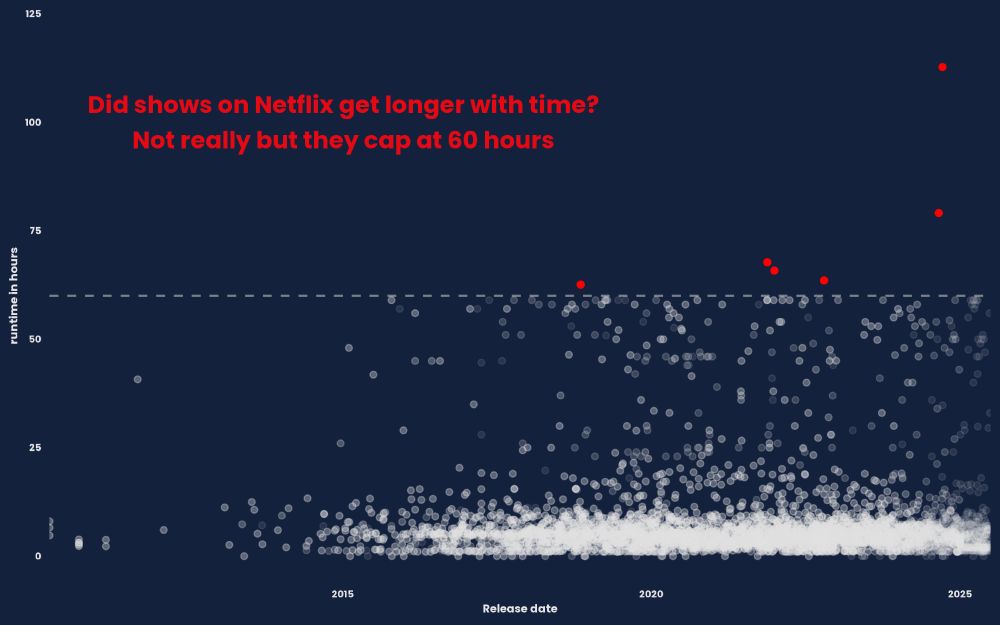
#tidytuesday
Did shows on Netflix get longer with time? Not really but interestingly they cap at 60 hours with very few longer shows.
code: github.com/mic-wypych/t...
#rstats #ggplot2 #dataviz
Did shows on Netflix get longer with time? Not really but interestingly they cap at 60 hours with very few longer shows.
code: github.com/mic-wypych/t...
#rstats #ggplot2 #dataviz
August 3, 2025 at 7:46 PM
#tidytuesday
Did shows on Netflix get longer with time? Not really but interestingly they cap at 60 hours with very few longer shows.
code: github.com/mic-wypych/t...
#rstats #ggplot2 #dataviz
Did shows on Netflix get longer with time? Not really but interestingly they cap at 60 hours with very few longer shows.
code: github.com/mic-wypych/t...
#rstats #ggplot2 #dataviz
#Tidytuesday
I looked at categories of funding of British Library. Sadly, all of them are down in 2023 with the peak in funding in 2006.
code: github.com/mic-wypych/t...
#rstats | #ggplot2 | #dataviz
I looked at categories of funding of British Library. Sadly, all of them are down in 2023 with the peak in funding in 2006.
code: github.com/mic-wypych/t...
#rstats | #ggplot2 | #dataviz

July 19, 2025 at 8:13 PM
#Tidytuesday
I looked at categories of funding of British Library. Sadly, all of them are down in 2023 with the peak in funding in 2006.
code: github.com/mic-wypych/t...
#rstats | #ggplot2 | #dataviz
I looked at categories of funding of British Library. Sadly, all of them are down in 2023 with the peak in funding in 2006.
code: github.com/mic-wypych/t...
#rstats | #ggplot2 | #dataviz
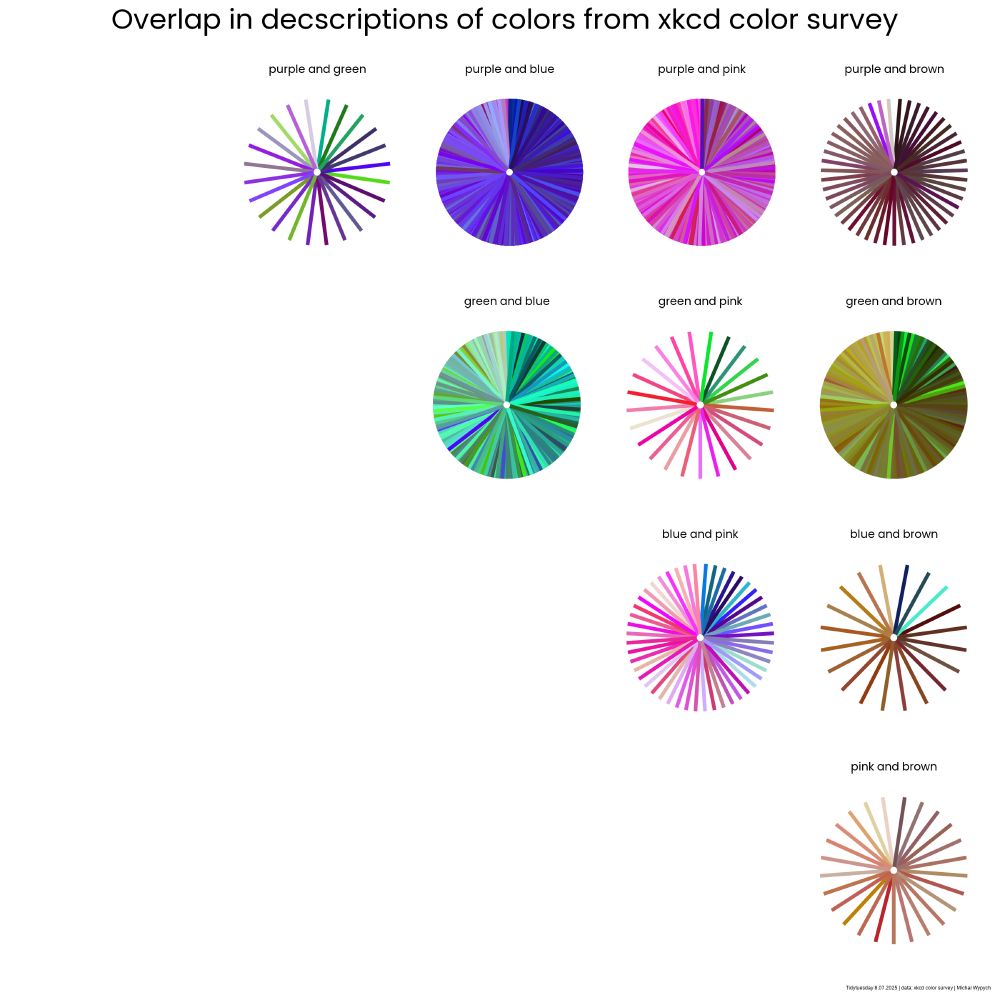
#tidytuesday about colors from the xkcd color survey!
Colors are always fun to work with. I looked at overlaps in descriptions of colors given by participants of the survey.
code: github.com/mic-wypych/t...
#rstats #dataviz #ggplot2
Colors are always fun to work with. I looked at overlaps in descriptions of colors given by participants of the survey.
code: github.com/mic-wypych/t...
#rstats #dataviz #ggplot2
July 9, 2025 at 7:59 PM
#tidytuesday about colors from the xkcd color survey!
Colors are always fun to work with. I looked at overlaps in descriptions of colors given by participants of the survey.
code: github.com/mic-wypych/t...
#rstats #dataviz #ggplot2
Colors are always fun to work with. I looked at overlaps in descriptions of colors given by participants of the survey.
code: github.com/mic-wypych/t...
#rstats #dataviz #ggplot2
This #Tidytuesday I looked at weekly gasoline prices in EU and US and the 2014 and 2022 invasions by Russia. Data for EU grabbed from EU weekly oil bulletin
If you want to support Ukraine and brush up some data skills consider Workshops for Ukraine by @dariia.bsky.social!
#ggplot2 #dataviz #rstats
If you want to support Ukraine and brush up some data skills consider Workshops for Ukraine by @dariia.bsky.social!
#ggplot2 #dataviz #rstats

July 1, 2025 at 8:55 AM
This #Tidytuesday I looked at weekly gasoline prices in EU and US and the 2014 and 2022 invasions by Russia. Data for EU grabbed from EU weekly oil bulletin
If you want to support Ukraine and brush up some data skills consider Workshops for Ukraine by @dariia.bsky.social!
#ggplot2 #dataviz #rstats
If you want to support Ukraine and brush up some data skills consider Workshops for Ukraine by @dariia.bsky.social!
#ggplot2 #dataviz #rstats
For this #TidyTuesday I made an animation showing measles lab confirmed cases per 100k in EU.
Animation with {gganimate}, legend added with weird {magick} tricks.
I'm not fully satisfied with this one, working with animations is tough!
code: github.com/mic-wypych/t...
#rstats #ggplot2 #dataviz
Animation with {gganimate}, legend added with weird {magick} tricks.
I'm not fully satisfied with this one, working with animations is tough!
code: github.com/mic-wypych/t...
#rstats #ggplot2 #dataviz
June 25, 2025 at 7:44 PM
For this #TidyTuesday I made an animation showing measles lab confirmed cases per 100k in EU.
Animation with {gganimate}, legend added with weird {magick} tricks.
I'm not fully satisfied with this one, working with animations is tough!
code: github.com/mic-wypych/t...
#rstats #ggplot2 #dataviz
Animation with {gganimate}, legend added with weird {magick} tricks.
I'm not fully satisfied with this one, working with animations is tough!
code: github.com/mic-wypych/t...
#rstats #ggplot2 #dataviz
#tidytuesday week 24
I was curious about most common licenses used in the APIs, their categories and providers. Made simple plots but wanted to combine them together.
code: github.com/mic-wypych/t...
#rstats #dataviz #ggplot2
I was curious about most common licenses used in the APIs, their categories and providers. Made simple plots but wanted to combine them together.
code: github.com/mic-wypych/t...
#rstats #dataviz #ggplot2

June 17, 2025 at 10:16 AM
#tidytuesday week 24
I was curious about most common licenses used in the APIs, their categories and providers. Made simple plots but wanted to combine them together.
code: github.com/mic-wypych/t...
#rstats #dataviz #ggplot2
I was curious about most common licenses used in the APIs, their categories and providers. Made simple plots but wanted to combine them together.
code: github.com/mic-wypych/t...
#rstats #dataviz #ggplot2
#tidytuesday week 23.
I looked at judge appointments by US presidents and parties.
The record goes to Reagan with 387 nominations (both terms).
Data with beginning and end of term for each president are from Kaggle US presidents dataset.
code: github.com/mic-wypych/t...
#rstats #ggplot2 #dataviz
I looked at judge appointments by US presidents and parties.
The record goes to Reagan with 387 nominations (both terms).
Data with beginning and end of term for each president are from Kaggle US presidents dataset.
code: github.com/mic-wypych/t...
#rstats #ggplot2 #dataviz

June 11, 2025 at 7:41 PM
#tidytuesday week 23.
I looked at judge appointments by US presidents and parties.
The record goes to Reagan with 387 nominations (both terms).
Data with beginning and end of term for each president are from Kaggle US presidents dataset.
code: github.com/mic-wypych/t...
#rstats #ggplot2 #dataviz
I looked at judge appointments by US presidents and parties.
The record goes to Reagan with 387 nominations (both terms).
Data with beginning and end of term for each president are from Kaggle US presidents dataset.
code: github.com/mic-wypych/t...
#rstats #ggplot2 #dataviz
#tidytuesday, this time about the gutenberg project!
I looked at coauthors - what are the age differences and what are the most common collections of coauthored books.
For me this one was a lot more about wrangling the data than making a plot.
code: github.com/mic-wypych/t...
#dataviz #rstats
I looked at coauthors - what are the age differences and what are the most common collections of coauthored books.
For me this one was a lot more about wrangling the data than making a plot.
code: github.com/mic-wypych/t...
#dataviz #rstats

June 5, 2025 at 12:16 PM
#tidytuesday, this time about the gutenberg project!
I looked at coauthors - what are the age differences and what are the most common collections of coauthored books.
For me this one was a lot more about wrangling the data than making a plot.
code: github.com/mic-wypych/t...
#dataviz #rstats
I looked at coauthors - what are the age differences and what are the most common collections of coauthored books.
For me this one was a lot more about wrangling the data than making a plot.
code: github.com/mic-wypych/t...
#dataviz #rstats
I made a #shiny app! It allows you to check mean wages across a number of years at county level in Poland.
A few minor tweaks are left to do but it works!
Sorry to any non-Polish speakers, it's in Polish for now.
link: micwypych-guswages.share.connect.posit.cloud
#rstats #dataviz
A few minor tweaks are left to do but it works!
Sorry to any non-Polish speakers, it's in Polish for now.
link: micwypych-guswages.share.connect.posit.cloud
#rstats #dataviz
Ta aplikacja pozwala sprawdzić średnie pensje na poziomie powiatu od 2002 do 2023 roku. Wybierz rok aby zobaczyć mapę powiatów i rozkład pensji. W zakładkach można zobaczyć porównanie powiatów w danym roku oraz zmiany pensji w czasie
micwypych-guswages.share.connect.posit.cloud
May 19, 2025 at 7:18 PM
I made a #shiny app! It allows you to check mean wages across a number of years at county level in Poland.
A few minor tweaks are left to do but it works!
Sorry to any non-Polish speakers, it's in Polish for now.
link: micwypych-guswages.share.connect.posit.cloud
#rstats #dataviz
A few minor tweaks are left to do but it works!
Sorry to any non-Polish speakers, it's in Polish for now.
link: micwypych-guswages.share.connect.posit.cloud
#rstats #dataviz
This #Tidytuesday is about the 2025 #UseR conference!
I made a simple interactive plotly schedule for the event. You can browse the talks and look up the dates, times, speakers and abstracts.
Working version: mic-wypych.github.io/user2025_sch...
code: github.com/mic-wypych/t...
#rstats #dataviz
I made a simple interactive plotly schedule for the event. You can browse the talks and look up the dates, times, speakers and abstracts.
Working version: mic-wypych.github.io/user2025_sch...
code: github.com/mic-wypych/t...
#rstats #dataviz

April 30, 2025 at 8:58 AM
This #Tidytuesday is about the 2025 #UseR conference!
I made a simple interactive plotly schedule for the event. You can browse the talks and look up the dates, times, speakers and abstracts.
Working version: mic-wypych.github.io/user2025_sch...
code: github.com/mic-wypych/t...
#rstats #dataviz
I made a simple interactive plotly schedule for the event. You can browse the talks and look up the dates, times, speakers and abstracts.
Working version: mic-wypych.github.io/user2025_sch...
code: github.com/mic-wypych/t...
#rstats #dataviz
Made my first #quarto extension with #Typst!
Does anyone know how to store a quarto extension (and use it in a team) if I can't put it as a public repo on github? Ideally it would still be in version control (e.g. can I keep it on private github repo and push as zip to some google drive?)
#rstats
Does anyone know how to store a quarto extension (and use it in a team) if I can't put it as a public repo on github? Ideally it would still be in version control (e.g. can I keep it on private github repo and push as zip to some google drive?)
#rstats

April 16, 2025 at 8:01 AM
Little late to #tidytuesday. This time I made a simple ggiraph that shows ranks of each state in various waiting time measures.
code: github.com/mic-wypych/t...
#rstats #dataviz
code: github.com/mic-wypych/t...
#rstats #dataviz

April 12, 2025 at 9:40 AM
Little late to #tidytuesday. This time I made a simple ggiraph that shows ranks of each state in various waiting time measures.
code: github.com/mic-wypych/t...
#rstats #dataviz
code: github.com/mic-wypych/t...
#rstats #dataviz
This week in #Tidytuesday I'm looking at top 5 ranked Pokemons in attack, defense and HP across generations. Defense and HP are way more stable than attack!
It was fun thinking how to work on the generations to make this plot.
code: github.com/mic-wypych/t...
#rstats #dataviz #ggplot2
It was fun thinking how to work on the generations to make this plot.
code: github.com/mic-wypych/t...
#rstats #dataviz #ggplot2

April 3, 2025 at 9:30 AM
This week in #Tidytuesday I'm looking at top 5 ranked Pokemons in attack, defense and HP across generations. Defense and HP are way more stable than attack!
It was fun thinking how to work on the generations to make this plot.
code: github.com/mic-wypych/t...
#rstats #dataviz #ggplot2
It was fun thinking how to work on the generations to make this plot.
code: github.com/mic-wypych/t...
#rstats #dataviz #ggplot2
Does anyone know of good materials on suppression from #causalinference perspective? Papers about suppression usually say only about predictive power. And I think some of the stuff in McElreath's lectures (esp. lecture 6) suggests adding suppressors would bias stuff? I'm confused
#rstats #stats
#rstats #stats
March 4, 2025 at 12:24 PM
Does anyone know of good materials on suppression from #causalinference perspective? Papers about suppression usually say only about predictive power. And I think some of the stuff in McElreath's lectures (esp. lecture 6) suggests adding suppressors would bias stuff? I'm confused
#rstats #stats
#rstats #stats
Simple #tidytuesday week 5: it's donuts! 🍩
Donut chart of Simpsons: who spoke the most words.
#Dataviz in #rstats
code: github.com/mic-wypych/t...
Donut chart of Simpsons: who spoke the most words.
#Dataviz in #rstats
code: github.com/mic-wypych/t...

February 5, 2025 at 9:39 AM
Simple #tidytuesday week 5: it's donuts! 🍩
Donut chart of Simpsons: who spoke the most words.
#Dataviz in #rstats
code: github.com/mic-wypych/t...
Donut chart of Simpsons: who spoke the most words.
#Dataviz in #rstats
code: github.com/mic-wypych/t...


January 21, 2025 at 11:09 AM