


Matthew Spuffard
@matthewspuffard.bsky.social
Expert in Data, Analytics & Project Controls | BaseOne.uk | Helping businesses make better decisions!
https://www.linkedin.com/in/matthewspuffard/
https://www.linkedin.com/in/matthewspuffard/
How to Choose Perfect Colours in Power BI 🎨
✔️ Use your brand palette for consistency
✔️ Let colours tell a story (green = growth, red = risks)
✔️ Keep backgrounds neutral for focus
Read all 10 tips on LinkedIn: Matthew Spuffard 🚀
#PowerBI #DataVisualization #ColourDesign #BaseOne #MatthewSpuffard
✔️ Use your brand palette for consistency
✔️ Let colours tell a story (green = growth, red = risks)
✔️ Keep backgrounds neutral for focus
Read all 10 tips on LinkedIn: Matthew Spuffard 🚀
#PowerBI #DataVisualization #ColourDesign #BaseOne #MatthewSpuffard

February 26, 2025 at 8:30 AM
How to Choose Perfect Colours in Power BI 🎨
✔️ Use your brand palette for consistency
✔️ Let colours tell a story (green = growth, red = risks)
✔️ Keep backgrounds neutral for focus
Read all 10 tips on LinkedIn: Matthew Spuffard 🚀
#PowerBI #DataVisualization #ColourDesign #BaseOne #MatthewSpuffard
✔️ Use your brand palette for consistency
✔️ Let colours tell a story (green = growth, red = risks)
✔️ Keep backgrounds neutral for focus
Read all 10 tips on LinkedIn: Matthew Spuffard 🚀
#PowerBI #DataVisualization #ColourDesign #BaseOne #MatthewSpuffard
Stand out as a Power BI developer! 🚀
Create a Power BI Portfolio Pack:
✔️ Showcase your best work in a PDF
✔️ Tell stories with data 📊
✔️ Include links to live dashboards
A portfolio can land your next job. Read the full post on LinkedIn: Matthew Spuffard 🚀
#PowerBI #DataVisualization #CareerTips
Create a Power BI Portfolio Pack:
✔️ Showcase your best work in a PDF
✔️ Tell stories with data 📊
✔️ Include links to live dashboards
A portfolio can land your next job. Read the full post on LinkedIn: Matthew Spuffard 🚀
#PowerBI #DataVisualization #CareerTips

February 21, 2025 at 8:30 AM
Stand out as a Power BI developer! 🚀
Create a Power BI Portfolio Pack:
✔️ Showcase your best work in a PDF
✔️ Tell stories with data 📊
✔️ Include links to live dashboards
A portfolio can land your next job. Read the full post on LinkedIn: Matthew Spuffard 🚀
#PowerBI #DataVisualization #CareerTips
Create a Power BI Portfolio Pack:
✔️ Showcase your best work in a PDF
✔️ Tell stories with data 📊
✔️ Include links to live dashboards
A portfolio can land your next job. Read the full post on LinkedIn: Matthew Spuffard 🚀
#PowerBI #DataVisualization #CareerTips
My career journey: From art school to Power BI 🌟
Turns out every detour brought me closer to combining my passions:
🎨 Design
📊 Data
🛠️ Automation
Life’s twists lead you where you’re meant to be. Read the full post: Matthew Spuffard 🚀 linkedin.com/feed/up...
#PowerBI #CareerJourney #DataDriven
Turns out every detour brought me closer to combining my passions:
🎨 Design
📊 Data
🛠️ Automation
Life’s twists lead you where you’re meant to be. Read the full post: Matthew Spuffard 🚀 linkedin.com/feed/up...
#PowerBI #CareerJourney #DataDriven

February 19, 2025 at 8:31 AM
My career journey: From art school to Power BI 🌟
Turns out every detour brought me closer to combining my passions:
🎨 Design
📊 Data
🛠️ Automation
Life’s twists lead you where you’re meant to be. Read the full post: Matthew Spuffard 🚀 linkedin.com/feed/up...
#PowerBI #CareerJourney #DataDriven
Turns out every detour brought me closer to combining my passions:
🎨 Design
📊 Data
🛠️ Automation
Life’s twists lead you where you’re meant to be. Read the full post: Matthew Spuffard 🚀 linkedin.com/feed/up...
#PowerBI #CareerJourney #DataDriven
How life’s detours led me to my dream career 🌟
From art school to IT, planning and Power BI, every step brought me closer to combining my passions for design, branding and data.
Read the full story on LinkedIn: Matthew Spuffard 🚀 linkedin.com/feed/up...
#CareerJourney #DataDesign #Passion
From art school to IT, planning and Power BI, every step brought me closer to combining my passions for design, branding and data.
Read the full story on LinkedIn: Matthew Spuffard 🚀 linkedin.com/feed/up...
#CareerJourney #DataDesign #Passion
February 19, 2025 at 8:30 AM
How life’s detours led me to my dream career 🌟
From art school to IT, planning and Power BI, every step brought me closer to combining my passions for design, branding and data.
Read the full story on LinkedIn: Matthew Spuffard 🚀 linkedin.com/feed/up...
#CareerJourney #DataDesign #Passion
From art school to IT, planning and Power BI, every step brought me closer to combining my passions for design, branding and data.
Read the full story on LinkedIn: Matthew Spuffard 🚀 linkedin.com/feed/up...
#CareerJourney #DataDesign #Passion
Maximise #MicrosoftFabric with Team BI! 🚀
Here’s how:
1️⃣ Build & connect reports in Power BI Desktop
2️⃣ Publish to shared workspaces for collaboration
3️⃣ Work in Teams for easy report discussion
4️⃣ Automate updates to stay current
Full guide on LinkedIn: Matthew Spuffard 🚀
#PowerBI #TeamBI
Here’s how:
1️⃣ Build & connect reports in Power BI Desktop
2️⃣ Publish to shared workspaces for collaboration
3️⃣ Work in Teams for easy report discussion
4️⃣ Automate updates to stay current
Full guide on LinkedIn: Matthew Spuffard 🚀
#PowerBI #TeamBI

February 17, 2025 at 9:30 AM
Maximise #MicrosoftFabric with Team BI! 🚀
Here’s how:
1️⃣ Build & connect reports in Power BI Desktop
2️⃣ Publish to shared workspaces for collaboration
3️⃣ Work in Teams for easy report discussion
4️⃣ Automate updates to stay current
Full guide on LinkedIn: Matthew Spuffard 🚀
#PowerBI #TeamBI
Here’s how:
1️⃣ Build & connect reports in Power BI Desktop
2️⃣ Publish to shared workspaces for collaboration
3️⃣ Work in Teams for easy report discussion
4️⃣ Automate updates to stay current
Full guide on LinkedIn: Matthew Spuffard 🚀
#PowerBI #TeamBI
Your Power BI dashboard is only as good as the questions it answers. 🎯
✔️ Tell a story
✔️ Solve problems, not add noise
✔️ Focus on clarity over complexity
For the full insights, visit LinkedIn: Matthew Spuffard 🚀
linkedin.com/in/matt...
#PowerBI #DataVisualization #BusinessIntelligence
✔️ Tell a story
✔️ Solve problems, not add noise
✔️ Focus on clarity over complexity
For the full insights, visit LinkedIn: Matthew Spuffard 🚀
linkedin.com/in/matt...
#PowerBI #DataVisualization #BusinessIntelligence

February 14, 2025 at 8:30 AM
Your Power BI dashboard is only as good as the questions it answers. 🎯
✔️ Tell a story
✔️ Solve problems, not add noise
✔️ Focus on clarity over complexity
For the full insights, visit LinkedIn: Matthew Spuffard 🚀
linkedin.com/in/matt...
#PowerBI #DataVisualization #BusinessIntelligence
✔️ Tell a story
✔️ Solve problems, not add noise
✔️ Focus on clarity over complexity
For the full insights, visit LinkedIn: Matthew Spuffard 🚀
linkedin.com/in/matt...
#PowerBI #DataVisualization #BusinessIntelligence
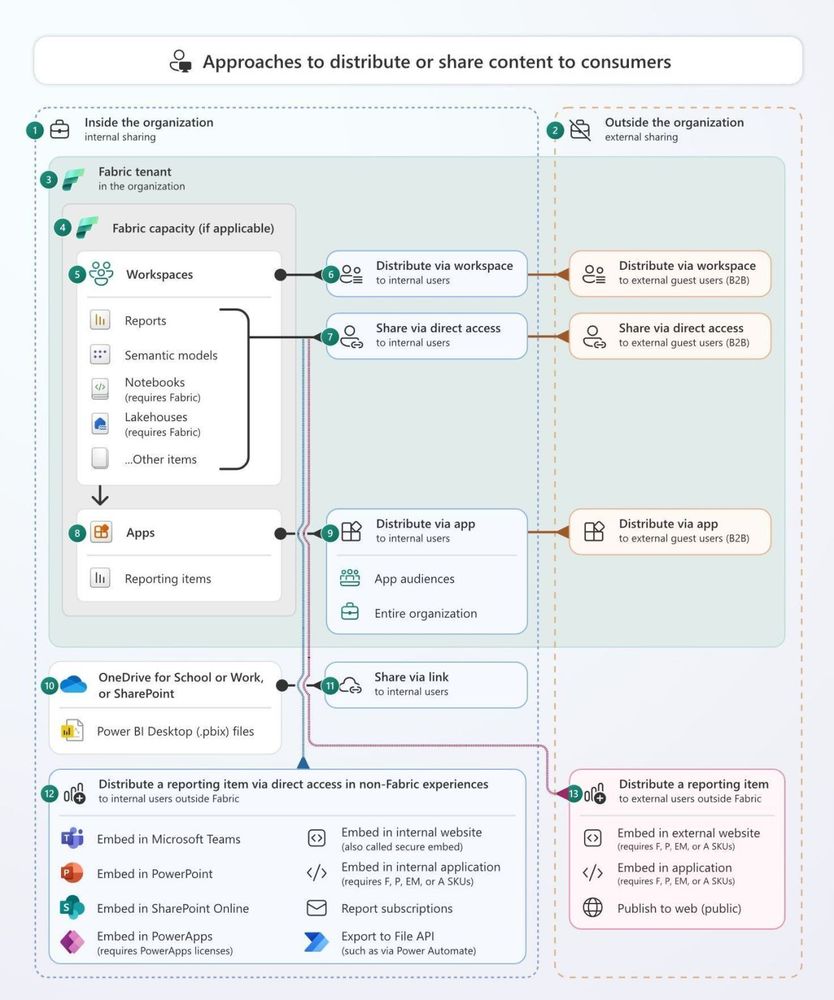
Maximise Your Power BI Sharing Strategy 📊
✔️ Tailor content for your audience 🎯
✔️ Use the right distribution methods 🛠️
✔️ Secure data with permissions 🔒
✔️ Optimise report performance ⚡
Get the full guide on LinkedIn: Matthew Spuffard 🚀
#PowerBI #DataSharing #DataDriven
✔️ Tailor content for your audience 🎯
✔️ Use the right distribution methods 🛠️
✔️ Secure data with permissions 🔒
✔️ Optimise report performance ⚡
Get the full guide on LinkedIn: Matthew Spuffard 🚀
#PowerBI #DataSharing #DataDriven
February 12, 2025 at 8:30 AM
Maximise Your Power BI Sharing Strategy 📊
✔️ Tailor content for your audience 🎯
✔️ Use the right distribution methods 🛠️
✔️ Secure data with permissions 🔒
✔️ Optimise report performance ⚡
Get the full guide on LinkedIn: Matthew Spuffard 🚀
#PowerBI #DataSharing #DataDriven
✔️ Tailor content for your audience 🎯
✔️ Use the right distribution methods 🛠️
✔️ Secure data with permissions 🔒
✔️ Optimise report performance ⚡
Get the full guide on LinkedIn: Matthew Spuffard 🚀
#PowerBI #DataSharing #DataDriven
Make Power BI reports pop with Theme Packs! 🎨📊
✅ Pre-styled charts for consistency
✅ Brand-matching colours & fonts
✅ Grids, editable design files & custom maps
✅ Easy-to-use with step-by-step instructions
Learn more on LinkedIn: Matthew Spuffard 🚀
#PowerBI #DataDesign #UIUX
✅ Pre-styled charts for consistency
✅ Brand-matching colours & fonts
✅ Grids, editable design files & custom maps
✅ Easy-to-use with step-by-step instructions
Learn more on LinkedIn: Matthew Spuffard 🚀
#PowerBI #DataDesign #UIUX

February 10, 2025 at 9:30 AM
Make Power BI reports pop with Theme Packs! 🎨📊
✅ Pre-styled charts for consistency
✅ Brand-matching colours & fonts
✅ Grids, editable design files & custom maps
✅ Easy-to-use with step-by-step instructions
Learn more on LinkedIn: Matthew Spuffard 🚀
#PowerBI #DataDesign #UIUX
✅ Pre-styled charts for consistency
✅ Brand-matching colours & fonts
✅ Grids, editable design files & custom maps
✅ Easy-to-use with step-by-step instructions
Learn more on LinkedIn: Matthew Spuffard 🚀
#PowerBI #DataDesign #UIUX
Business Intelligence Done Right 📊
Great #BI comes from asking the right questions and understanding client needs.
Check out all 20 questions on LinkedIn and take your BI strategy to the next level: Matthew Spuffard 🚀
#PowerBI #DataAnalytics #ClientSuccess
Great #BI comes from asking the right questions and understanding client needs.
Check out all 20 questions on LinkedIn and take your BI strategy to the next level: Matthew Spuffard 🚀
#PowerBI #DataAnalytics #ClientSuccess

February 7, 2025 at 8:30 AM
Business Intelligence Done Right 📊
Great #BI comes from asking the right questions and understanding client needs.
Check out all 20 questions on LinkedIn and take your BI strategy to the next level: Matthew Spuffard 🚀
#PowerBI #DataAnalytics #ClientSuccess
Great #BI comes from asking the right questions and understanding client needs.
Check out all 20 questions on LinkedIn and take your BI strategy to the next level: Matthew Spuffard 🚀
#PowerBI #DataAnalytics #ClientSuccess
Data Density vs. Minimalism in Power BI: Get it right! ⚖️
✔️ Highlight key metrics 🎯
✔️ Use layers (drill-throughs, tooltips) for depth 🧩
✔️ Keep layouts structured 🖼️
✔️ Test for user clarity 🧠
Dense yet intuitive dashboards = better insights. Full guide on LinkedIn: Matthew Spuffard 🚀
✔️ Highlight key metrics 🎯
✔️ Use layers (drill-throughs, tooltips) for depth 🧩
✔️ Keep layouts structured 🖼️
✔️ Test for user clarity 🧠
Dense yet intuitive dashboards = better insights. Full guide on LinkedIn: Matthew Spuffard 🚀

February 5, 2025 at 9:30 AM
Data Density vs. Minimalism in Power BI: Get it right! ⚖️
✔️ Highlight key metrics 🎯
✔️ Use layers (drill-throughs, tooltips) for depth 🧩
✔️ Keep layouts structured 🖼️
✔️ Test for user clarity 🧠
Dense yet intuitive dashboards = better insights. Full guide on LinkedIn: Matthew Spuffard 🚀
✔️ Highlight key metrics 🎯
✔️ Use layers (drill-throughs, tooltips) for depth 🧩
✔️ Keep layouts structured 🖼️
✔️ Test for user clarity 🧠
Dense yet intuitive dashboards = better insights. Full guide on LinkedIn: Matthew Spuffard 🚀
10 Power BI Design Tips to Improve Dashboards 🚀
🎨 Highlight key data with colour
🌌 Use white space to avoid clutter
🔝 Visual hierarchy = faster insights
♿ Accessibility makes dashboards usable for everyone
Find the full list on LinkedIn: Matthew Spuffard 🚀
#PowerBI #DataDesign #DashboardTips
🎨 Highlight key data with colour
🌌 Use white space to avoid clutter
🔝 Visual hierarchy = faster insights
♿ Accessibility makes dashboards usable for everyone
Find the full list on LinkedIn: Matthew Spuffard 🚀
#PowerBI #DataDesign #DashboardTips

February 3, 2025 at 9:30 AM
10 Power BI Design Tips to Improve Dashboards 🚀
🎨 Highlight key data with colour
🌌 Use white space to avoid clutter
🔝 Visual hierarchy = faster insights
♿ Accessibility makes dashboards usable for everyone
Find the full list on LinkedIn: Matthew Spuffard 🚀
#PowerBI #DataDesign #DashboardTips
🎨 Highlight key data with colour
🌌 Use white space to avoid clutter
🔝 Visual hierarchy = faster insights
♿ Accessibility makes dashboards usable for everyone
Find the full list on LinkedIn: Matthew Spuffard 🚀
#PowerBI #DataDesign #DashboardTips
Struggling with manual reporting? 🤬 Primer automates P6 + PMO reporting using Power BI + Microsoft Fabric. Customise, brand & create a single source of truth for data! Free your planners from day one & focus on what matters! Visit PrimerP6.com or connect on LinkedIn; Matthew Spuffard 🚀

January 31, 2025 at 9:30 AM
Struggling with manual reporting? 🤬 Primer automates P6 + PMO reporting using Power BI + Microsoft Fabric. Customise, brand & create a single source of truth for data! Free your planners from day one & focus on what matters! Visit PrimerP6.com or connect on LinkedIn; Matthew Spuffard 🚀
Power BI’s bar charts need rounded bars—who agrees? 🙋
Sometimes the smallest changes make the biggest difference. Clean, modern #UIUX can transform how dashboards feel. This design rocks!
For more insights, check out my LinkedIn: Matthew Spuffard 🚀
#PowerBI #DataVisualization #DashboardDesign
Sometimes the smallest changes make the biggest difference. Clean, modern #UIUX can transform how dashboards feel. This design rocks!
For more insights, check out my LinkedIn: Matthew Spuffard 🚀
#PowerBI #DataVisualization #DashboardDesign

January 29, 2025 at 9:30 AM
Power BI’s bar charts need rounded bars—who agrees? 🙋
Sometimes the smallest changes make the biggest difference. Clean, modern #UIUX can transform how dashboards feel. This design rocks!
For more insights, check out my LinkedIn: Matthew Spuffard 🚀
#PowerBI #DataVisualization #DashboardDesign
Sometimes the smallest changes make the biggest difference. Clean, modern #UIUX can transform how dashboards feel. This design rocks!
For more insights, check out my LinkedIn: Matthew Spuffard 🚀
#PowerBI #DataVisualization #DashboardDesign
#PowerBI: Avoid the Waterfall Trap!🚨
Big design upfront inflates costs and delays projects. Instead:
✔️ Deliver analytics early and refine with feedback
✔️ Focus on speed to insight, not perfection
✔️ Be Agile to meet real client needs
Join me on LinkedIn: Matthew Spuffard 🚀
#DataAnalytics #Agile
Big design upfront inflates costs and delays projects. Instead:
✔️ Deliver analytics early and refine with feedback
✔️ Focus on speed to insight, not perfection
✔️ Be Agile to meet real client needs
Join me on LinkedIn: Matthew Spuffard 🚀
#DataAnalytics #Agile

January 27, 2025 at 9:30 AM
#PowerBI: Avoid the Waterfall Trap!🚨
Big design upfront inflates costs and delays projects. Instead:
✔️ Deliver analytics early and refine with feedback
✔️ Focus on speed to insight, not perfection
✔️ Be Agile to meet real client needs
Join me on LinkedIn: Matthew Spuffard 🚀
#DataAnalytics #Agile
Big design upfront inflates costs and delays projects. Instead:
✔️ Deliver analytics early and refine with feedback
✔️ Focus on speed to insight, not perfection
✔️ Be Agile to meet real client needs
Join me on LinkedIn: Matthew Spuffard 🚀
#DataAnalytics #Agile
#PowerBI developers: Are you building for action or impression? 🎯
✔️ Action first: Dashboards should guide
✔️ Simplicity wins: Clear and fast trumps!
✔️ Refine later: Get the message right
For more Power BI tips, check out my LinkedIn: Matthew Spuffard 🚀
#DataAnalytics #ClarityOverComplexity
✔️ Action first: Dashboards should guide
✔️ Simplicity wins: Clear and fast trumps!
✔️ Refine later: Get the message right
For more Power BI tips, check out my LinkedIn: Matthew Spuffard 🚀
#DataAnalytics #ClarityOverComplexity

January 24, 2025 at 9:30 AM
#PowerBI developers: Are you building for action or impression? 🎯
✔️ Action first: Dashboards should guide
✔️ Simplicity wins: Clear and fast trumps!
✔️ Refine later: Get the message right
For more Power BI tips, check out my LinkedIn: Matthew Spuffard 🚀
#DataAnalytics #ClarityOverComplexity
✔️ Action first: Dashboards should guide
✔️ Simplicity wins: Clear and fast trumps!
✔️ Refine later: Get the message right
For more Power BI tips, check out my LinkedIn: Matthew Spuffard 🚀
#DataAnalytics #ClarityOverComplexity
Power BI dashboards should drive decisions, not confusion. 🚀
My top design tips for better dashboards:
🎨 Use Aesthetic Usability
🔝 Prioritise key KPIs
🧠 Simplify
🌈 Use colour purposefully
🖱️ Enable interactivity
For all 10, see my LinkedIn: Matthew Spuffard 🚀
#PowerBI #UIUX #DataAnalytics
My top design tips for better dashboards:
🎨 Use Aesthetic Usability
🔝 Prioritise key KPIs
🧠 Simplify
🌈 Use colour purposefully
🖱️ Enable interactivity
For all 10, see my LinkedIn: Matthew Spuffard 🚀
#PowerBI #UIUX #DataAnalytics

January 22, 2025 at 9:30 AM
Power BI dashboards should drive decisions, not confusion. 🚀
My top design tips for better dashboards:
🎨 Use Aesthetic Usability
🔝 Prioritise key KPIs
🧠 Simplify
🌈 Use colour purposefully
🖱️ Enable interactivity
For all 10, see my LinkedIn: Matthew Spuffard 🚀
#PowerBI #UIUX #DataAnalytics
My top design tips for better dashboards:
🎨 Use Aesthetic Usability
🔝 Prioritise key KPIs
🧠 Simplify
🌈 Use colour purposefully
🖱️ Enable interactivity
For all 10, see my LinkedIn: Matthew Spuffard 🚀
#PowerBI #UIUX #DataAnalytics
#PowerBI Design: Faster, Easier, Better! 🚀
I help teams:
📊 Automate design
🎨 Create consistent reports with brand colours
🗺️ Use custom maps, stock photos, & icons
🖼️ Provide editable files
Want to see how it works? Visit my LinkedIn: Matthew Spuffard linkedin.com/in/matt...🚀
#UIUX
I help teams:
📊 Automate design
🎨 Create consistent reports with brand colours
🗺️ Use custom maps, stock photos, & icons
🖼️ Provide editable files
Want to see how it works? Visit my LinkedIn: Matthew Spuffard linkedin.com/in/matt...🚀
#UIUX

January 20, 2025 at 9:30 AM
#PowerBI Design: Faster, Easier, Better! 🚀
I help teams:
📊 Automate design
🎨 Create consistent reports with brand colours
🗺️ Use custom maps, stock photos, & icons
🖼️ Provide editable files
Want to see how it works? Visit my LinkedIn: Matthew Spuffard linkedin.com/in/matt...🚀
#UIUX
I help teams:
📊 Automate design
🎨 Create consistent reports with brand colours
🗺️ Use custom maps, stock photos, & icons
🖼️ Provide editable files
Want to see how it works? Visit my LinkedIn: Matthew Spuffard linkedin.com/in/matt...🚀
#UIUX
Power BI isn’t just about visuals—it’s about utility. 🎯
Developers goals:
✅ Automate repetitive tasks
✅ Enable users to focus on what matters
✅ Build efficiency first & perfect later with feedback
See more on this approach at my LinkedIn: linkedin.com/in/matt...🚀
#PowerBI
Developers goals:
✅ Automate repetitive tasks
✅ Enable users to focus on what matters
✅ Build efficiency first & perfect later with feedback
See more on this approach at my LinkedIn: linkedin.com/in/matt...🚀
#PowerBI

January 17, 2025 at 9:30 AM
Power BI isn’t just about visuals—it’s about utility. 🎯
Developers goals:
✅ Automate repetitive tasks
✅ Enable users to focus on what matters
✅ Build efficiency first & perfect later with feedback
See more on this approach at my LinkedIn: linkedin.com/in/matt...🚀
#PowerBI
Developers goals:
✅ Automate repetitive tasks
✅ Enable users to focus on what matters
✅ Build efficiency first & perfect later with feedback
See more on this approach at my LinkedIn: linkedin.com/in/matt...🚀
#PowerBI
White space: The secret to better Power BI dashboards🌌
It isn’t empty space—it’s essential!
🧠Reduces cognitive load
🎯Highlights KPIs
📐Creates a clean, professional feel
Learn how to use it effectively on my LinkedIn: Matthew Spuffard linkedin.com/in/matt...🚀
#PowerBI #DataDesign
It isn’t empty space—it’s essential!
🧠Reduces cognitive load
🎯Highlights KPIs
📐Creates a clean, professional feel
Learn how to use it effectively on my LinkedIn: Matthew Spuffard linkedin.com/in/matt...🚀
#PowerBI #DataDesign

January 15, 2025 at 9:30 AM
White space: The secret to better Power BI dashboards🌌
It isn’t empty space—it’s essential!
🧠Reduces cognitive load
🎯Highlights KPIs
📐Creates a clean, professional feel
Learn how to use it effectively on my LinkedIn: Matthew Spuffard linkedin.com/in/matt...🚀
#PowerBI #DataDesign
It isn’t empty space—it’s essential!
🧠Reduces cognitive load
🎯Highlights KPIs
📐Creates a clean, professional feel
Learn how to use it effectively on my LinkedIn: Matthew Spuffard linkedin.com/in/matt...🚀
#PowerBI #DataDesign
⚡ Save time on Power BI report design!
3 simple ways to speed up the process:
1️⃣ Use templates
2️⃣ Apply JSON themes
3️⃣ Use grids
Want the full details? Check out my LinkedIn: Matthew Spuffard linkedin.com/in/matt...🚀
#PowerBI #DesignTips #DataEfficiency
3 simple ways to speed up the process:
1️⃣ Use templates
2️⃣ Apply JSON themes
3️⃣ Use grids
Want the full details? Check out my LinkedIn: Matthew Spuffard linkedin.com/in/matt...🚀
#PowerBI #DesignTips #DataEfficiency

January 13, 2025 at 9:30 AM
⚡ Save time on Power BI report design!
3 simple ways to speed up the process:
1️⃣ Use templates
2️⃣ Apply JSON themes
3️⃣ Use grids
Want the full details? Check out my LinkedIn: Matthew Spuffard linkedin.com/in/matt...🚀
#PowerBI #DesignTips #DataEfficiency
3 simple ways to speed up the process:
1️⃣ Use templates
2️⃣ Apply JSON themes
3️⃣ Use grids
Want the full details? Check out my LinkedIn: Matthew Spuffard linkedin.com/in/matt...🚀
#PowerBI #DesignTips #DataEfficiency
Great UI/UX isn’t optional in data platforms—it’s essential! 🎨
3 of my top 10 principles for intuitive dashboards:
1️⃣ Aesthetic Usability
2️⃣ Visual Hierarchy
3️⃣ Cognitive Load
See full 10 on my LinkedIn: Matthew Spuffard linkedin.com/in/matt...🚀
#UIUX #PowerBI #DashboardTips
3 of my top 10 principles for intuitive dashboards:
1️⃣ Aesthetic Usability
2️⃣ Visual Hierarchy
3️⃣ Cognitive Load
See full 10 on my LinkedIn: Matthew Spuffard linkedin.com/in/matt...🚀
#UIUX #PowerBI #DashboardTips

January 10, 2025 at 9:30 AM
Great UI/UX isn’t optional in data platforms—it’s essential! 🎨
3 of my top 10 principles for intuitive dashboards:
1️⃣ Aesthetic Usability
2️⃣ Visual Hierarchy
3️⃣ Cognitive Load
See full 10 on my LinkedIn: Matthew Spuffard linkedin.com/in/matt...🚀
#UIUX #PowerBI #DashboardTips
3 of my top 10 principles for intuitive dashboards:
1️⃣ Aesthetic Usability
2️⃣ Visual Hierarchy
3️⃣ Cognitive Load
See full 10 on my LinkedIn: Matthew Spuffard linkedin.com/in/matt...🚀
#UIUX #PowerBI #DashboardTips
10 Design Principles for Stunning Power BI Dashboards 🎨✨
Creating dashboards that wow your audience AND deliver insights is an art and a science. Here's how you can combine UI/UX design principles with analytical excellence.
Find out how I do it here!
t.ly/Vq5ou
Join my newsletter
bit.ly/mattsnl
Creating dashboards that wow your audience AND deliver insights is an art and a science. Here's how you can combine UI/UX design principles with analytical excellence.
Find out how I do it here!
t.ly/Vq5ou
Join my newsletter
bit.ly/mattsnl

December 15, 2024 at 10:59 AM
10 Design Principles for Stunning Power BI Dashboards 🎨✨
Creating dashboards that wow your audience AND deliver insights is an art and a science. Here's how you can combine UI/UX design principles with analytical excellence.
Find out how I do it here!
t.ly/Vq5ou
Join my newsletter
bit.ly/mattsnl
Creating dashboards that wow your audience AND deliver insights is an art and a science. Here's how you can combine UI/UX design principles with analytical excellence.
Find out how I do it here!
t.ly/Vq5ou
Join my newsletter
bit.ly/mattsnl