


Matthew Russell
@matteomics.bsky.social
Measurements want to be accurate;
Experiments want to be elegant;
Data wants to be beautiful and Data wants to be free
#proteomics
#rstats
Experiments want to be elegant;
Data wants to be beautiful and Data wants to be free
#proteomics
#rstats
Amazing Halloween decoration up in #Manchester #UK near the Gay Village. A giant pink spider climbing down wall! The wall belongs to an Alice in Wonderland / Through the Looking Glass themed tea room. I love this city.

October 31, 2025 at 10:28 AM
Amazing Halloween decoration up in #Manchester #UK near the Gay Village. A giant pink spider climbing down wall! The wall belongs to an Alice in Wonderland / Through the Looking Glass themed tea room. I love this city.
A super useful #tidyverse function for #bioinformatics in #rstats with deframe().
Get a named vector of linking protein/gene/kegg identifiers and then attach to a table from elsewhere to translate the new tables ids:
Get a named vector of linking protein/gene/kegg identifiers and then attach to a table from elsewhere to translate the new tables ids:
![Example of code described in the text. Reads:
idx_nm_id<-deframe(uniprotkb[,c("protein_name","uniprot")])
CompDT[,Protein.Names:=idx_nm_id[as.character(Protein)]]](https://cdn.bsky.app/img/feed_thumbnail/plain/did:plc:dmcxnpwbe76j27vvmffpaqk3/bafkreignr3ef37hxjkyduznqz6dyc472tzn46jfv5bgt42zelyfvu4pllm@jpeg)
October 23, 2025 at 12:20 PM
A super useful #tidyverse function for #bioinformatics in #rstats with deframe().
Get a named vector of linking protein/gene/kegg identifiers and then attach to a table from elsewhere to translate the new tables ids:
Get a named vector of linking protein/gene/kegg identifiers and then attach to a table from elsewhere to translate the new tables ids:

The way these people talk about #LLM reminds me of this quote from Babbage on dealing with people who didn't understand what his difference engine was doing.

July 16, 2025 at 9:40 AM
The way these people talk about #LLM reminds me of this quote from Babbage on dealing with people who didn't understand what his difference engine was doing.
Genuinely struggle with this. Working in science aimed at innovation for economic impact I want pathways to market. But several devastating UK scandals, to people first but also economy and public finance:

July 15, 2025 at 5:14 PM
Genuinely struggle with this. Working in science aimed at innovation for economic impact I want pathways to market. But several devastating UK scandals, to people first but also economy and public finance:
If you set option thorugh:
options(ellmer_timeout_s = <ms>)
It alters the time out. Should probably go in a .Rprofile file if used often.
See below, I asked qwen2.5-coder about The Lord of the Rings just to test the longer timeout. It's wrong, but close, a bit like the code it produces...
options(ellmer_timeout_s = <ms>)
It alters the time out. Should probably go in a .Rprofile file if used often.
See below, I asked qwen2.5-coder about The Lord of the Rings just to test the longer timeout. It's wrong, but close, a bit like the code it produces...

February 27, 2025 at 12:55 PM
If you set option thorugh:
options(ellmer_timeout_s = <ms>)
It alters the time out. Should probably go in a .Rprofile file if used often.
See below, I asked qwen2.5-coder about The Lord of the Rings just to test the longer timeout. It's wrong, but close, a bit like the code it produces...
options(ellmer_timeout_s = <ms>)
It alters the time out. Should probably go in a .Rprofile file if used often.
See below, I asked qwen2.5-coder about The Lord of the Rings just to test the longer timeout. It's wrong, but close, a bit like the code it produces...
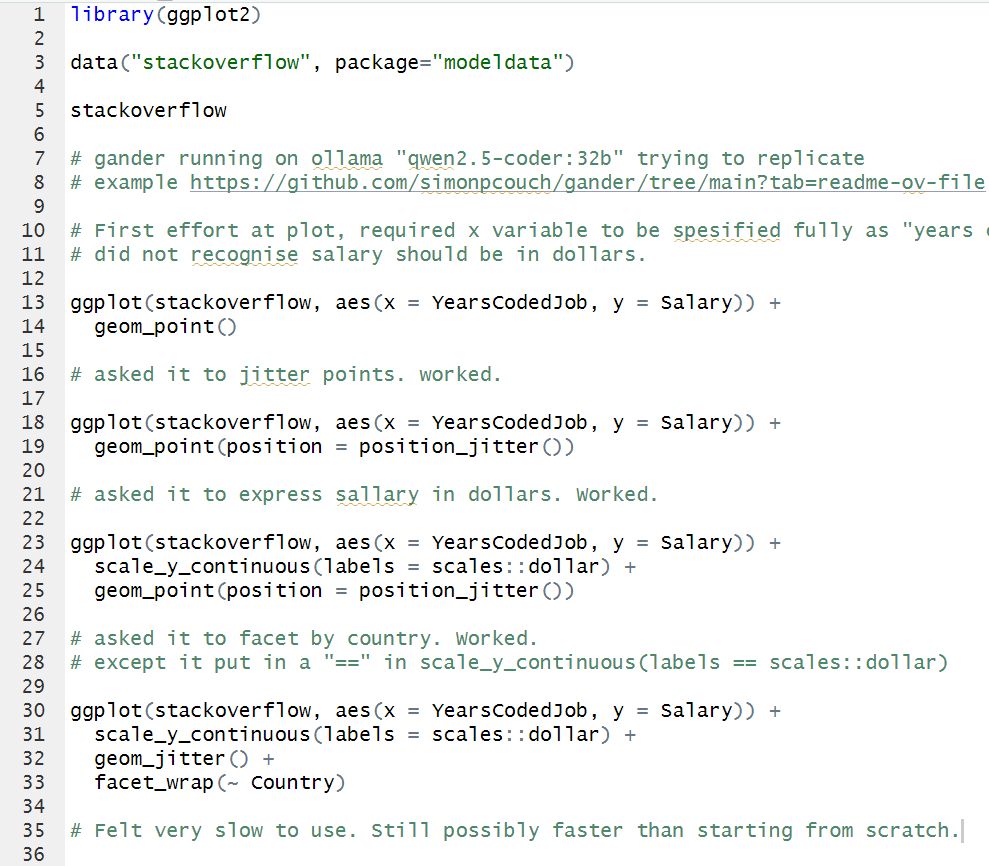
Just my notes on using gander in R with ollama qwen2.5-coder:32b running localy. Not convinced it's going to be terribly helpful. Made simple mistake in example code.
February 25, 2025 at 10:41 AM
Just my notes on using gander in R with ollama qwen2.5-coder:32b running localy. Not convinced it's going to be terribly helpful. Made simple mistake in example code.
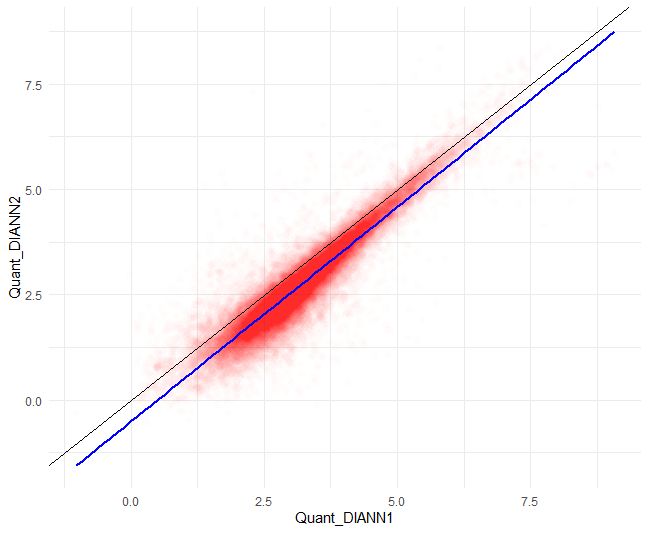
Lastly I compared protein quantification obtained from DIA-NNv2.0 and DIA-NN v1.9. Plot shows y=y line in black, regression line in blue, data points in red with high transparency. Quantification is fairly tight. DIA-NNv2.0 underestimates wrt v1.9.
January 31, 2025 at 10:26 PM
Lastly I compared protein quantification obtained from DIA-NNv2.0 and DIA-NN v1.9. Plot shows y=y line in black, regression line in blue, data points in red with high transparency. Quantification is fairly tight. DIA-NNv2.0 underestimates wrt v1.9.
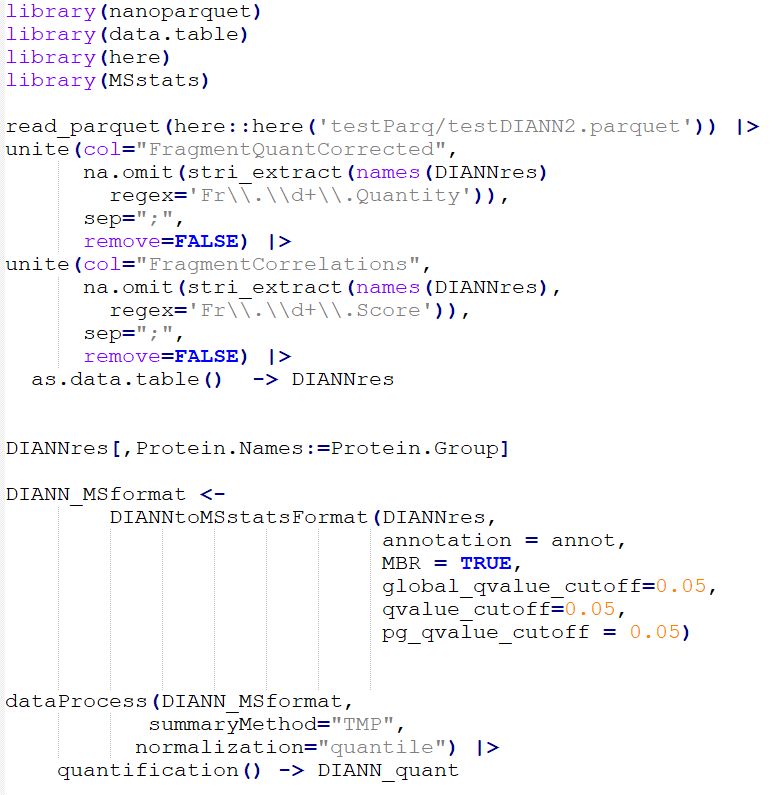
Once data is in it needs some tweaks to get the columns named in the way MSstats expects. Fragment data is now included in separate columns and has to be concatenated into a single column for MSstas.
January 31, 2025 at 10:26 PM
Once data is in it needs some tweaks to get the columns named in the way MSstats expects. Fragment data is now included in separate columns and has to be concatenated into a single column for MSstas.
Screen shot of viewer

January 31, 2025 at 10:26 PM
Screen shot of viewer