


Kyle Walker
@kylewalker.bsky.social
Demographics | Geospatial | Data Science | Open Source
Need a monochrome basemap with @Mapbox's stunning 3D buildings?
Try this mapgl trick for #30DayMapChallenge Day 11: Minimal:
library(mapgl)
mapboxgl(
config = list(
basemap = list(
theme = "monochrome"
)
)
)
Add `lightPreset = "night"` for a dark basemap!
Try this mapgl trick for #30DayMapChallenge Day 11: Minimal:
library(mapgl)
mapboxgl(
config = list(
basemap = list(
theme = "monochrome"
)
)
)
Add `lightPreset = "night"` for a dark basemap!


November 11, 2025 at 3:24 PM
Need a monochrome basemap with @Mapbox's stunning 3D buildings?
Try this mapgl trick for #30DayMapChallenge Day 11: Minimal:
library(mapgl)
mapboxgl(
config = list(
basemap = list(
theme = "monochrome"
)
)
)
Add `lightPreset = "night"` for a dark basemap!
Try this mapgl trick for #30DayMapChallenge Day 11: Minimal:
library(mapgl)
mapboxgl(
config = list(
basemap = list(
theme = "monochrome"
)
)
)
Add `lightPreset = "night"` for a dark basemap!
Today's mapgl tip for #30DayMapChallenge: Air
Use the `set_fog()` function to change the color of the sky on your @Mapbox map. Visualize the glow of the Northern Lights - or whatever you can come up with!
Use the `set_fog()` function to change the color of the sky on your @Mapbox map. Visualize the glow of the Northern Lights - or whatever you can come up with!
November 10, 2025 at 2:46 PM
Today's mapgl tip for #30DayMapChallenge: Air
Use the `set_fog()` function to change the color of the sky on your @Mapbox map. Visualize the glow of the Northern Lights - or whatever you can come up with!
Use the `set_fog()` function to change the color of the sky on your @Mapbox map. Visualize the glow of the Northern Lights - or whatever you can come up with!
A custom styling trick for #30DayMapChallenge: Analog
For a "classic" look on your mapgl MapLibre maps, load a parchment paper image (or whatever you'd like) and override the basemap.
Here's how to do it: gist.github.com/walkerke/648...
For a "classic" look on your mapgl MapLibre maps, load a parchment paper image (or whatever you'd like) and override the basemap.
Here's how to do it: gist.github.com/walkerke/648...
November 9, 2025 at 3:58 PM
A custom styling trick for #30DayMapChallenge: Analog
For a "classic" look on your mapgl MapLibre maps, load a parchment paper image (or whatever you'd like) and override the basemap.
Here's how to do it: gist.github.com/walkerke/648...
For a "classic" look on your mapgl MapLibre maps, load a parchment paper image (or whatever you'd like) and override the basemap.
Here's how to do it: gist.github.com/walkerke/648...
Today's mapgl tip for #30DayMapChallenge Day 8: Urban
The default Mapbox Standard Style with `mapboxgl()` gets you 3D buildings - with rendered landmarks - out of the box.
Using MapLibre? Try `maplibre(style = openfreemap_style("liberty"))` for 3D OSM buildings!
The default Mapbox Standard Style with `mapboxgl()` gets you 3D buildings - with rendered landmarks - out of the box.
Using MapLibre? Try `maplibre(style = openfreemap_style("liberty"))` for 3D OSM buildings!


November 8, 2025 at 1:54 PM
Today's mapgl tip for #30DayMapChallenge Day 8: Urban
The default Mapbox Standard Style with `mapboxgl()` gets you 3D buildings - with rendered landmarks - out of the box.
Using MapLibre? Try `maplibre(style = openfreemap_style("liberty"))` for 3D OSM buildings!
The default Mapbox Standard Style with `mapboxgl()` gets you 3D buildings - with rendered landmarks - out of the box.
Using MapLibre? Try `maplibre(style = openfreemap_style("liberty"))` for 3D OSM buildings!
#30DayMapChallenge Day 7: Accessibility
Today's tip: calculate access from a location in one line of code with `mb_isochrone()` in the mapboxapi R package.
Then, visualize creatively with a comparison slider in mapgl.
Learn how: walker-data.com/posts/time-a...
Today's tip: calculate access from a location in one line of code with `mb_isochrone()` in the mapboxapi R package.
Then, visualize creatively with a comparison slider in mapgl.
Learn how: walker-data.com/posts/time-a...
November 7, 2025 at 2:40 PM
#30DayMapChallenge Day 7: Accessibility
Today's tip: calculate access from a location in one line of code with `mb_isochrone()` in the mapboxapi R package.
Then, visualize creatively with a comparison slider in mapgl.
Learn how: walker-data.com/posts/time-a...
Today's tip: calculate access from a location in one line of code with `mb_isochrone()` in the mapboxapi R package.
Then, visualize creatively with a comparison slider in mapgl.
Learn how: walker-data.com/posts/time-a...
Interactive heatmaps that fade away to reveal points on zoom - a useful technique for handling dense spatial data.
Learn how to do it: walker-data.com/posts/mapgl-...
Learn how to do it: walker-data.com/posts/mapgl-...
November 6, 2025 at 9:41 PM
Interactive heatmaps that fade away to reveal points on zoom - a useful technique for handling dense spatial data.
Learn how to do it: walker-data.com/posts/mapgl-...
Learn how to do it: walker-data.com/posts/mapgl-...
Today's mapgl tip for Day 6 of #30DayMapChallenge: Dimensions
Visualize your spatial data in 3D with `add_fill_extrusion_layer()`!
The key is `fill_extrusion_height`; map a column of heights here or use a helper like `interpolate()` to control how you extrude your polygons.
Visualize your spatial data in 3D with `add_fill_extrusion_layer()`!
The key is `fill_extrusion_height`; map a column of heights here or use a helper like `interpolate()` to control how you extrude your polygons.
November 6, 2025 at 5:18 PM
Today's mapgl tip for Day 6 of #30DayMapChallenge: Dimensions
Visualize your spatial data in 3D with `add_fill_extrusion_layer()`!
The key is `fill_extrusion_height`; map a column of heights here or use a helper like `interpolate()` to control how you extrude your polygons.
Visualize your spatial data in 3D with `add_fill_extrusion_layer()`!
The key is `fill_extrusion_height`; map a column of heights here or use a helper like `interpolate()` to control how you extrude your polygons.
I got a lot of interest in yesterday's geolocation / Overture Maps places proof-of-concept.
I've published the app here for you to try out: walkerke-restaurant-finder-app.share.connect.posit.cloud
For #rstats devs, I've also published the source code here: gist.github.com/walkerke/4a1...
I've published the app here for you to try out: walkerke-restaurant-finder-app.share.connect.posit.cloud
For #rstats devs, I've also published the source code here: gist.github.com/walkerke/4a1...
November 5, 2025 at 5:33 PM
I got a lot of interest in yesterday's geolocation / Overture Maps places proof-of-concept.
I've published the app here for you to try out: walkerke-restaurant-finder-app.share.connect.posit.cloud
For #rstats devs, I've also published the source code here: gist.github.com/walkerke/4a1...
I've published the app here for you to try out: walkerke-restaurant-finder-app.share.connect.posit.cloud
For #rstats devs, I've also published the source code here: gist.github.com/walkerke/4a1...
#30DayMapChallenge Day 5: Earth
Today's tip: in #rstats mapgl, use `mapboxgl(style = mapbox_style("standard-satellite"))` to get @mapbox.com high-quality imagery on an interactive globe in one line of code.
Even better - you get 3D terrain out of the box!
Today's tip: in #rstats mapgl, use `mapboxgl(style = mapbox_style("standard-satellite"))` to get @mapbox.com high-quality imagery on an interactive globe in one line of code.
Even better - you get 3D terrain out of the box!
November 5, 2025 at 1:35 PM
#30DayMapChallenge Day 5: Earth
Today's tip: in #rstats mapgl, use `mapboxgl(style = mapbox_style("standard-satellite"))` to get @mapbox.com high-quality imagery on an interactive globe in one line of code.
Even better - you get 3D terrain out of the box!
Today's tip: in #rstats mapgl, use `mapboxgl(style = mapbox_style("standard-satellite"))` to get @mapbox.com high-quality imagery on an interactive globe in one line of code.
Even better - you get 3D terrain out of the box!
Proof-of-concept for an in-app geolocation control:
- Find your location, draw a buffer (or isochrone, etc.) around it;
- Query a massive tileset (64 million places from Overture Maps) to find nearby places;
- Deliver that information to your app users.
- Find your location, draw a buffer (or isochrone, etc.) around it;
- Query a massive tileset (64 million places from Overture Maps) to find nearby places;
- Deliver that information to your app users.
November 4, 2025 at 7:00 PM
Proof-of-concept for an in-app geolocation control:
- Find your location, draw a buffer (or isochrone, etc.) around it;
- Query a massive tileset (64 million places from Overture Maps) to find nearby places;
- Deliver that information to your app users.
- Find your location, draw a buffer (or isochrone, etc.) around it;
- Query a massive tileset (64 million places from Overture Maps) to find nearby places;
- Deliver that information to your app users.
Today's mapgl tip: use `add_geolocate_control()` to add a geolocation control to your map.
Click to fly to your location; in Shiny, use `input$MAPID_geolocate` to get the coordinates.
Great for building apps designed for use in the field!
#30DayMapChallenge Day 4: My Data
Click to fly to your location; in Shiny, use `input$MAPID_geolocate` to get the coordinates.
Great for building apps designed for use in the field!
#30DayMapChallenge Day 4: My Data
November 4, 2025 at 2:40 PM
Today's mapgl tip: use `add_geolocate_control()` to add a geolocation control to your map.
Click to fly to your location; in Shiny, use `input$MAPID_geolocate` to get the coordinates.
Great for building apps designed for use in the field!
#30DayMapChallenge Day 4: My Data
Click to fly to your location; in Shiny, use `input$MAPID_geolocate` to get the coordinates.
Great for building apps designed for use in the field!
#30DayMapChallenge Day 4: My Data
1.7 million Texas oil & gas wells at your fingertips.
Lasso wells on the map, download the data instantly.
From selection to export in seconds.
(By the way, this is powered by Shiny and #rstats)
Lasso wells on the map, download the data instantly.
From selection to export in seconds.
(By the way, this is powered by Shiny and #rstats)
November 3, 2025 at 9:47 PM
1.7 million Texas oil & gas wells at your fingertips.
Lasso wells on the map, download the data instantly.
From selection to export in seconds.
(By the way, this is powered by Shiny and #rstats)
Lasso wells on the map, download the data instantly.
From selection to export in seconds.
(By the way, this is powered by Shiny and #rstats)
311,000+ Texas Land Survey System areas.
Explored over satellite imagery in a single line of code.
Modern geospatial technology can take your land & ownership mapping to the next level.
#30DayMapChallenge Day 3: Polygons
Explored over satellite imagery in a single line of code.
Modern geospatial technology can take your land & ownership mapping to the next level.
#30DayMapChallenge Day 3: Polygons
November 3, 2025 at 2:48 PM
311,000+ Texas Land Survey System areas.
Explored over satellite imagery in a single line of code.
Modern geospatial technology can take your land & ownership mapping to the next level.
#30DayMapChallenge Day 3: Polygons
Explored over satellite imagery in a single line of code.
Modern geospatial technology can take your land & ownership mapping to the next level.
#30DayMapChallenge Day 3: Polygons
For Day 2 of #30DayMapChallenge (Lines): did you know that mapgl has a built-in measurement tool in its draw control?
Use `show_measurements = TRUE` to interactively measure line distances (and polygon areas) on your map.
#rstats
Use `show_measurements = TRUE` to interactively measure line distances (and polygon areas) on your map.
#rstats
November 2, 2025 at 12:09 PM
For Day 2 of #30DayMapChallenge (Lines): did you know that mapgl has a built-in measurement tool in its draw control?
Use `show_measurements = TRUE` to interactively measure line distances (and polygon areas) on your map.
#rstats
Use `show_measurements = TRUE` to interactively measure line distances (and polygon areas) on your map.
#rstats
440,000+ oil and gas wells in Oklahoma.
Intelligently clustered and smoothly displayed on a map with click-to-zoom.
mapgl tip: use `cluster_options()` on a circle or symbol layer, no extra configuration required!
#30DayMapChallenge Day 1: Points
Intelligently clustered and smoothly displayed on a map with click-to-zoom.
mapgl tip: use `cluster_options()` on a circle or symbol layer, no extra configuration required!
#30DayMapChallenge Day 1: Points
November 1, 2025 at 3:23 PM
440,000+ oil and gas wells in Oklahoma.
Intelligently clustered and smoothly displayed on a map with click-to-zoom.
mapgl tip: use `cluster_options()` on a circle or symbol layer, no extra configuration required!
#30DayMapChallenge Day 1: Points
Intelligently clustered and smoothly displayed on a map with click-to-zoom.
mapgl tip: use `cluster_options()` on a circle or symbol layer, no extra configuration required!
#30DayMapChallenge Day 1: Points
The #30DayMapChallenge starts tomorrow across social media platforms!
Pay attention to this hashtag if you love maps - there will be tons of creative examples from around the world.
Pay attention to this hashtag if you love maps - there will be tons of creative examples from around the world.

October 31, 2025 at 4:16 PM
The #30DayMapChallenge starts tomorrow across social media platforms!
Pay attention to this hashtag if you love maps - there will be tons of creative examples from around the world.
Pay attention to this hashtag if you love maps - there will be tons of creative examples from around the world.
I've been posting about PMTiles for geospatial visualization for good reason.
However - you can push mapgl quite a ways without tiles!
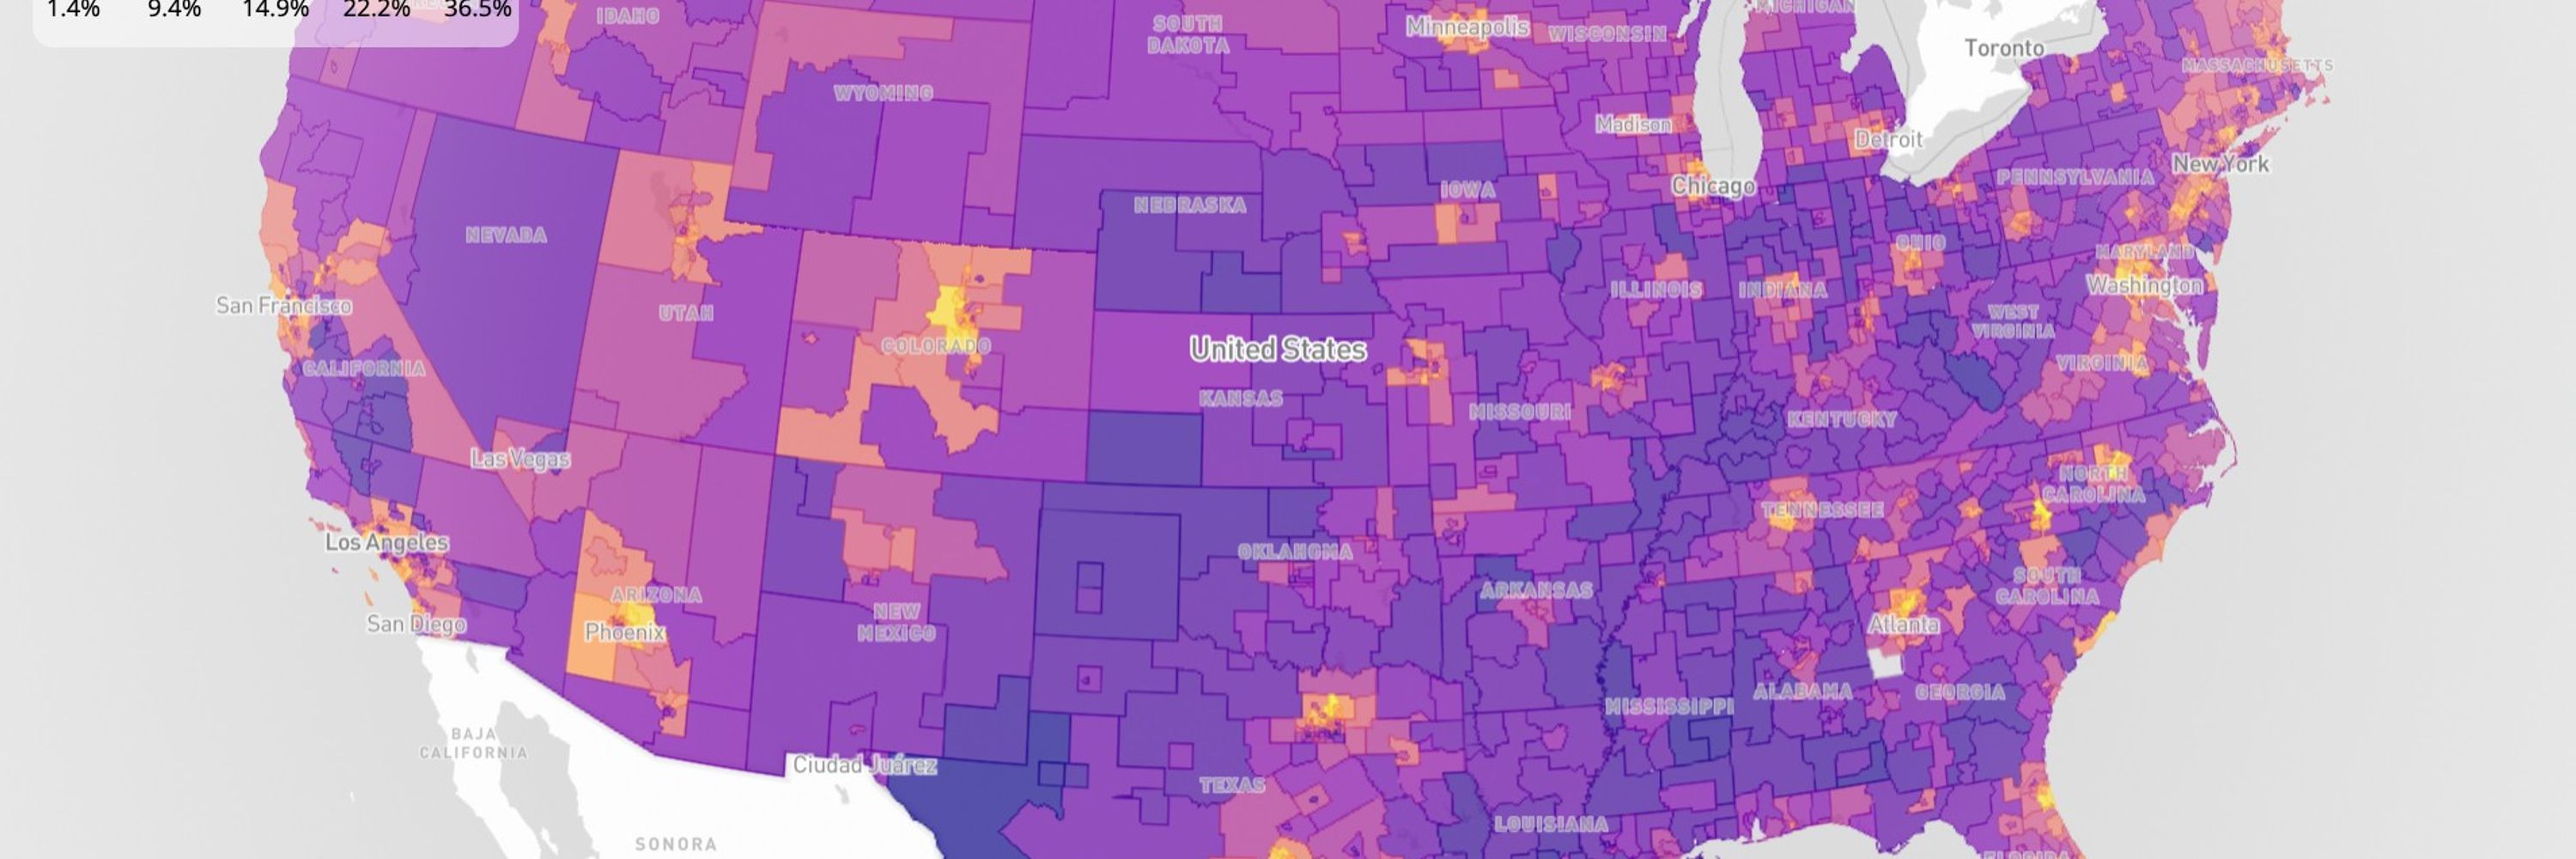
In this post, I cover how to map all 85,000+ Census tracts in the US without pre-tiling, along with performance tips.
walker-data.com/post...
However - you can push mapgl quite a ways without tiles!
In this post, I cover how to map all 85,000+ Census tracts in the US without pre-tiling, along with performance tips.
walker-data.com/post...

October 30, 2025 at 5:49 PM
I've been posting about PMTiles for geospatial visualization for good reason.
However - you can push mapgl quite a ways without tiles!
In this post, I cover how to map all 85,000+ Census tracts in the US without pre-tiling, along with performance tips.
walker-data.com/post...
However - you can push mapgl quite a ways without tiles!
In this post, I cover how to map all 85,000+ Census tracts in the US without pre-tiling, along with performance tips.
walker-data.com/post...
Two years later, {mapgl} has grown into the R package I always wanted.
And I'll freely admit that it would not exist without the help of LLMs.
I'm speaking tomorrow about my experiences with LLM-assisted R development.
Register here: docs.google.com/forms/d/e/1F...
And I'll freely admit that it would not exist without the help of LLMs.
I'm speaking tomorrow about my experiences with LLM-assisted R development.
Register here: docs.google.com/forms/d/e/1F...

October 28, 2025 at 3:34 PM
Two years later, {mapgl} has grown into the R package I always wanted.
And I'll freely admit that it would not exist without the help of LLMs.
I'm speaking tomorrow about my experiences with LLM-assisted R development.
Register here: docs.google.com/forms/d/e/1F...
And I'll freely admit that it would not exist without the help of LLMs.
I'm speaking tomorrow about my experiences with LLM-assisted R development.
Register here: docs.google.com/forms/d/e/1F...
A lot of you are asking about PMTiles - one of the most exciting innovations in geospatial in the past decade.
My most recent blog post helps you get started. Use this reproducible workflow to learn how to create, explore, and visualize PMTiles.
walker-data.com/post...
My most recent blog post helps you get started. Use this reproducible workflow to learn how to create, explore, and visualize PMTiles.
walker-data.com/post...


October 27, 2025 at 5:29 PM
A lot of you are asking about PMTiles - one of the most exciting innovations in geospatial in the past decade.
My most recent blog post helps you get started. Use this reproducible workflow to learn how to create, explore, and visualize PMTiles.
walker-data.com/post...
My most recent blog post helps you get started. Use this reproducible workflow to learn how to create, explore, and visualize PMTiles.
walker-data.com/post...
On the blog: building an AI-powered location explorer, updated to Claude Sonnet 4.5!
Learn how to use the ellmer and shinychat R packages to integrate chat into your Shiny apps.
Check it out: walker-data.com/posts/ai-loc...
Learn how to use the ellmer and shinychat R packages to integrate chat into your Shiny apps.
Check it out: walker-data.com/posts/ai-loc...
October 26, 2025 at 1:01 PM
On the blog: building an AI-powered location explorer, updated to Claude Sonnet 4.5!
Learn how to use the ellmer and shinychat R packages to integrate chat into your Shiny apps.
Check it out: walker-data.com/posts/ai-loc...
Learn how to use the ellmer and shinychat R packages to integrate chat into your Shiny apps.
Check it out: walker-data.com/posts/ai-loc...
The 1.4 release of @duckdb.org supports using a DuckDB database to serve vector tiles!
Of course, I had to try this out in R.
Check it out: all 242,000 US Census block groups dynamically served as vector tiles from a DuckDB database, displayed on a MapLibre map from R in Positron.
Of course, I had to try this out in R.
Check it out: all 242,000 US Census block groups dynamically served as vector tiles from a DuckDB database, displayed on a MapLibre map from R in Positron.
October 24, 2025 at 6:19 PM
The 1.4 release of @duckdb.org supports using a DuckDB database to serve vector tiles!
Of course, I had to try this out in R.
Check it out: all 242,000 US Census block groups dynamically served as vector tiles from a DuckDB database, displayed on a MapLibre map from R in Positron.
Of course, I had to try this out in R.
Check it out: all 242,000 US Census block groups dynamically served as vector tiles from a DuckDB database, displayed on a MapLibre map from R in Positron.
8.1 million Census blocks. 1.7 million Texas wells. Fast visualization, instant queries.
The magic tech: MapLibre + PMTiles.
The glue: R + Shiny.
Seriously.
The magic tech: MapLibre + PMTiles.
The glue: R + Shiny.
Seriously.


October 24, 2025 at 2:26 PM
8.1 million Census blocks. 1.7 million Texas wells. Fast visualization, instant queries.
The magic tech: MapLibre + PMTiles.
The glue: R + Shiny.
Seriously.
The magic tech: MapLibre + PMTiles.
The glue: R + Shiny.
Seriously.
All 8.1 million US Census blocks.
Visualized smoothly in 3D.
Instant population and housing totals from a lasso selection.
All running seamlessly in the browser, no traditional backend.
While everyone’s talking about AI, it’s an incredible time for geospatial tech.
Visualized smoothly in 3D.
Instant population and housing totals from a lasso selection.
All running seamlessly in the browser, no traditional backend.
While everyone’s talking about AI, it’s an incredible time for geospatial tech.
October 23, 2025 at 8:20 PM
All 8.1 million US Census blocks.
Visualized smoothly in 3D.
Instant population and housing totals from a lasso selection.
All running seamlessly in the browser, no traditional backend.
While everyone’s talking about AI, it’s an incredible time for geospatial tech.
Visualized smoothly in 3D.
Instant population and housing totals from a lasso selection.
All running seamlessly in the browser, no traditional backend.
While everyone’s talking about AI, it’s an incredible time for geospatial tech.
Charted: post-COVID income growth for America's largest metro areas.
Since 2021, Miami's median household income grew over 26 percent. Orlando and Tampa weren't far behind.
Among the US's largest metros, Seattle (10.5 percent) and Minneapolis (12 percent) have lagged.
Since 2021, Miami's median household income grew over 26 percent. Orlando and Tampa weren't far behind.
Among the US's largest metros, Seattle (10.5 percent) and Minneapolis (12 percent) have lagged.

October 22, 2025 at 4:22 PM
Charted: post-COVID income growth for America's largest metro areas.
Since 2021, Miami's median household income grew over 26 percent. Orlando and Tampa weren't far behind.
Among the US's largest metros, Seattle (10.5 percent) and Minneapolis (12 percent) have lagged.
Since 2021, Miami's median household income grew over 26 percent. Orlando and Tampa weren't far behind.
Among the US's largest metros, Seattle (10.5 percent) and Minneapolis (12 percent) have lagged.
Most accessibility analyses use "average" travel times.
But rush hour isn't average.
Your "15-minute service area" might be 25 minutes when it actually matters—when patients need care, employees commute, emergencies happen.
Learn how to handle this: walker-data.com/posts/time-a...
But rush hour isn't average.
Your "15-minute service area" might be 25 minutes when it actually matters—when patients need care, employees commute, emergencies happen.
Learn how to handle this: walker-data.com/posts/time-a...
October 21, 2025 at 6:12 PM
Most accessibility analyses use "average" travel times.
But rush hour isn't average.
Your "15-minute service area" might be 25 minutes when it actually matters—when patients need care, employees commute, emergencies happen.
Learn how to handle this: walker-data.com/posts/time-a...
But rush hour isn't average.
Your "15-minute service area" might be 25 minutes when it actually matters—when patients need care, employees commute, emergencies happen.
Learn how to handle this: walker-data.com/posts/time-a...