


Jo Wood
@jwolondon.bsky.social
Professor of Visual Analytics who does datavis, visualization storytelling and natural travel. Did I mention visualization?
Do you want a bit more sketchiness in your #datavis?
Here's my @observablehq.com Plot plugin that turns an Plot specification into a sketchy version with minimal extra work:
observablehq.com/@jwolondon/m...
Builds on the work of Gordon Tu and rough.js
Here's my @observablehq.com Plot plugin that turns an Plot specification into a sketchy version with minimal extra work:
observablehq.com/@jwolondon/m...
Builds on the work of Gordon Tu and rough.js

October 19, 2025 at 5:11 PM
Do you want a bit more sketchiness in your #datavis?
Here's my @observablehq.com Plot plugin that turns an Plot specification into a sketchy version with minimal extra work:
observablehq.com/@jwolondon/m...
Builds on the work of Gordon Tu and rough.js
Here's my @observablehq.com Plot plugin that turns an Plot specification into a sketchy version with minimal extra work:
observablehq.com/@jwolondon/m...
Builds on the work of Gordon Tu and rough.js
Possibly something happening in your browser/OS? Here is the same block of text as seen on my Mac / Safari. The x-height is pretty consistent. Note also the larger gap below the dots on the i.

October 15, 2025 at 6:12 PM
Possibly something happening in your browser/OS? Here is the same block of text as seen on my Mac / Safari. The x-height is pretty consistent. Note also the larger gap below the dots on the i.


And another thing...

September 27, 2025 at 5:41 AM
And another thing...
* Where shall we go for a walking holiday this year?
- How about the Alps?
* No, way too scary. I don't have a head for heights.
- OK, what about the gentle grassy domes of the Auvergne?
* Sounds great.
Day two of our walking holiday...
- How about the Alps?
* No, way too scary. I don't have a head for heights.
- OK, what about the gentle grassy domes of the Auvergne?
* Sounds great.
Day two of our walking holiday...

July 29, 2025 at 2:58 PM
* Where shall we go for a walking holiday this year?
- How about the Alps?
* No, way too scary. I don't have a head for heights.
- OK, what about the gentle grassy domes of the Auvergne?
* Sounds great.
Day two of our walking holiday...
- How about the Alps?
* No, way too scary. I don't have a head for heights.
- OK, what about the gentle grassy domes of the Auvergne?
* Sounds great.
Day two of our walking holiday...
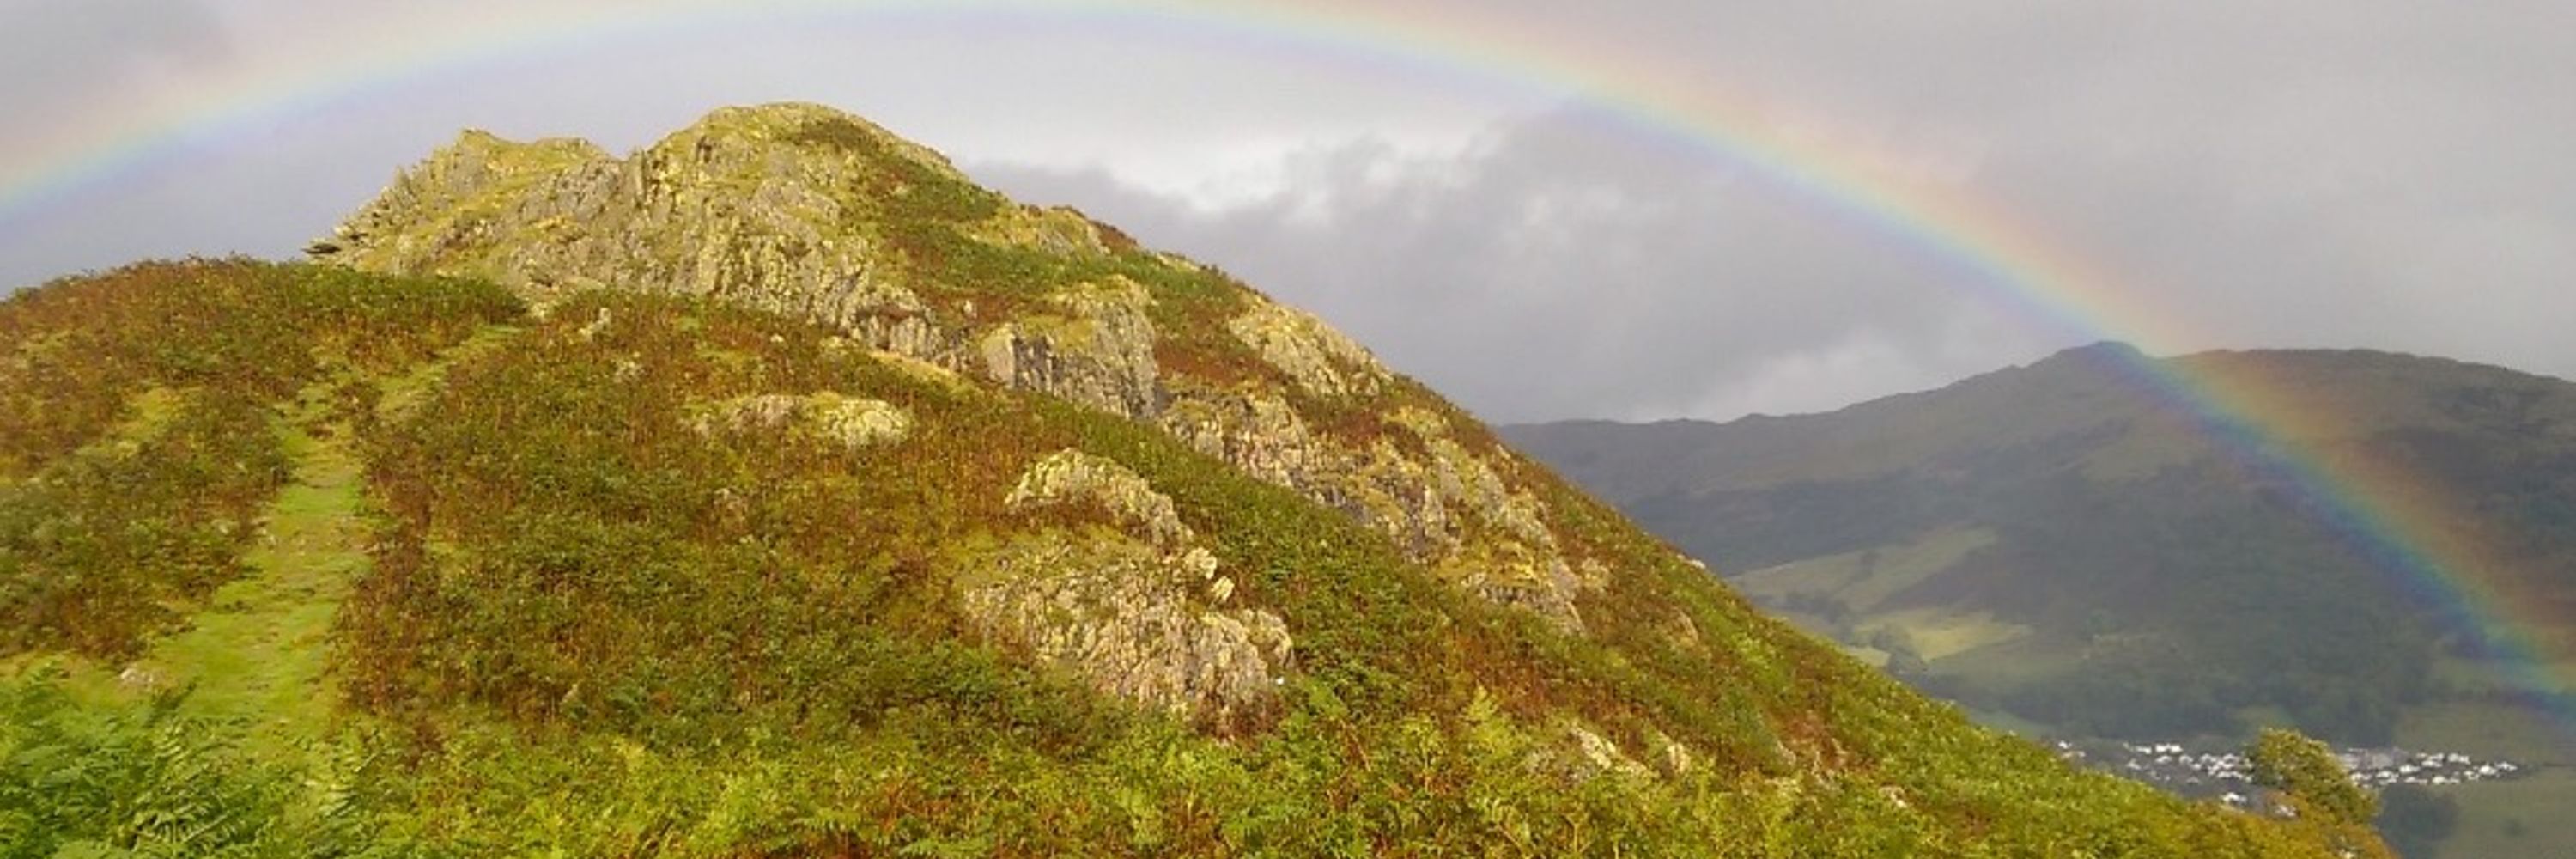
Currently in Lyon for some #eurogames and in preparation for some Auvergne walking next week. And Lyon is certainly good preparation, being a city of many many steps.
Here's just the first set from the 400+ up to our apartment.
Here's just the first set from the 400+ up to our apartment.

July 26, 2025 at 4:41 PM
Currently in Lyon for some #eurogames and in preparation for some Auvergne walking next week. And Lyon is certainly good preparation, being a city of many many steps.
Here's just the first set from the 400+ up to our apartment.
Here's just the first set from the 400+ up to our apartment.
A minor word of caution. Lightness doesn't vary linearly across the gradient (a peak at yellow), so not ideal for linear scaling.
The lower band uses a perceptually linear gradient via CSS oklch:
oklch(95% 0.02 190deg) to oklch(65% 0.2 25deg)
See observablehq.com/@jwolondon/h...
The lower band uses a perceptually linear gradient via CSS oklch:
oklch(95% 0.02 190deg) to oklch(65% 0.2 25deg)
See observablehq.com/@jwolondon/h...

July 10, 2025 at 12:51 AM
A minor word of caution. Lightness doesn't vary linearly across the gradient (a peak at yellow), so not ideal for linear scaling.
The lower band uses a perceptually linear gradient via CSS oklch:
oklch(95% 0.02 190deg) to oklch(65% 0.2 25deg)
See observablehq.com/@jwolondon/h...
The lower band uses a perceptually linear gradient via CSS oklch:
oklch(95% 0.02 190deg) to oklch(65% 0.2 25deg)
See observablehq.com/@jwolondon/h...
Onomatopoeic programming you say?
Here's a Rivulet program that generates a Collatz sequence from any given start integer.
en.wikipedia.org/wiki/Collatz...
Here's a Rivulet program that generates a Collatz sequence from any given start integer.
en.wikipedia.org/wiki/Collatz...

June 19, 2025 at 10:45 PM
Onomatopoeic programming you say?
Here's a Rivulet program that generates a Collatz sequence from any given start integer.
en.wikipedia.org/wiki/Collatz...
Here's a Rivulet program that generates a Collatz sequence from any given start integer.
en.wikipedia.org/wiki/Collatz...
Excited to receive this today. Chart by @nadiehbremer.com . I was lucky enough to get early access to a digital copy to provide feedback, but the paper copy is more lovely to hold & smell.
Bridges an important gap between design exposition (e.g Data Sketches by Bremer and Wu) and a design handbook.
Bridges an important gap between design exposition (e.g Data Sketches by Bremer and Wu) and a design handbook.


June 19, 2025 at 1:55 PM
Excited to receive this today. Chart by @nadiehbremer.com . I was lucky enough to get early access to a digital copy to provide feedback, but the paper copy is more lovely to hold & smell.
Bridges an important gap between design exposition (e.g Data Sketches by Bremer and Wu) and a design handbook.
Bridges an important gap between design exposition (e.g Data Sketches by Bremer and Wu) and a design handbook.
@dtemkin.bsky.social 's Rivulet esolang prompts ideas around code and #datavis comprehension. How do we make sense of visualizations when we are unfamiliar with the 'grammar' of their design?
An introduction Rivulet:
observablehq.com/@jwolondon/r...
An editor:
observablehq.com/@jwolondon/r...
An introduction Rivulet:
observablehq.com/@jwolondon/r...
An editor:
observablehq.com/@jwolondon/r...

June 15, 2025 at 7:50 AM
@dtemkin.bsky.social 's Rivulet esolang prompts ideas around code and #datavis comprehension. How do we make sense of visualizations when we are unfamiliar with the 'grammar' of their design?
An introduction Rivulet:
observablehq.com/@jwolondon/r...
An editor:
observablehq.com/@jwolondon/r...
An introduction Rivulet:
observablehq.com/@jwolondon/r...
An editor:
observablehq.com/@jwolondon/r...
It's the time of year when this season's fox cubs try being more independent of their family unit. We have three surviving cubs in the den next to our garden. This one likes to snooze on the warm patio at the end of a sunny day just outside our garden door.

May 31, 2025 at 4:33 PM
It's the time of year when this season's fox cubs try being more independent of their family unit. We have three surviving cubs in the den next to our garden. This one likes to snooze on the warm patio at the end of a sunny day just outside our garden door.
But, this doesn't pack well if adjacent numbers are of similar magnitude.
I wonder if we can algorithmically determine a good packing of strands (ignoring for the moment the need to align with Action strands). Here's a more compact version of the same program with more efficient packing.
I wonder if we can algorithmically determine a good packing of strands (ignoring for the moment the need to align with Action strands). Here's a more compact version of the same program with more efficient packing.

May 18, 2025 at 9:45 PM
But, this doesn't pack well if adjacent numbers are of similar magnitude.
I wonder if we can algorithmically determine a good packing of strands (ignoring for the moment the need to align with Action strands). Here's a more compact version of the same program with more efficient packing.
I wonder if we can algorithmically determine a good packing of strands (ignoring for the moment the need to align with Action strands). Here's a more compact version of the same program with more efficient packing.
I love this!
Experimenting with simple value strands, thinking about how to minimise strand length for any given number representation. A variation of the knapsack problem with primes? I think shortest strands will never have lefts. Here's ASCII 'HELLO WORLD!' in list 1 with shortest strands:
Experimenting with simple value strands, thinking about how to minimise strand length for any given number representation. A variation of the knapsack problem with primes? I think shortest strands will never have lefts. Here's ASCII 'HELLO WORLD!' in list 1 with shortest strands:
![Rivulet program representing the ASCII codes [72, 69, 76, 76, 79, 32, 87, 79, 82, 76, 68, 33] (HELLO WORLD!). The show 12 coloured lines arranged left to right in a row. Each is broadly 'L' shaped. The text of the .riv file that produces this is:
1 ╵ ╮╮ ╮ ╮ ╮╮ ╮ ╮╮ ╮ ╮╮
2 ││ │ │ ││ │ ││ │ ││
3 │╰─╮ │ │ ││ │ ││ │ ││
5 │ │ │ │ │╰──╮ │ │╰─╮ │ ││
7 ╰─╮│ │ │ │ │ │ │ │ │ ││
11 │╰────── ╰─╮ ╰─╮ ╰─╮ ╰── ╰──╮ ╰─╮╰─────── ╰─╮ │╰───
13 ╰───── ╰───── ╰───── │ ╰───── │ ╰───── │
17 ╰──── ╰──── ╰────
╷](https://cdn.bsky.app/img/feed_thumbnail/plain/did:plc:3apqimvvgrtwpagkohobqc4a/bafkreiafe7hnw63w53zodt7mlrku4joh2zmdhcqnruja7gt35tuwkng5ja@jpeg)
May 18, 2025 at 9:45 PM
I love this!
Experimenting with simple value strands, thinking about how to minimise strand length for any given number representation. A variation of the knapsack problem with primes? I think shortest strands will never have lefts. Here's ASCII 'HELLO WORLD!' in list 1 with shortest strands:
Experimenting with simple value strands, thinking about how to minimise strand length for any given number representation. A variation of the knapsack problem with primes? I think shortest strands will never have lefts. Here's ASCII 'HELLO WORLD!' in list 1 with shortest strands:
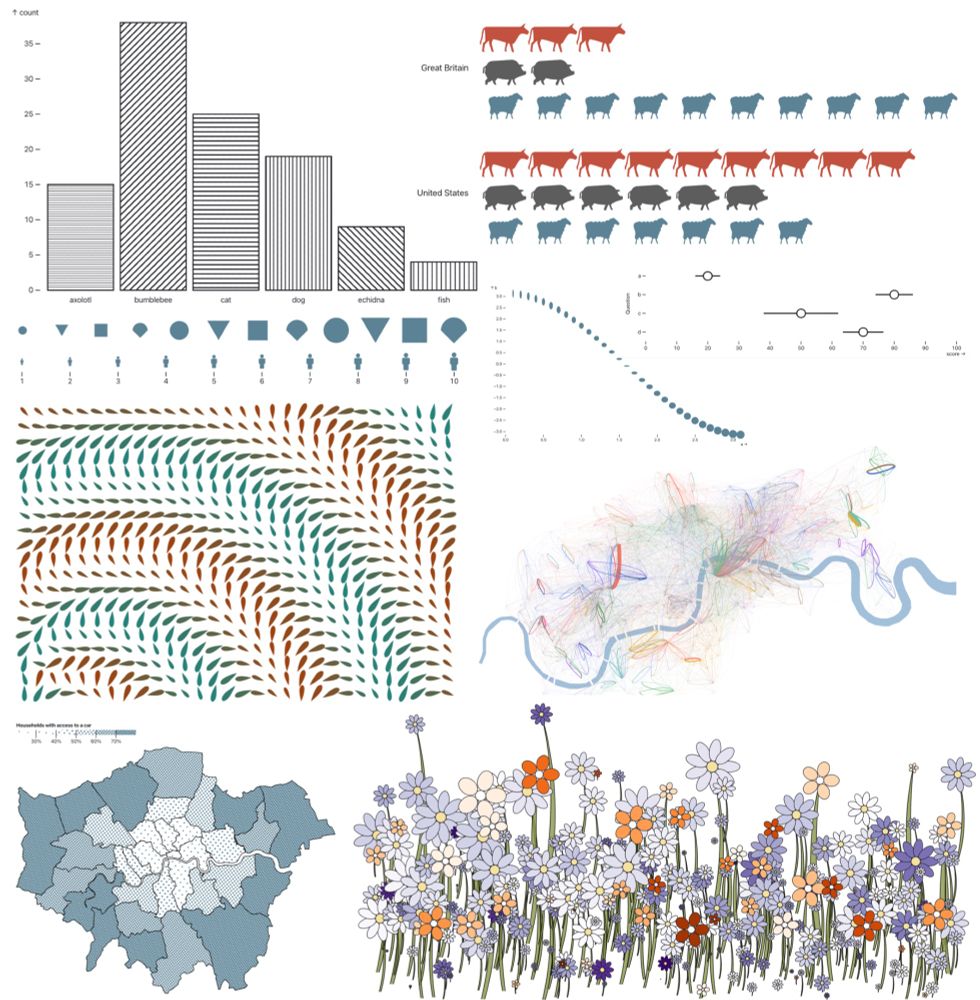
Will try to navigate the satire/serious path here.
Important to distinguish data ink *ratio* (however flawed a concept) from data density or mark density.
The attached has c. 1,000,000 data points represented as marks. Not necessarily hard to interpret; high data-ink ratio; high data density.
Important to distinguish data ink *ratio* (however flawed a concept) from data density or mark density.
The attached has c. 1,000,000 data points represented as marks. Not necessarily hard to interpret; high data-ink ratio; high data density.

April 24, 2025 at 3:00 PM
Will try to navigate the satire/serious path here.
Important to distinguish data ink *ratio* (however flawed a concept) from data density or mark density.
The attached has c. 1,000,000 data points represented as marks. Not necessarily hard to interpret; high data-ink ratio; high data density.
Important to distinguish data ink *ratio* (however flawed a concept) from data density or mark density.
The attached has c. 1,000,000 data points represented as marks. Not necessarily hard to interpret; high data-ink ratio; high data density.
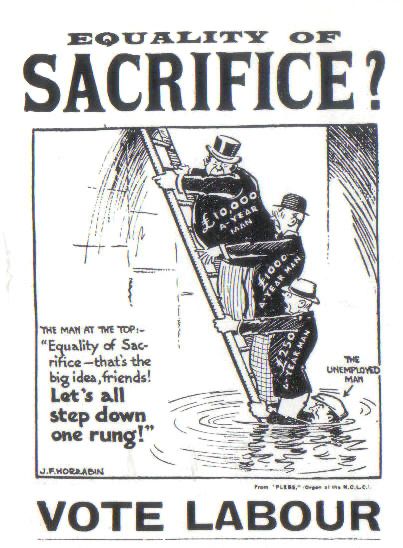
From 1929 (JF Horrabin's cartoon used in a British Labour Party campaign that year).
April 3, 2025 at 4:14 PM
From 1929 (JF Horrabin's cartoon used in a British Labour Party campaign that year).
Want to create your own custom marks in @observablehq.com Plot, but don't want to go full D3?
I've created a guide with 6 approaches of varying sophistication for specifying reusable custom marks:
observablehq.com/@jwolondon/h...
I've created a guide with 6 approaches of varying sophistication for specifying reusable custom marks:
observablehq.com/@jwolondon/h...
March 31, 2025 at 8:16 PM
Want to create your own custom marks in @observablehq.com Plot, but don't want to go full D3?
I've created a guide with 6 approaches of varying sophistication for specifying reusable custom marks:
observablehq.com/@jwolondon/h...
I've created a guide with 6 approaches of varying sophistication for specifying reusable custom marks:
observablehq.com/@jwolondon/h...
Playing with pinhole camera and today's partial #solarEclipse. It kind of works, but unexpectedly, lens ghosting works even better.


March 29, 2025 at 11:31 AM
Playing with pinhole camera and today's partial #solarEclipse. It kind of works, but unexpectedly, lens ghosting works even better.
Although the evening speed limit is voluntary, probably best to obey.

March 24, 2025 at 8:00 AM
Although the evening speed limit is voluntary, probably best to obey.
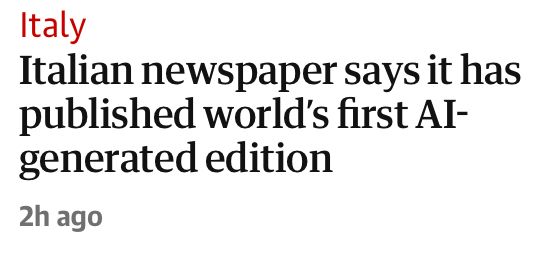
I suppose once upon a time, a local newspaper site could legitimately claim "Local newspaper says it has published the world's first unreadable news site littered with popup ads for anti aging snake oil, slimming pills and crypto investment opportunities. Not sure it's something to be proud of.
March 18, 2025 at 4:36 PM
I suppose once upon a time, a local newspaper site could legitimately claim "Local newspaper says it has published the world's first unreadable news site littered with popup ads for anti aging snake oil, slimming pills and crypto investment opportunities. Not sure it's something to be proud of.
I love these! Such a variety of forms achievable with just small parameter tweaks.


March 16, 2025 at 9:20 AM
I love these! Such a variety of forms achievable with just small parameter tweaks.
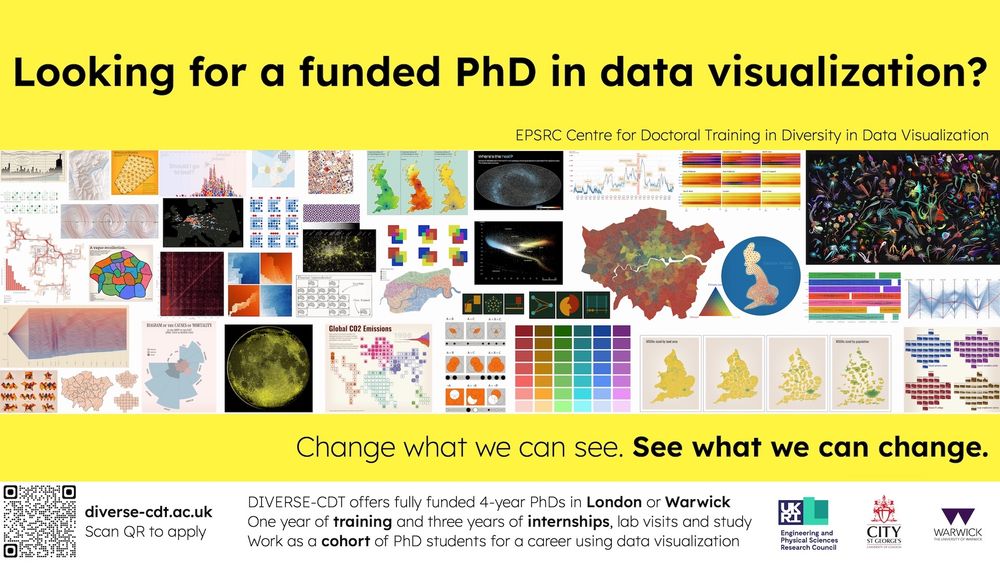
More places available for fully funded 4-year PhDs in #datavis 📊 with us at diverse-cdt.ac.uk in London / Warwick.
We welcome applications from anyone with enthusiasm for #datavis. We aim to diversify approaches to datavis & the people who lead it.
Change what we can see. See what we can change.
We welcome applications from anyone with enthusiasm for #datavis. We aim to diversify approaches to datavis & the people who lead it.
Change what we can see. See what we can change.
March 3, 2025 at 4:48 PM
More places available for fully funded 4-year PhDs in #datavis 📊 with us at diverse-cdt.ac.uk in London / Warwick.
We welcome applications from anyone with enthusiasm for #datavis. We aim to diversify approaches to datavis & the people who lead it.
Change what we can see. See what we can change.
We welcome applications from anyone with enthusiasm for #datavis. We aim to diversify approaches to datavis & the people who lead it.
Change what we can see. See what we can change.
And for me, both in data visualization and board gaming, I am drawn to well crafted graphic design. I want my games (and datavis) just to look and feel "right". Where boardgames can often go one step further than #datavis is in their physical design. Hello Azul and your lovely tiles.

February 22, 2025 at 3:53 PM
And for me, both in data visualization and board gaming, I am drawn to well crafted graphic design. I want my games (and datavis) just to look and feel "right". Where boardgames can often go one step further than #datavis is in their physical design. Hello Azul and your lovely tiles.
Some games, like Mysterium (pictured) and Dixit rely explicitly on decoding visual encoding to succeed in the game. The fun is often in realising how different we each are in the way we interpret complex visual scenes.

February 22, 2025 at 3:53 PM
Some games, like Mysterium (pictured) and Dixit rely explicitly on decoding visual encoding to succeed in the game. The fun is often in realising how different we each are in the way we interpret complex visual scenes.
Pax Pamir is one of my favourites because it ostensibly follows the 'map as control' but subverts the idea in gameplay. Yet the visual remains important. There's great use of physicalisation via the unused clay pieces that form an evolving bar chart of game status.

February 22, 2025 at 3:53 PM
Pax Pamir is one of my favourites because it ostensibly follows the 'map as control' but subverts the idea in gameplay. Yet the visual remains important. There's great use of physicalisation via the unused clay pieces that form an evolving bar chart of game status.