


Jon Belyeu
@jonbelyeu.bsky.social
Bioinformatics scientist at PacBio, previously Illumina. I develop software tools in Rust and Python for genome analysis.
https://orcid.org/0000-0001-5470-8299
https://orcid.org/0000-0001-5470-8299
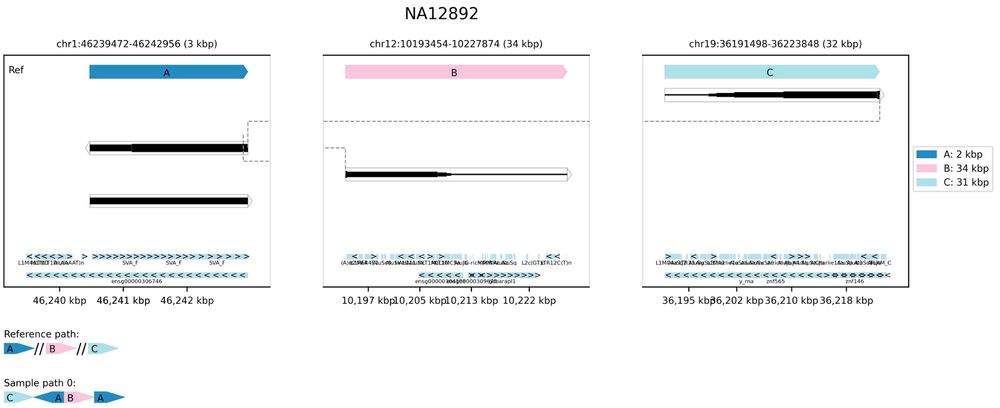
Paraviewer creates easy-to-use review websites from Paraphase output. Try these demos!
WGS data: pacificbiosciences.github.io/ParaviewerWG...
PureTarget data: pacificbiosciences.github.io/ParaviewerPT...
WGS data: pacificbiosciences.github.io/ParaviewerWG...
PureTarget data: pacificbiosciences.github.io/ParaviewerPT...
Paraviewer
pacificbiosciences.github.io
October 15, 2025 at 2:59 PM
Paraviewer creates easy-to-use review websites from Paraphase output. Try these demos!
WGS data: pacificbiosciences.github.io/ParaviewerWG...
PureTarget data: pacificbiosciences.github.io/ParaviewerPT...
WGS data: pacificbiosciences.github.io/ParaviewerWG...
PureTarget data: pacificbiosciences.github.io/ParaviewerPT...
Tool (with demos) available at github.com/PacificBiosc...

GitHub - PacificBiosciences/SVTopo: Complex structural variant visualization for HiFi sequencing data
Complex structural variant visualization for HiFi sequencing data - PacificBiosciences/SVTopo
github.com
October 9, 2025 at 7:01 PM
Tool (with demos) available at github.com/PacificBiosc...
Here's an example from the paper: a complex rearrangement shown with svtopo (top), IGV (middle), and Ribbon (bottom):

October 9, 2025 at 7:01 PM
Here's an example from the paper: a complex rearrangement shown with svtopo (top), IGV (middle), and Ribbon (bottom):
Install SVTopo from conda, or go straight to the source at github.com/PacificBiosc.... If you break it, let me know! The best way is by creating a github issue on the repo.
GitHub - PacificBiosciences/SVTopo: Complex structural variant visualization for HiFi sequencing data
Complex structural variant visualization for HiFi sequencing data - PacificBiosciences/SVTopo
github.com
April 22, 2025 at 2:25 PM
Install SVTopo from conda, or go straight to the source at github.com/PacificBiosc.... If you break it, let me know! The best way is by creating a github issue on the repo.
In addition to making these handy-dandy images, SVTopo creates a serverless table browser to sort, filter, and view the results. The one for these 7 samples is live at pacificbiosciences.github.io/SVTopo/. Try it out!
SVTopo
pacificbiosciences.github.io
April 22, 2025 at 2:25 PM
In addition to making these handy-dandy images, SVTopo creates a serverless table browser to sort, filter, and view the results. The one for these 7 samples is live at pacificbiosciences.github.io/SVTopo/. Try it out!
This example might look at first glance like a bad representation of a translocation, but the SVA annotation is a giveaway - reads from chr12 and chr19 aligned to a random SVA retrotransposon rather than a real connection between three chromosomes.
April 22, 2025 at 2:24 PM
This example might look at first glance like a bad representation of a translocation, but the SVA annotation is a giveaway - reads from chr12 and chr19 aligned to a random SVA retrotransposon rather than a real connection between three chromosomes.
Alignment challenges mean that the visualization doesn’t always work, of course. 125 images from these 7 genomes had alignment artifacts that made them useless for variant interpretation. Many of these appear to be useful in another way, though – identification of false positives.
April 22, 2025 at 2:23 PM
Alignment challenges mean that the visualization doesn’t always work, of course. 125 images from these 7 genomes had alignment artifacts that made them useless for variant interpretation. Many of these appear to be useful in another way, though – identification of false positives.
We looked at SVTopo images for 7 unrelated samples (HG002 and 6 from the platinum pedigrees cohort: 10.1101/2024.10.02.616333) and observed 142 unique complex SVs that we put in 11 categories (fig2).

April 22, 2025 at 2:23 PM
We looked at SVTopo images for 7 unrelated samples (HG002 and 6 from the platinum pedigrees cohort: 10.1101/2024.10.02.616333) and observed 142 unique complex SVs that we put in 11 categories (fig2).
This example is hard to understand from e.g. IGV/Ribbon (see Fig1) but pretty simple in SVTopo: 4 blocks deleted (B,D,F,H), 2 inverted (E,G), 1 re-ordered (C)

April 22, 2025 at 2:22 PM
This example is hard to understand from e.g. IGV/Ribbon (see Fig1) but pretty simple in SVTopo: 4 blocks deleted (B,D,F,H), 2 inverted (E,G), 1 re-ordered (C)
Although there are some excellent genome visualization tools out there, none of them are great at representing the complex structural variation that long reads uniquely identify. SVTopo is for this. Shows alignments in new genomic blocks and represents those blocks relative to the reference genome.
April 22, 2025 at 2:22 PM
Although there are some excellent genome visualization tools out there, none of them are great at representing the complex structural variation that long reads uniquely identify. SVTopo is for this. Shows alignments in new genomic blocks and represents those blocks relative to the reference genome.
If you were interested but missed it: www.pacb.com/wp-content/u...
www.pacb.com
November 13, 2024 at 7:00 PM
If you were interested but missed it: www.pacb.com/wp-content/u...
Glad to see the interest! Associating individual alignments with VCF breakend coordinates can be challenging, which is why the recommended workflow uses sawfish (we added a sawfish read output to make it work) but svtopo can also run with just the HiFi bam for samples without sawfish calls
October 30, 2024 at 3:57 PM
Glad to see the interest! Associating individual alignments with VCF breakend coordinates can be challenging, which is why the recommended workflow uses sawfish (we added a sawfish read output to make it work) but svtopo can also run with just the HiFi bam for samples without sawfish calls