


James Hay
@jameshay.bsky.social
Research Fellow at the Pandemic Sciences Institute, University of Oxford. Using maths and stats to understand infectious disease dynamics, mostly viral kinetics and serology. https://hay-idd.github.io/
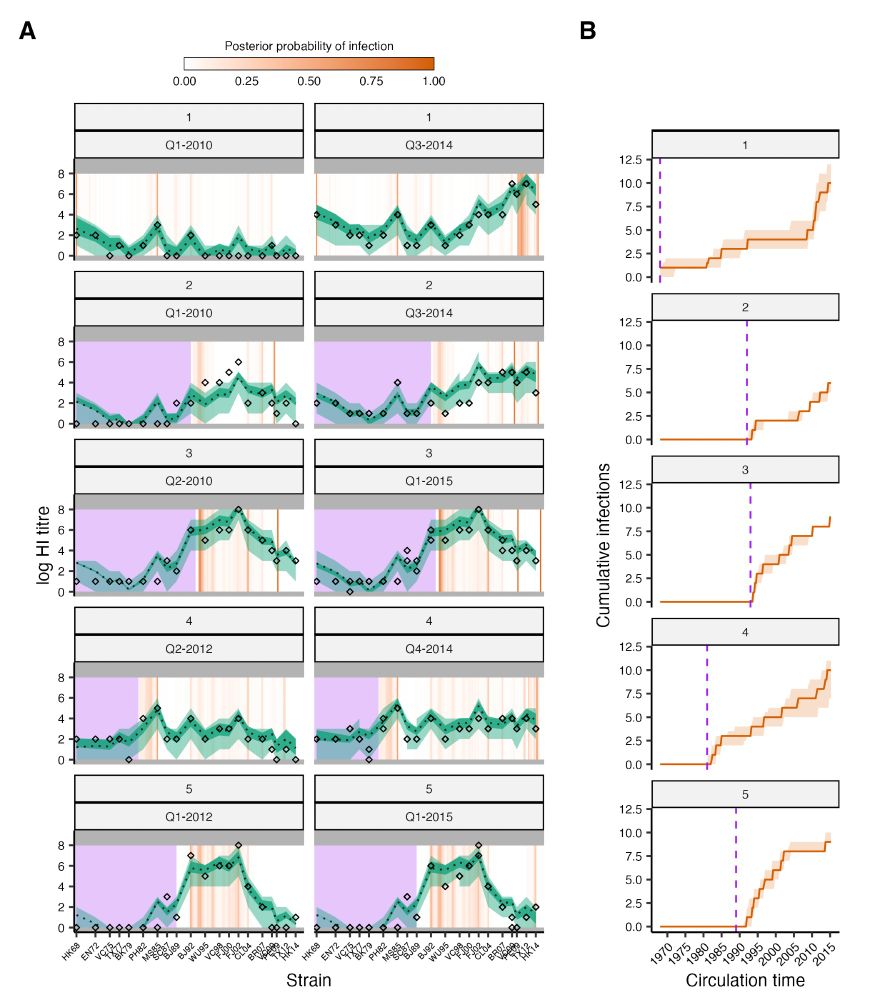
An exciting output of our inference is the well-known relationship between antibody titer and probability of infection. Using our method, we can understand not just serological patterns, but also immunity patterns using these multi-antigen serology panels.
April 6, 2024 at 8:32 AM
An exciting output of our inference is the well-known relationship between antibody titer and probability of infection. Using our method, we can understand not just serological patterns, but also immunity patterns using these multi-antigen serology panels.
We find:
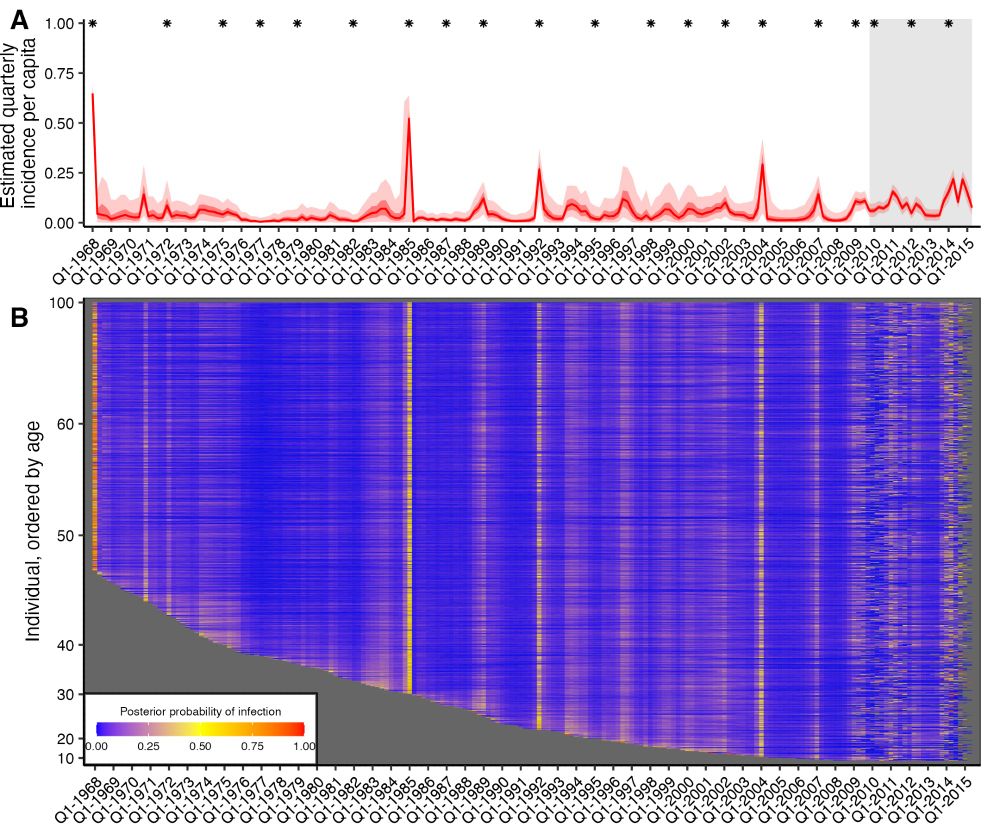
1. Serology-based attack rates are high, at around 18% infected per year.
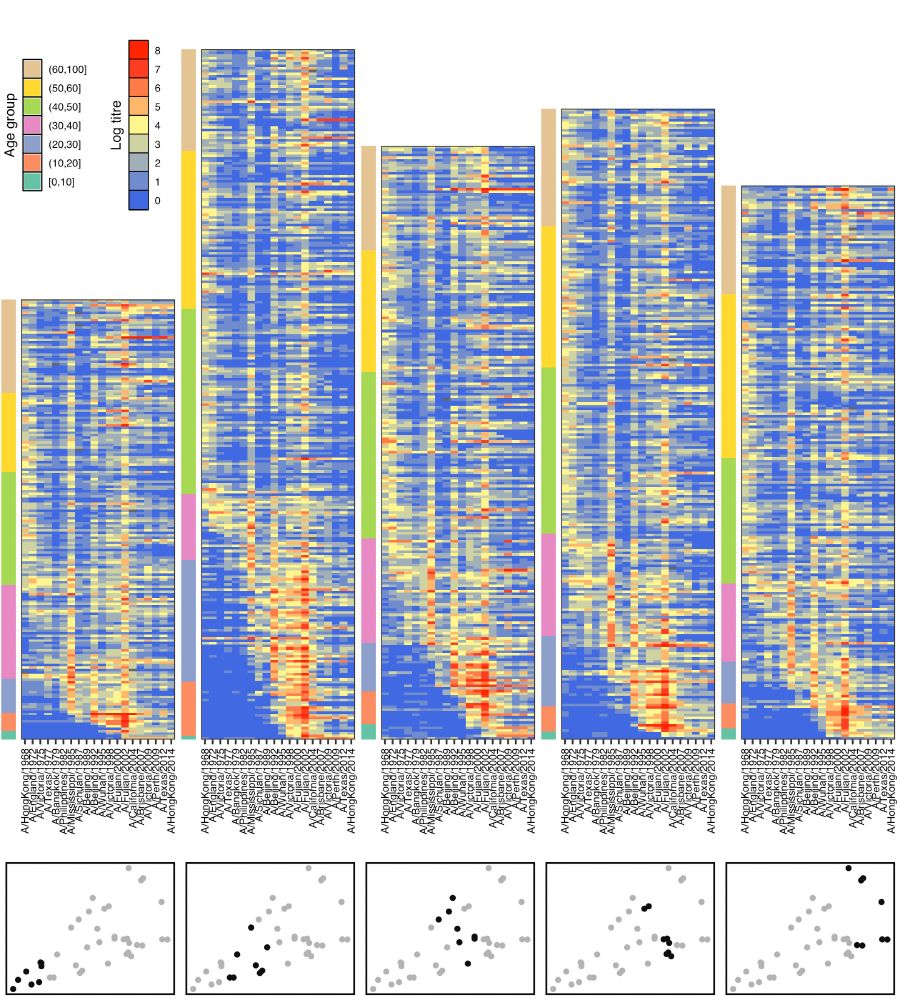
2. Influenza A/H3N2 infection rates are highest in children, decrease with age and plateau in adulthood.
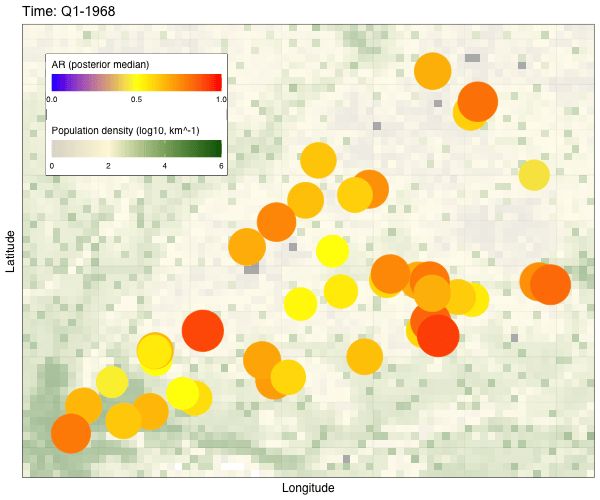
3. Incidence rates are highly correlated at this small spatial scale.
1. Serology-based attack rates are high, at around 18% infected per year.
2. Influenza A/H3N2 infection rates are highest in children, decrease with age and plateau in adulthood.
3. Incidence rates are highly correlated at this small spatial scale.
April 6, 2024 at 8:32 AM
We find:
1. Serology-based attack rates are high, at around 18% infected per year.
2. Influenza A/H3N2 infection rates are highest in children, decrease with age and plateau in adulthood.
3. Incidence rates are highly correlated at this small spatial scale.
1. Serology-based attack rates are high, at around 18% infected per year.
2. Influenza A/H3N2 infection rates are highest in children, decrease with age and plateau in adulthood.
3. Incidence rates are highly correlated at this small spatial scale.
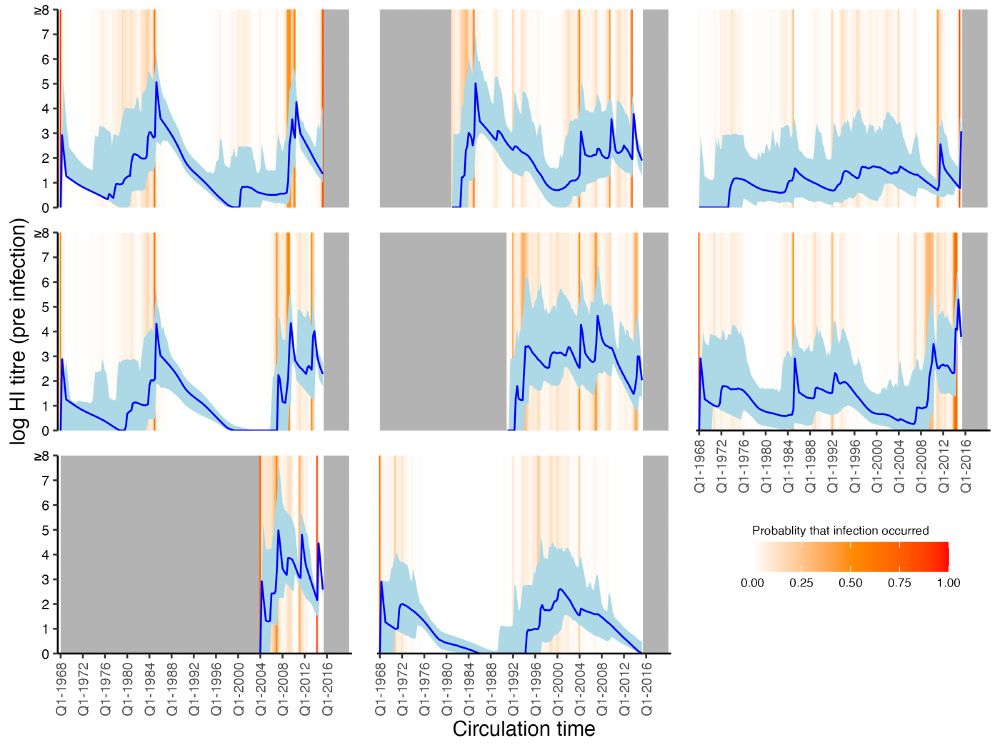
Fitting serosolver gave us estimates for: 1) each individual’s sequence of lifetime influenza infections; 2) incidence at a fine spatial scale; and 3) parameters of an antibody kinetics model describing boosting, waning, cross-reactivity and measurement error.
April 6, 2024 at 8:32 AM
Fitting serosolver gave us estimates for: 1) each individual’s sequence of lifetime influenza infections; 2) incidence at a fine spatial scale; and 3) parameters of an antibody kinetics model describing boosting, waning, cross-reactivity and measurement error.
This new paper brings these pieces together: we fit serosolver to our massive dataset of over 70,000 HI titers, summarizing antibody profiles against 20 A/H3N2 strains for 1,130 individuals from Guangzhou, China.
April 6, 2024 at 8:31 AM
This new paper brings these pieces together: we fit serosolver to our massive dataset of over 70,000 HI titers, summarizing antibody profiles against 20 A/H3N2 strains for 1,130 individuals from Guangzhou, China.