


Danny IncaRNAto
@incarnatolab.bsky.social
Associate Professor in Molecular Genetics | University of Groningen | Chief R&D Officer @ Serna Bio | #RNA structural ensembles & dynamics | https://www.incaRNAtolab.com | Views are my own
Highlights: new normalization method in rf-norm (Mitchell method, pubmed.ncbi.nlm.nih.gov/37334863/), statistics plots in rf-count & rf-count-genome, and secondary structure plots in rf-fold (powered by ViennaRNA v2.7.0) (2/n)

October 13, 2025 at 12:47 PM
Highlights: new normalization method in rf-norm (Mitchell method, pubmed.ncbi.nlm.nih.gov/37334863/), statistics plots in rf-count & rf-count-genome, and secondary structure plots in rf-fold (powered by ViennaRNA v2.7.0) (2/n)
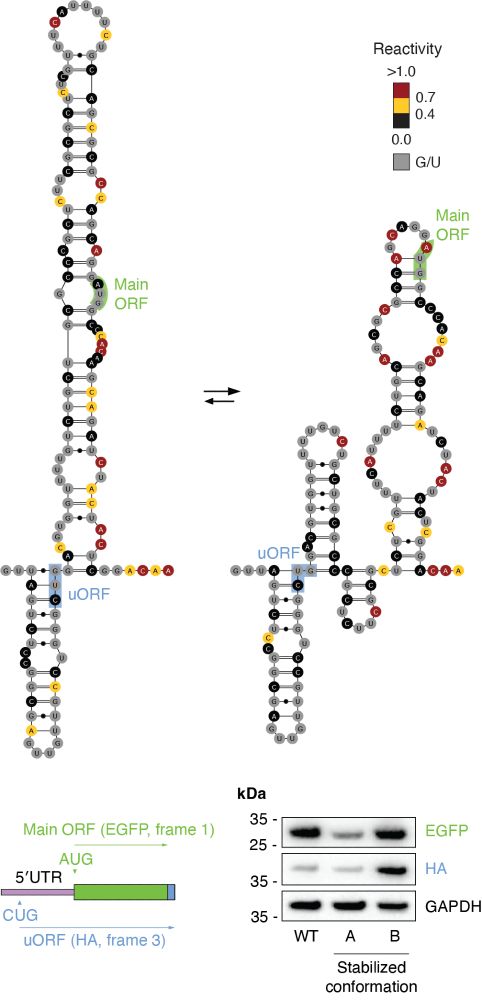
For example, the 5′-UTR of the CKS2 RNA populates two conformations, one promoting increased translation of a uORF, and one reducing translation of the main ORF. (7/n)
July 27, 2025 at 5:03 PM
For example, the 5′-UTR of the CKS2 RNA populates two conformations, one promoting increased translation of a uORF, and one reducing translation of the main ORF. (7/n)
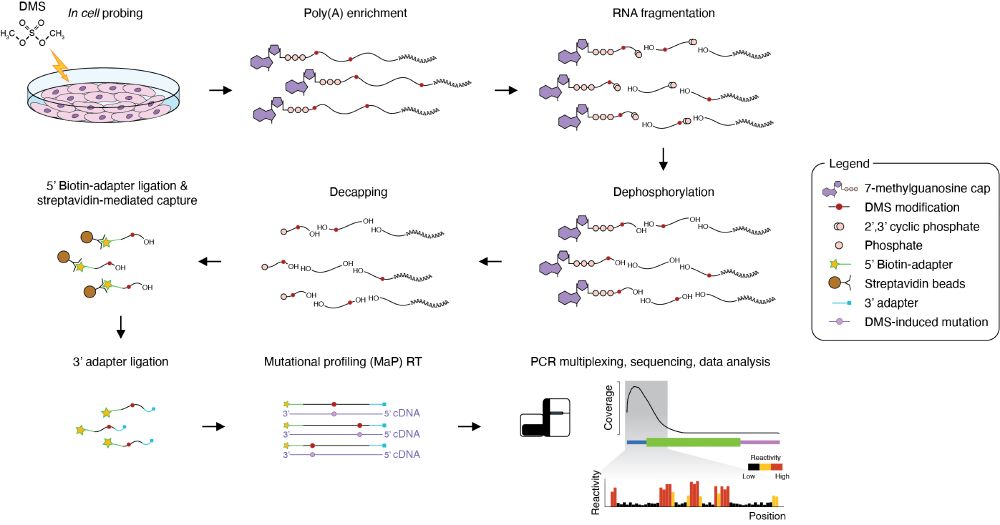
Next, we sought to explore the transcriptome of human cells. Due to the extreme sequencing depth required for ensemble deconvolution analyses, we developed 5′UTR-MaP, which enables the transcriptome-scale interrogation of 5′-UTRs (and, in general, of 5′-terminal regions). (5/n)
July 27, 2025 at 5:03 PM
Next, we sought to explore the transcriptome of human cells. Due to the extreme sequencing depth required for ensemble deconvolution analyses, we developed 5′UTR-MaP, which enables the transcriptome-scale interrogation of 5′-UTRs (and, in general, of 5′-terminal regions). (5/n)
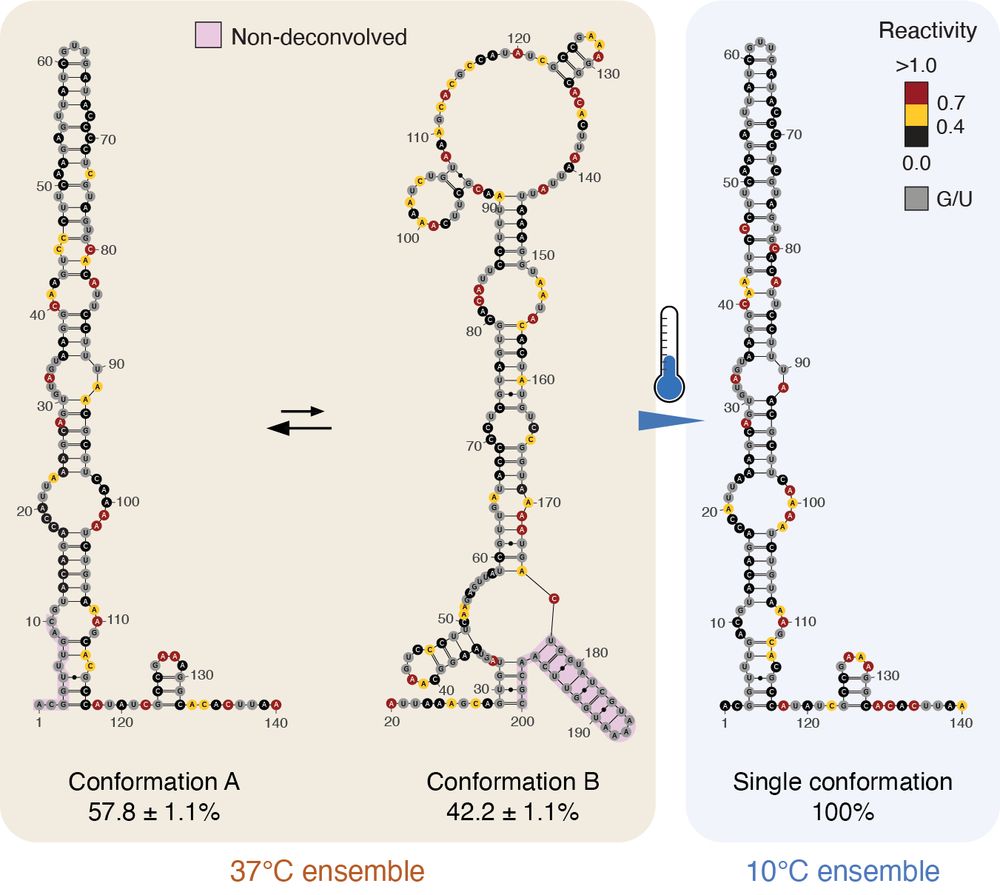
Interestingly, the well characterized cspA thermometer already populates both ON and OFF conformations at 37°C, and completely shifts to the ON conformation at 10°C, explaining why cspA is among the top-expressed proteins in the E. coli proteome. (4/n)
July 27, 2025 at 5:03 PM
Interestingly, the well characterized cspA thermometer already populates both ON and OFF conformations at 37°C, and completely shifts to the ON conformation at 10°C, explaining why cspA is among the top-expressed proteins in the E. coli proteome. (4/n)
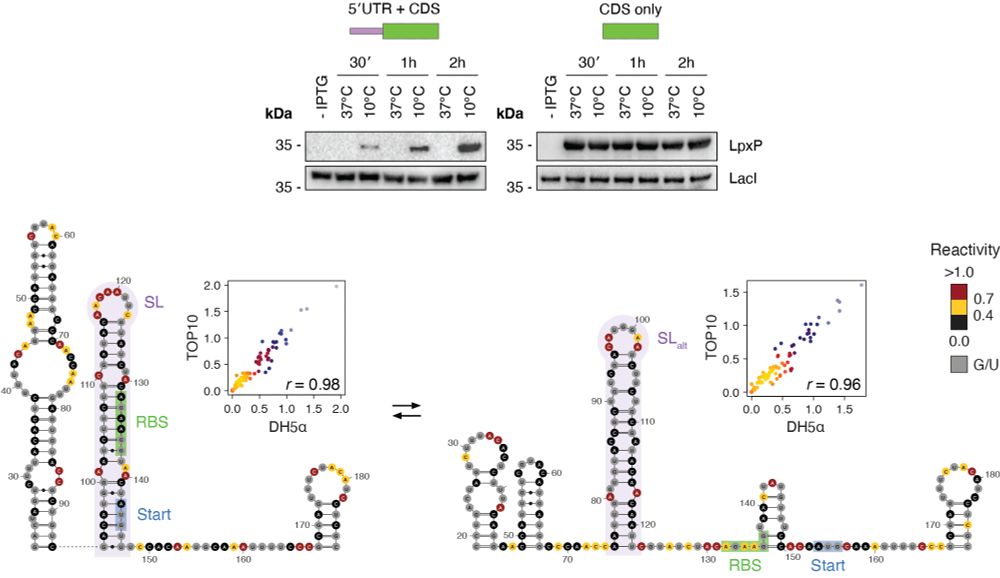
Subjecting bacteria to cold shock causes an increase in the number of regions populating 2+ alternative conformations. By combining these results with covariation analysis we identified a number of novel RNA cold thermometers, such as the 5′ UTR of lpxP. (3/n)
July 27, 2025 at 5:03 PM
Subjecting bacteria to cold shock causes an increase in the number of regions populating 2+ alternative conformations. By combining these results with covariation analysis we identified a number of novel RNA cold thermometers, such as the 5′ UTR of lpxP. (3/n)
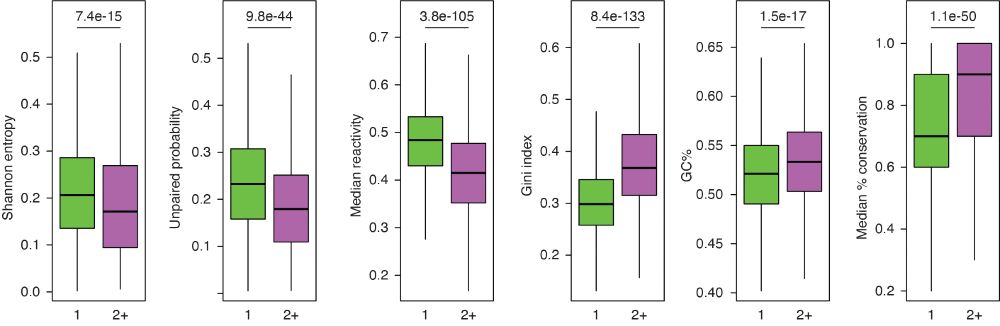
By performing ensemble deconvolution analysis of the E. coli transcriptome, we identified a large number of regions populating 2+ alternative conformations, characterized by features such as high G+C content, low Shannon entropy, high structuredness and conservation, etc. (2/n)
July 27, 2025 at 5:03 PM
By performing ensemble deconvolution analysis of the E. coli transcriptome, we identified a large number of regions populating 2+ alternative conformations, characterized by features such as high G+C content, low Shannon entropy, high structuredness and conservation, etc. (2/n)
rf-duplex will generate arc plots depicting the base-pairing probabilities inferred from RNA interaction capture experiments (e.g., PARIS, COMRADES, SPLASH) (8/n)

December 10, 2024 at 1:37 PM
rf-duplex will generate arc plots depicting the base-pairing probabilities inferred from RNA interaction capture experiments (e.g., PARIS, COMRADES, SPLASH) (8/n)
rf-norm will generate transcript-level step plots enabling the rapid comparison of raw signals across untreated/treated/denatured samples (7/n)

December 10, 2024 at 1:37 PM
rf-norm will generate transcript-level step plots enabling the rapid comparison of raw signals across untreated/treated/denatured samples (7/n)
rf-compare will generate arc plots providing an intuitive visual comparison of reference vs. predicted structure (6/n)

December 10, 2024 at 1:37 PM
rf-compare will generate arc plots providing an intuitive visual comparison of reference vs. predicted structure (6/n)
rf-peakcall will generate coverage plots across control/input and IP datasets, both at the level of individual transcripts, and as meta-gene plots (5/n)

December 10, 2024 at 1:37 PM
rf-peakcall will generate coverage plots across control/input and IP datasets, both at the level of individual transcripts, and as meta-gene plots (5/n)
rf-fold will generate plots including: barplot of reactivities, plot of window's median reactivity - transcript's median reactivity, arc plot of predicted structure, plot of window's Shannon entropy - transcript's median Shannon entropy, arc plot of base-pairing probabilities (4/n)

December 10, 2024 at 1:37 PM
rf-fold will generate plots including: barplot of reactivities, plot of window's median reactivity - transcript's median reactivity, arc plot of predicted structure, plot of window's Shannon entropy - transcript's median Shannon entropy, arc plot of base-pairing probabilities (4/n)
rf-eval will generate 3 types of plots: (a) distribution of reactivities on paired vs. unpaired bases; (b) ROC curve; (c) histogram summary of various metrics (unpaired coefficient, AUROC, DSCI (3/n)

December 10, 2024 at 1:37 PM
rf-eval will generate 3 types of plots: (a) distribution of reactivities on paired vs. unpaired bases; (b) ROC curve; (c) histogram summary of various metrics (unpaired coefficient, AUROC, DSCI (3/n)
rf-jackknife will now output a heatmap depicting the results of the grid search with various slope/intercept pairs (2/n)

December 10, 2024 at 1:37 PM
rf-jackknife will now output a heatmap depicting the results of the grid search with various slope/intercept pairs (2/n)