


George Gorczynski
@heygeorge.bsky.social
Data visualization is my profession and passion. Tableau whisperer. Enthusiast of photography, creative coding and generative art. Principal Consultant at Vizable Insights, helping clients make data beautiful and insightful.
NEW BLOG!
Starting a series of blogs about designing performant dashboards in #Tableau. This post is about making effcicient data sources.
Keep an eye for my next post about optimizing Tableau calculations.
vizableinsights.com/tableau-perf...
#dataviz #datavisualization #performance #dashboards
Starting a series of blogs about designing performant dashboards in #Tableau. This post is about making effcicient data sources.
Keep an eye for my next post about optimizing Tableau calculations.
vizableinsights.com/tableau-perf...
#dataviz #datavisualization #performance #dashboards

Tableau Performance tips & tricks - Vizable Insights
This article is about making efficient Tableau data sources. Practical tips to make targeted tweaks to the data source, to fine-tune performance.
vizableinsights.com
March 6, 2025 at 6:00 PM
NEW BLOG!
Starting a series of blogs about designing performant dashboards in #Tableau. This post is about making effcicient data sources.
Keep an eye for my next post about optimizing Tableau calculations.
vizableinsights.com/tableau-perf...
#dataviz #datavisualization #performance #dashboards
Starting a series of blogs about designing performant dashboards in #Tableau. This post is about making effcicient data sources.
Keep an eye for my next post about optimizing Tableau calculations.
vizableinsights.com/tableau-perf...
#dataviz #datavisualization #performance #dashboards
Reposted by George Gorczynski

#TodayinHistory #dataviz #Onthisday #OTD 📊
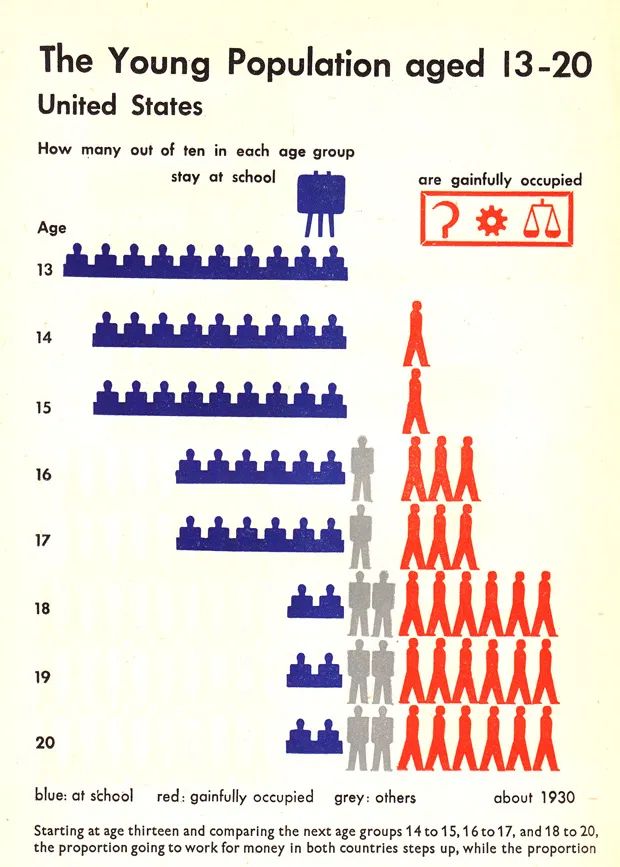
🎂Dec 10, 1882 Otto Neurath born in Vienna, Austria 🇦🇹
1924: Museum of Social Statistical Graphics and the ISOTYPE system, a method of showing social, technological, biological, and historical connections in pictorial form
🎂Dec 10, 1882 Otto Neurath born in Vienna, Austria 🇦🇹
1924: Museum of Social Statistical Graphics and the ISOTYPE system, a method of showing social, technological, biological, and historical connections in pictorial form


December 10, 2024 at 1:08 AM
#TodayinHistory #dataviz #Onthisday #OTD 📊
🎂Dec 10, 1882 Otto Neurath born in Vienna, Austria 🇦🇹
1924: Museum of Social Statistical Graphics and the ISOTYPE system, a method of showing social, technological, biological, and historical connections in pictorial form
🎂Dec 10, 1882 Otto Neurath born in Vienna, Austria 🇦🇹
1924: Museum of Social Statistical Graphics and the ISOTYPE system, a method of showing social, technological, biological, and historical connections in pictorial form
Reposted by George Gorczynski

3,000
I figure there might be.. *checks numbers* about 2,000 of you who haven't read my book.
You should read my book!
It's about how how we got into this big 💩 data mess and how we might get out.
You can get it from your local library or from your fave indie bookseller:
bookshop.org/p/books/livi...
You should read my book!
It's about how how we got into this big 💩 data mess and how we might get out.
You can get it from your local library or from your fave indie bookseller:
bookshop.org/p/books/livi...

Living in Data: A Citizen's Guide to a Better Information Future a book by Jer Thorp
Jer Thorp's analysis of the word "data" in 10,325 New York Times stories written between 1984 and 2018 shows a distinct trend: among the words most closely associated with "data," we find not only its...
bookshop.org
November 16, 2024 at 5:54 PM
3,000
👉 6 text formatting hacks to make your dashboards clean and readable.
I've put together a guide with six text formatting hacks to instantly improve your dashboards.
shorturl.at/dcLRb
#VizableVizTips #DataViz #DashboardDesign #TableauTips #DataVisualization #CleanDesign #Tableau #Datafam
I've put together a guide with six text formatting hacks to instantly improve your dashboards.
shorturl.at/dcLRb
#VizableVizTips #DataViz #DashboardDesign #TableauTips #DataVisualization #CleanDesign #Tableau #Datafam

George Gorczynski on LinkedIn: Data visualization text formatting tips
👉 6 text formatting hacks to make your dashboards clean and readable.
I've put together a guide with six text formatting hacks to instantly improve the…
www.linkedin.com
November 13, 2024 at 4:35 AM
👉 6 text formatting hacks to make your dashboards clean and readable.
I've put together a guide with six text formatting hacks to instantly improve your dashboards.
shorturl.at/dcLRb
#VizableVizTips #DataViz #DashboardDesign #TableauTips #DataVisualization #CleanDesign #Tableau #Datafam
I've put together a guide with six text formatting hacks to instantly improve your dashboards.
shorturl.at/dcLRb
#VizableVizTips #DataViz #DashboardDesign #TableauTips #DataVisualization #CleanDesign #Tableau #Datafam
Reposted by George Gorczynski

New from Ken Flerlage, Embedding Social Media in Tableau Part 2: www.flerlagetwins.com/2024/09/embe...

Embedding Social Media in Tableau: Part 2
In March, 2023, I wrote a blog about embedding social media in Tableau . In that post, I covered embedding Instagram, LinkedIn, Facebook, ...
www.flerlagetwins.com
November 11, 2024 at 12:48 PM
New from Ken Flerlage, Embedding Social Media in Tableau Part 2: www.flerlagetwins.com/2024/09/embe...