


Peter Ellis
@freerangestats.info
Director, Statistics for Development Division, at the Pacific Community. Posts are personal views, and most likely to be about data and #rstats, maybe with bits of history, social science and philosophy thrown in. Blog is at https://freerangestats.info/.
New Zealand mentioned!

November 10, 2025 at 5:55 AM
New Zealand mentioned!
I wasn't looking into the false positive rate (I was only interested in the shape) but you are correct, nothing about this suggests the null is wrongly rejected more than it should be, in this tightly controlled artificial situation. In fact false positives are a bit on the low side:

November 9, 2025 at 10:00 PM
I wasn't looking into the false positive rate (I was only interested in the shape) but you are correct, nothing about this suggests the null is wrongly rejected more than it should be, in this tightly controlled artificial situation. In fact false positives are a bit on the low side:
I had a play in #rstats with the distribution of p-values under a true null hypothesis, for two-sample tests of equal proportions at different sample sizes. They're not uniformly distributed, but sometimes they are more non-uniform than other times. freerangestats.info/blog/2025/11...

November 9, 2025 at 2:17 AM
I had a play in #rstats with the distribution of p-values under a true null hypothesis, for two-sample tests of equal proportions at different sample sizes. They're not uniformly distributed, but sometimes they are more non-uniform than other times. freerangestats.info/blog/2025/11...
Countries with more economic inequality have higher homicide rates. But for any given country, the relationship isn't as strong. This poses a multilevel modelling problem that it's easy to trip over. I tripped, righted (I hope), and blogged about it with #rstats. freerangestats.info/blog/2025/10...


October 18, 2025 at 6:56 AM
Countries with more economic inequality have higher homicide rates. But for any given country, the relationship isn't as strong. This poses a multilevel modelling problem that it's easy to trip over. I tripped, righted (I hope), and blogged about it with #rstats. freerangestats.info/blog/2025/10...
Teaching girls maths leads to jazz, my 1924 author in his 70s argues. (Excellent book BTW even if its judgements are sometimes a little questionable)

October 18, 2025 at 12:12 AM
Teaching girls maths leads to jazz, my 1924 author in his 70s argues. (Excellent book BTW even if its judgements are sometimes a little questionable)
History is full of interesting snippets. This from a 1924 reminiscence of London in the 1850s and 1860s. I wonder what else made up Miss Holt's story.

October 17, 2025 at 11:17 PM
History is full of interesting snippets. This from a 1924 reminiscence of London in the 1850s and 1860s. I wonder what else made up Miss Holt's story.
I drew a map with #rstats of the locations involved in the Ameila Earhart / Fred Noonan disappearance in 1937. The sequence of events required for there to be anything helpful and new in US archives are pretty implausible. Most likely they fell in the sea, sadly. freerangestats.info/blog/2025/10...

October 5, 2025 at 7:06 AM
I drew a map with #rstats of the locations involved in the Ameila Earhart / Fred Noonan disappearance in 1937. The sequence of events required for there to be anything helpful and new in US archives are pretty implausible. Most likely they fell in the sea, sadly. freerangestats.info/blog/2025/10...
The western Pacific in 1939 as seen by ChatGPT. American Samoa and the Marshalls appear to be west of Western Australia. Philippines has been mistaken for the Marianas and wrongly shown as Japanese-controlled. France seems in control of all 'Papua New Caledonia'.

October 4, 2025 at 6:26 AM
The western Pacific in 1939 as seen by ChatGPT. American Samoa and the Marshalls appear to be west of Western Australia. Philippines has been mistaken for the Marianas and wrongly shown as Japanese-controlled. France seems in control of all 'Papua New Caledonia'.
Good morning Manila. Here for a few days of talks and a seminar on Pacific statistics at the Asian Development Bank.

September 27, 2025 at 11:40 PM
Good morning Manila. Here for a few days of talks and a seminar on Pacific statistics at the Asian Development Bank.
I am re-posting (for different timezone audiences) this amazing job opportunity to drive data innovation, governance and stewardship in the Pacific. This time with a photo taken from across the road of the headquarters where this role is based. Applications close 26 October, New Caledonia time.

September 25, 2025 at 8:52 PM
I am re-posting (for different timezone audiences) this amazing job opportunity to drive data innovation, governance and stewardship in the Pacific. This time with a photo taken from across the road of the headquarters where this role is based. Applications close 26 October, New Caledonia time.
I also have a look at #employment, and #vaccination rates, in Papua New Guinea. Again the data is poor, but it's enough to see that a) formal employment is a very low proportion of the population and b) life-saving immunization rates are some of the lowest in the world.


September 6, 2025 at 9:31 PM
I also have a look at #employment, and #vaccination rates, in Papua New Guinea. Again the data is poor, but it's enough to see that a) formal employment is a very low proportion of the population and b) life-saving immunization rates are some of the lowest in the world.
Second issue is population. We just don't know how many people are in Papua New Guinea, to within a few million. The 2024 census results are due soon and will hopefully help, but are likely to leave a bunch of quesitons. In the meantime, we have a big range of #demography estimates to choose from.

September 6, 2025 at 9:28 PM
Second issue is population. We just don't know how many people are in Papua New Guinea, to within a few million. The 2024 census results are due soon and will hopefully help, but are likely to leave a bunch of quesitons. In the meantime, we have a big range of #demography estimates to choose from.
I just posted an #rstats #econsky blog using data from ANU's Papua New Guinea Economic Database. First issue was GDP deflator v CPI for real GDP. Using CPI to make it 'real', we see PNG GDP per capita declined by >20% since independence. freerangestats.info/blog/2025/09...


September 6, 2025 at 9:24 PM
I just posted an #rstats #econsky blog using data from ANU's Papua New Guinea Economic Database. First issue was GDP deflator v CPI for real GDP. Using CPI to make it 'real', we see PNG GDP per capita declined by >20% since independence. freerangestats.info/blog/2025/09...
I fret about whether I used researcher degrees of freedom to get the result I wanted in choosing a model that had the right number of wiggliness. Overall I think I was ok. I also explore (inadequately) the issue of spline versus tensor product smooths. All this at freerangestats.info/blog/2025/08...

August 23, 2025 at 3:27 AM
I fret about whether I used researcher degrees of freedom to get the result I wanted in choosing a model that had the right number of wiggliness. Overall I think I was ok. I also explore (inadequately) the issue of spline versus tensor product smooths. All this at freerangestats.info/blog/2025/08...
I hand-code a plot showing marginal effects from a moderately complex model, and compare it to that drawn by the {{marginaleffects}} #rstats package from @vincentab.bsky.social , @andrew.heiss.phd and @noahgreifer.bsky.social . I had Reasons.


August 23, 2025 at 3:25 AM
I hand-code a plot showing marginal effects from a moderately complex model, and compare it to that drawn by the {{marginaleffects}} #rstats package from @vincentab.bsky.social , @andrew.heiss.phd and @noahgreifer.bsky.social . I had Reasons.
I talk about accessing the UN #SDGs database API from #rstats; I had to do this pretty crudely, but it works. I needed this data because there is an SDG indicator on time spent on domestic and care work. There's some fiddly extra cleaning needed because of countries' differing ideas of age groups.

August 23, 2025 at 3:21 AM
For example, I show how to control the colour of individual edges connecting notes in a diagram drawn with {{ggdag}}. This was surprisingly fiddly and I couldn't find how to do this documented anywhere.

August 23, 2025 at 3:19 AM
For example, I show how to control the colour of individual edges connecting notes in a diagram drawn with {{ggdag}}. This was surprisingly fiddly and I couldn't find how to do this documented anywhere.
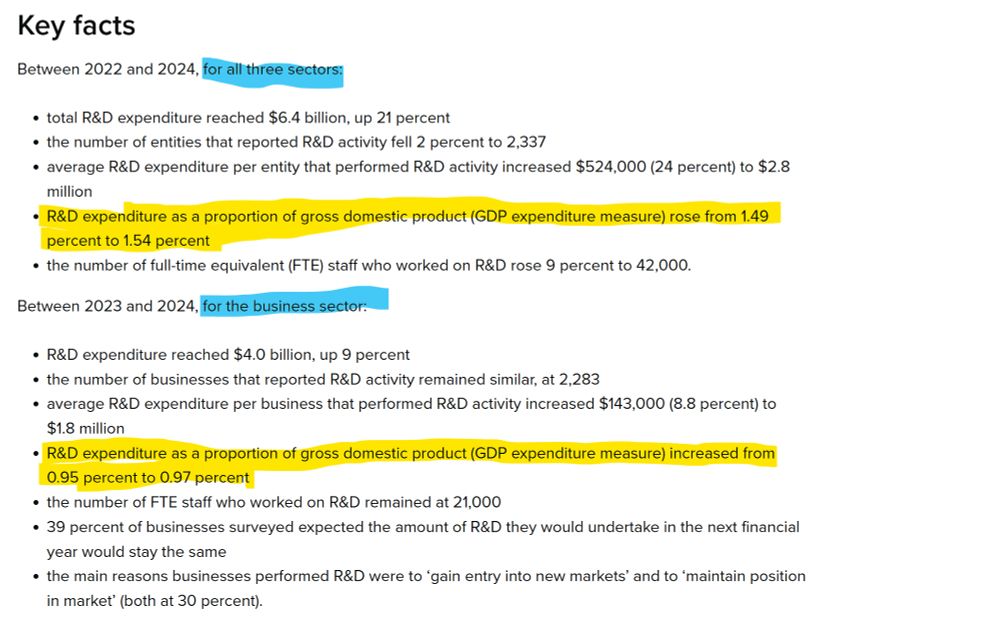
This is an easy enough misreading of the Stats NZ key facts because of the identical wording in the yellow highlighted bits, and you have to read the blue highlighted bits to realise which one is which.
August 21, 2025 at 10:12 PM
This is an easy enough misreading of the Stats NZ key facts because of the identical wording in the yellow highlighted bits, and you have to read the blue highlighted bits to realise which one is which.
I think you've got that wrong, looks like you've added a business expenditure on R&D figure to what is otherwise a gross expenditure on R&D chart? Should be 1.54% and a slight increase.

August 21, 2025 at 10:08 PM
I think you've got that wrong, looks like you've added a business expenditure on R&D figure to what is otherwise a gross expenditure on R&D chart? Should be 1.54% and a slight increase.
'Bullshit' seems unfair, although I don't know all that's in the other articles. But this good Guardian piece seems to show women read more than men, and reading in general is declining, from multiple data sources. I thought that was the main point floating around?


August 17, 2025 at 10:55 AM
'Bullshit' seems unfair, although I don't know all that's in the other articles. But this good Guardian piece seems to show women read more than men, and reading in general is declining, from multiple data sources. I thought that was the main point floating around?
Now I am thinking I didn't think about ti() as much as I should have. The plots below compare the results of s(log(gdprppppc), prop_male) with ti(log(gdprppppc)) + ti(prop_male) + ti(log(gdprppppc), prop_male). But it still doesn't change the fact that prop_male doesn't help the model.
August 15, 2025 at 8:34 PM
Now I am thinking I didn't think about ti() as much as I should have. The plots below compare the results of s(log(gdprppppc), prop_male) with ti(log(gdprppppc)) + ti(prop_male) + ti(log(gdprppppc), prop_male). But it still doesn't change the fact that prop_male doesn't help the model.
The final model has strong evidence of the relationships of PPP GDP per capita, and gender inequality, and time, to total fertility rate. But no evidence of male share of domestic work mattering.


August 15, 2025 at 1:36 AM
The final model has strong evidence of the relationships of PPP GDP per capita, and gender inequality, and time, to total fertility rate. But no evidence of male share of domestic work mattering.
The relationship reverses completely if all countries are included - overall, there is lower birth rates in countries with higher proportion of domestic work done by men. It's easy enough to see that this is because of confounding factors of general economic opportunities for women.


August 15, 2025 at 1:33 AM
The relationship reverses completely if all countries are included - overall, there is lower birth rates in countries with higher proportion of domestic work done by men. It's easy enough to see that this is because of confounding factors of general economic opportunities for women.
However, if you looked at just high income countries and just two variables, there *appears* to be a relationship. This is basically a scatter plot I saw doing the rounds a few months ago showing "men doing more housework leads to higher birthrates".

August 15, 2025 at 1:29 AM
However, if you looked at just high income countries and just two variables, there *appears* to be a relationship. This is basically a scatter plot I saw doing the rounds a few months ago showing "men doing more housework leads to higher birthrates".
OK I have finished part 1 (less technical) of an epic #rstats and #demography blog post on men doing domestic work and its relationship to total fertility rate at the country level.
Ultimately there is none, once you control for GDP per capita and inequality.
freerangestats.info/blog/2025/08...
Ultimately there is none, once you control for GDP per capita and inequality.
freerangestats.info/blog/2025/08...
August 15, 2025 at 1:26 AM
OK I have finished part 1 (less technical) of an epic #rstats and #demography blog post on men doing domestic work and its relationship to total fertility rate at the country level.
Ultimately there is none, once you control for GDP per capita and inequality.
freerangestats.info/blog/2025/08...
Ultimately there is none, once you control for GDP per capita and inequality.
freerangestats.info/blog/2025/08...