


Eric Fauman (he/him)
@ericfauman.bsky.social
GWAS whisperer.
It's usually the closest gene.
Executive Director, Integrative Biology, Internal Medicine Research Unit. Pfizer R&D. All views my own.
Also cats.
It's usually the closest gene.
Executive Director, Integrative Biology, Internal Medicine Research Unit. Pfizer R&D. All views my own.
Also cats.
I did filter to p < 5e-8. But we also some filtering to independent lead snps. We also have sissies studies ranging from n of a few hundred to a few million subjects.
September 28, 2025 at 3:14 PM
I did filter to p < 5e-8. But we also some filtering to independent lead snps. We also have sissies studies ranging from n of a few hundred to a few million subjects.
It's a little odd. I am plotting the log10 of the -log10(pvalue) on the x axis so in this plot the null signal drops off much faster than what we observe in the @gwascatalog.bsky.social
I'm curious if anyone has a hypothesis why the lead SNP p-values would have this distribution.
I'm curious if anyone has a hypothesis why the lead SNP p-values would have this distribution.

September 28, 2025 at 1:50 PM
It's a little odd. I am plotting the log10 of the -log10(pvalue) on the x axis so in this plot the null signal drops off much faster than what we observe in the @gwascatalog.bsky.social
I'm curious if anyone has a hypothesis why the lead SNP p-values would have this distribution.
I'm curious if anyone has a hypothesis why the lead SNP p-values would have this distribution.
Sounds great!
September 28, 2025 at 11:12 AM
Sounds great!
The effect size in gwas catalog are harder to compare because they are not necessarily in standard deviation units.
September 28, 2025 at 1:07 AM
The effect size in gwas catalog are harder to compare because they are not necessarily in standard deviation units.
Oh you win! Yes, all are inappropriate attempts to avoid underflows.
September 28, 2025 at 1:05 AM
Oh you win! Yes, all are inappropriate attempts to avoid underflows.
Bonus question. Why is the plot of log10(count) as a function of log10(-log10(p)) a straight line?
Recall, the data is all the lead SNPs recorded in the GWAS catalog.
Recall, the data is all the lead SNPs recorded in the GWAS catalog.
September 27, 2025 at 11:42 PM
Bonus question. Why is the plot of log10(count) as a function of log10(-log10(p)) a straight line?
Recall, the data is all the lead SNPs recorded in the GWAS catalog.
Recall, the data is all the lead SNPs recorded in the GWAS catalog.
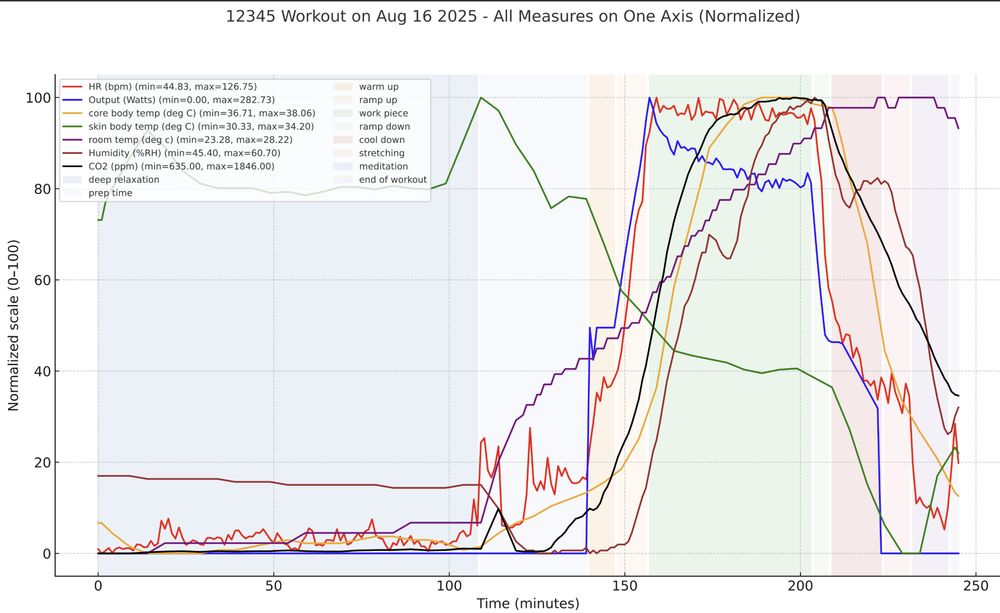
For fun I'm also tracking the room temperature, humidity and CO2 which all increase during the workout, as expected.
All the analysis, charting and graphs were done by GPT5 operating on a google sheet where I collected the minute by minute stats.
All the analysis, charting and graphs were done by GPT5 operating on a google sheet where I collected the minute by minute stats.
August 16, 2025 at 10:50 PM
For fun I'm also tracking the room temperature, humidity and CO2 which all increase during the workout, as expected.
All the analysis, charting and graphs were done by GPT5 operating on a google sheet where I collected the minute by minute stats.
All the analysis, charting and graphs were done by GPT5 operating on a google sheet where I collected the minute by minute stats.
GPT4o pointed me to a device that measures core and skin body temperature. In gold you can see my core body temp continues to rise even after I reach my max heart rate (red), thus requiring further decreases in the work output (blue). Skin temperature drops during the workout, thanks to fans + sweat
August 16, 2025 at 10:49 PM
GPT4o pointed me to a device that measures core and skin body temperature. In gold you can see my core body temp continues to rise even after I reach my max heart rate (red), thus requiring further decreases in the work output (blue). Skin temperature drops during the workout, thanks to fans + sweat
This graph plots a study I did on myself which involves trying to maintain a heart rate of exactly 123 bpm for 45 minutes. Doing so requires adjusting the work output. In this plot the red line is my heart rate while the blue line is the work output, which you can see decreases over time.
August 16, 2025 at 10:46 PM
This graph plots a study I did on myself which involves trying to maintain a heart rate of exactly 123 bpm for 45 minutes. Doing so requires adjusting the work output. In this plot the red line is my heart rate while the blue line is the work output, which you can see decreases over time.
Specifically, the phenomenon is called cardiovascular drift and it is a consequence of the body having to do the mechanical work and then also additional work to dissipate the heat generated by the effort, especially the vasodilation to direct internal body heat to the surface.
August 16, 2025 at 10:44 PM
Specifically, the phenomenon is called cardiovascular drift and it is a consequence of the body having to do the mechanical work and then also additional work to dissipate the heat generated by the effort, especially the vasodilation to direct internal body heat to the surface.
Isn't that the beginning of the movie "Brazil"?
August 16, 2025 at 10:37 PM
Isn't that the beginning of the movie "Brazil"?
It could be like designing an antibody to reduce circulating cystatin C levels in an attempt to improve kidney function...
June 23, 2025 at 3:57 AM
It could be like designing an antibody to reduce circulating cystatin C levels in an attempt to improve kidney function...
And if that's the case, then we haven't really established a causal link between making people walk faster and seeing them age slower.
June 23, 2025 at 3:30 AM
And if that's the case, then we haven't really established a causal link between making people walk faster and seeing them age slower.
Thanks for these caveats.
I guess I'm just surprised a major chromosomal rearrangement can fix in a population so quickly with no apparent impact on the effective population size. Is there good literature on this across other species.
I guess I'm just surprised a major chromosomal rearrangement can fix in a population so quickly with no apparent impact on the effective population size. Is there good literature on this across other species.
May 26, 2025 at 11:25 AM
Thanks for these caveats.
I guess I'm just surprised a major chromosomal rearrangement can fix in a population so quickly with no apparent impact on the effective population size. Is there good literature on this across other species.
I guess I'm just surprised a major chromosomal rearrangement can fix in a population so quickly with no apparent impact on the effective population size. Is there good literature on this across other species.