

easystats
@easystats.github.io
Official channel of {easystats}, a collection of #rstats 📦s with a unifying and consistent framework for statistical modeling, visualization, and reporting.
“Statistics are like sausages. It’s better not to see them being made, unless you use easystats.”
“Statistics are like sausages. It’s better not to see them being made, unless you use easystats.”
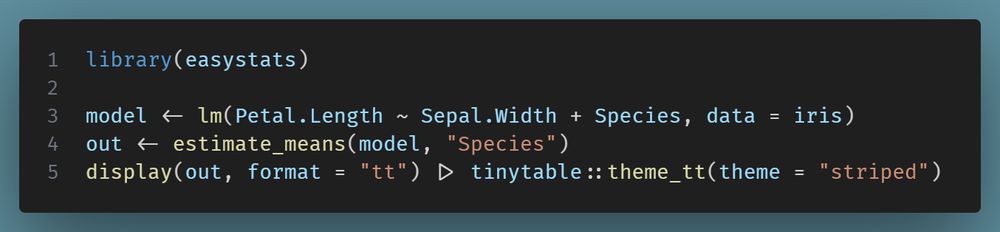
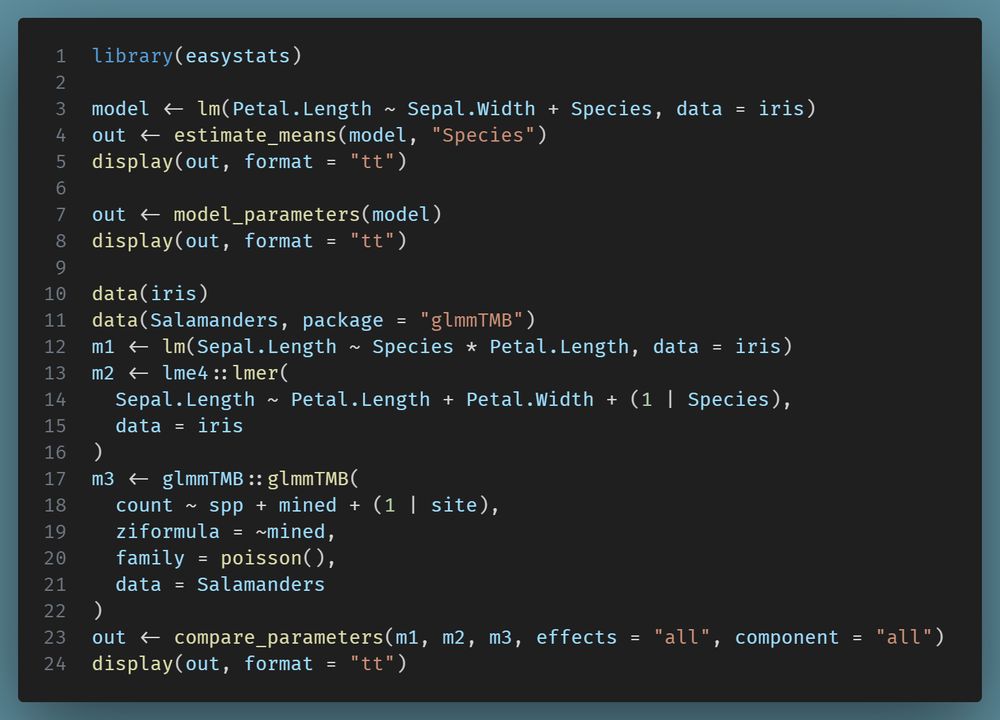
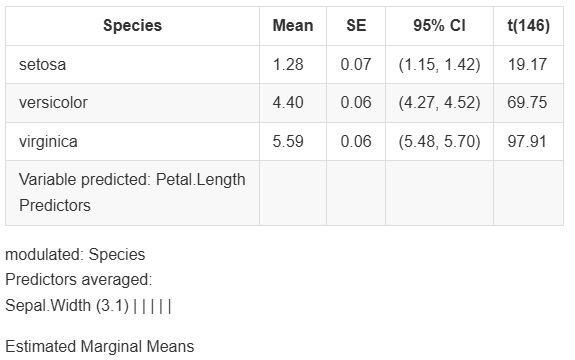
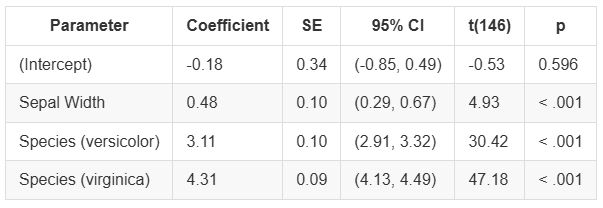
That "tt" option is now fully rolled out across several #easystats packages, powered by the amazing {tinytable} package. This means you can create tables in a gazillion different output formats! How cool is that? 🤯

September 1, 2025 at 6:04 AM
That "tt" option is now fully rolled out across several #easystats packages, powered by the amazing {tinytable} package. This means you can create tables in a gazillion different output formats! How cool is that? 🤯
And you can totally control the vibe! Use the `format` argument to get "markdown" (for a classic kable look), "html" (for a sleek gt-table), or the new kid on the block, "tt" (for a tinytable masterpiece!).

September 1, 2025 at 6:04 AM
And you can totally control the vibe! Use the `format` argument to get "markdown" (for a classic kable look), "html" (for a sleek gt-table), or the new kid on the block, "tt" (for a tinytable masterpiece!).
... and when they print, it's thanks to some behind-the-scenes magic with `insight::format_table()` and `insight::export_table()`! ✨
But there's more! Many #easystats functions also have a `display()` method. Think of it as your personal table stylist, making everything look super user-friendly! 💅
But there's more! Many #easystats functions also have a `display()` method. Think of it as your personal table stylist, making everything look super user-friendly! 💅

September 1, 2025 at 6:04 AM
... and when they print, it's thanks to some behind-the-scenes magic with `insight::format_table()` and `insight::export_table()`! ✨
But there's more! Many #easystats functions also have a `display()` method. Think of it as your personal table stylist, making everything look super user-friendly! 💅
But there's more! Many #easystats functions also have a `display()` method. Think of it as your personal table stylist, making everything look super user-friendly! 💅
Alrighty, {easystats} users! 👋 Ever wonder how those neat tables magically appear in your R console, or even better, in your fancy #rstats Markdown and Quarto docs?
Well, most of the objects you work with in {easystats} are basically tables, i.e. a 2D matrix with columns and rows...
Well, most of the objects you work with in {easystats} are basically tables, i.e. a 2D matrix with columns and rows...

September 1, 2025 at 6:04 AM
Alrighty, {easystats} users! 👋 Ever wonder how those neat tables magically appear in your R console, or even better, in your fancy #rstats Markdown and Quarto docs?
Well, most of the objects you work with in {easystats} are basically tables, i.e. a 2D matrix with columns and rows...
Well, most of the objects you work with in {easystats} are basically tables, i.e. a 2D matrix with columns and rows...
Just dodging is not yet implemented in {tinyplot}, but hopefully coming soon!
July 22, 2025 at 3:27 PM
Just dodging is not yet implemented in {tinyplot}, but hopefully coming soon!
As you can see, many plot types already work, just some fine-tuning left to do...
July 22, 2025 at 3:27 PM
As you can see, many plot types already work, just some fine-tuning left to do...
🎉 Great news, R users! 🎉 We're thrilled to announce that {tinyplot} support is coming to the #rstats #easystats project! Get ready for even more amazing stuff to make your data analysis a breeze! 📊✨
@gmcd.bsky.social @vincentab.bsky.social @zeileis.org
@gmcd.bsky.social @vincentab.bsky.social @zeileis.org
July 22, 2025 at 3:27 PM
🎉 Great news, R users! 🎉 We're thrilled to announce that {tinyplot} support is coming to the #rstats #easystats project! Get ready for even more amazing stuff to make your data analysis a breeze! 📊✨
@gmcd.bsky.social @vincentab.bsky.social @zeileis.org
@gmcd.bsky.social @vincentab.bsky.social @zeileis.org
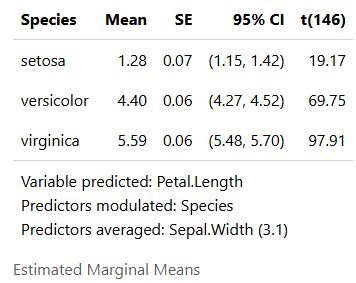
Since `display(format = "tt")` returns a `tinytable` object, you can easily modify the table to meet your needs.
July 22, 2025 at 7:47 AM
Since `display(format = "tt")` returns a `tinytable` object, you can easily modify the table to meet your needs.
Here's the default HTML rendering.
July 22, 2025 at 7:45 AM
Here's the default HTML rendering.
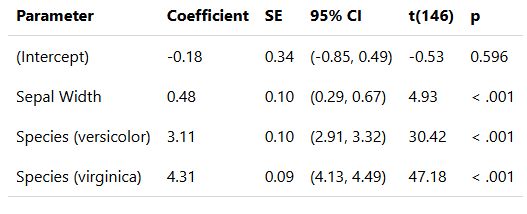
Improved support for the great {tinytable}📦 from @vincentab.bsky.social coming to the easystats packages! Use the `display()` method for different output formats of your tables - HTML, markdown, or - when `format = "tt"` a `tinytable` object that renders context-dependent.
#easystats #rstats
#easystats #rstats
July 22, 2025 at 7:42 AM
Improved support for the great {tinytable}📦 from @vincentab.bsky.social coming to the easystats packages! Use the `display()` method for different output formats of your tables - HTML, markdown, or - when `format = "tt"` a `tinytable` object that renders context-dependent.
#easystats #rstats
#easystats #rstats
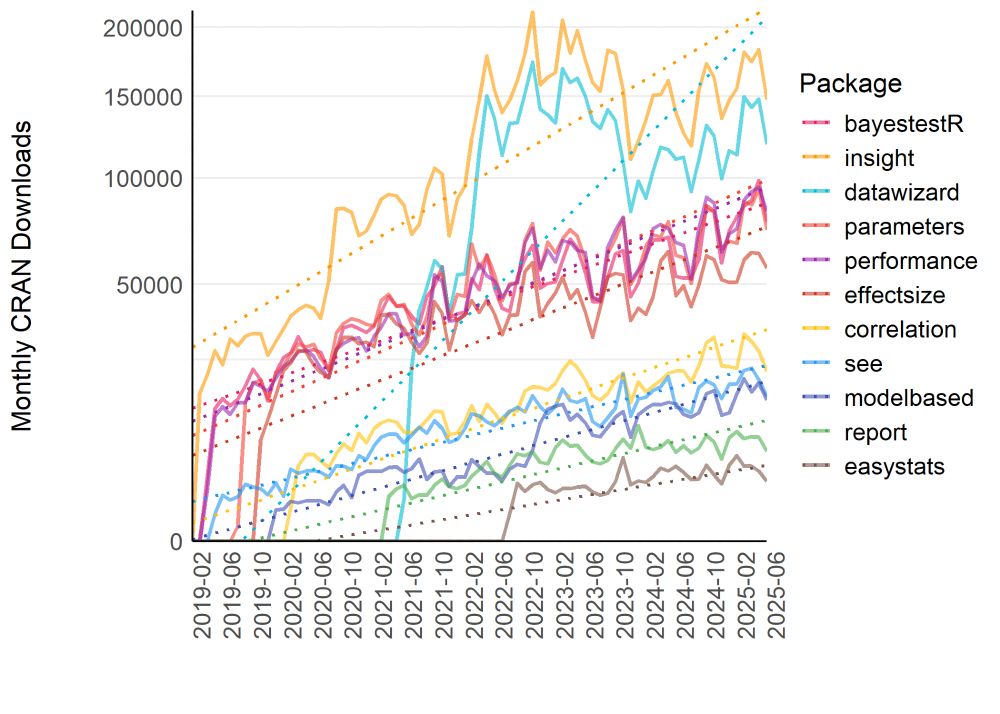
Yay, we have reached the 30 million downloads mark (and > 10k citations of our packages)! #easystats #rstats
(nice metrics, despite not 100% accurate, but still...)
(nice metrics, despite not 100% accurate, but still...)
July 5, 2025 at 1:46 PM
Yay, we have reached the 30 million downloads mark (and > 10k citations of our packages)! #easystats #rstats
(nice metrics, despite not 100% accurate, but still...)
(nice metrics, despite not 100% accurate, but still...)
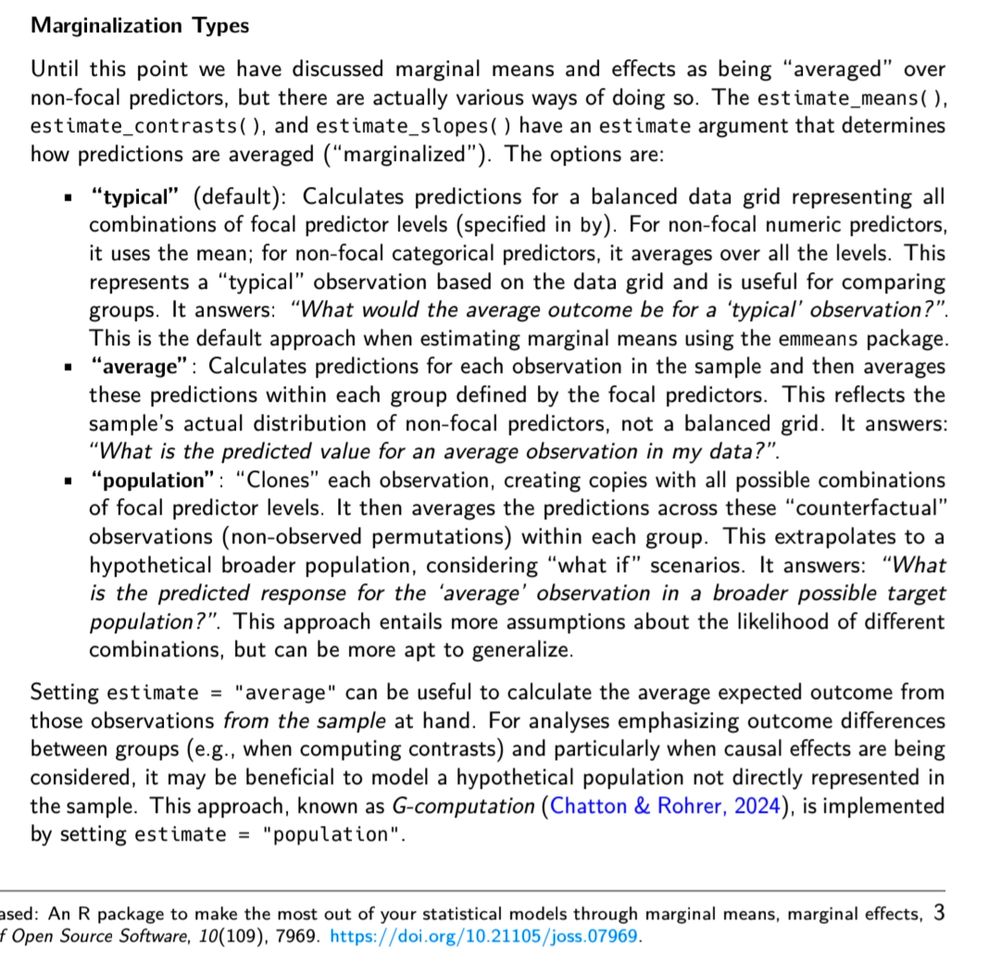
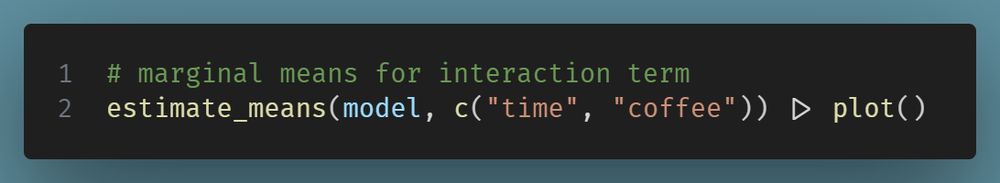
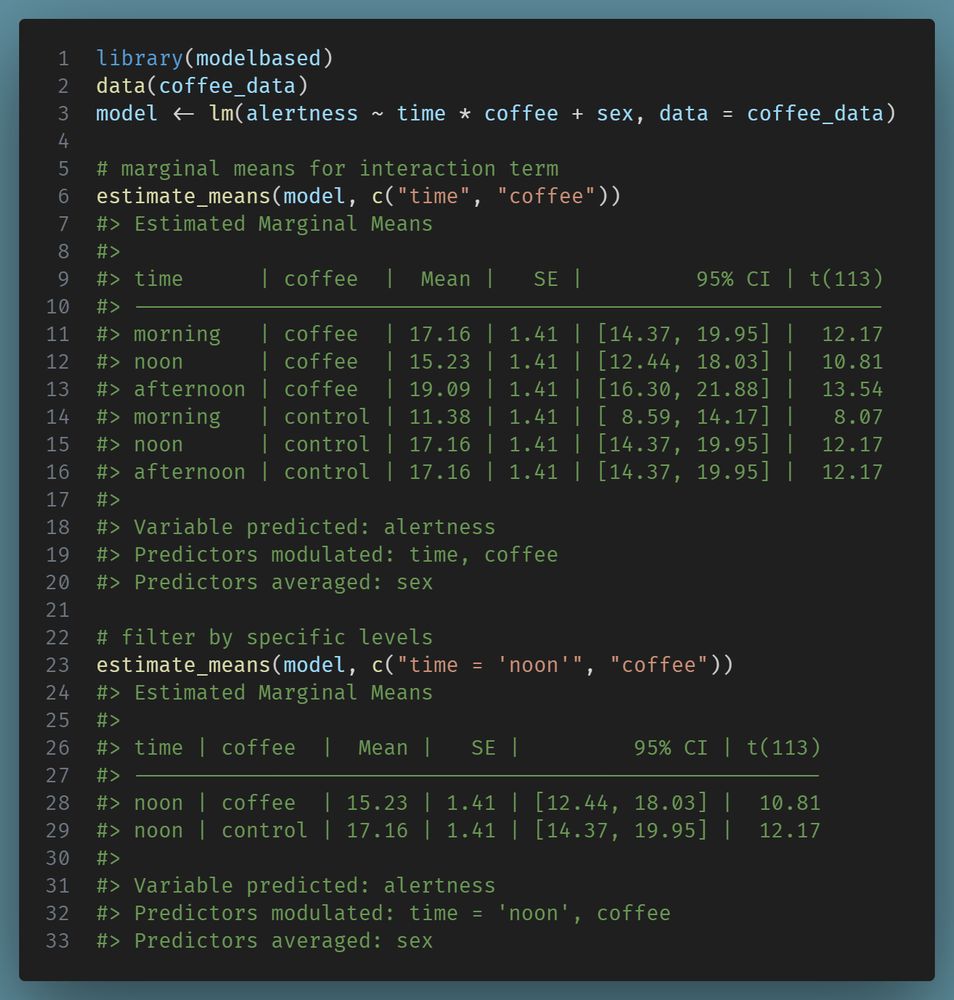
Page 3 in the paper (or the docs: easystats.github.io/modelbased/r...)
May 31, 2025 at 1:09 PM
Page 3 in the paper (or the docs: easystats.github.io/modelbased/r...)
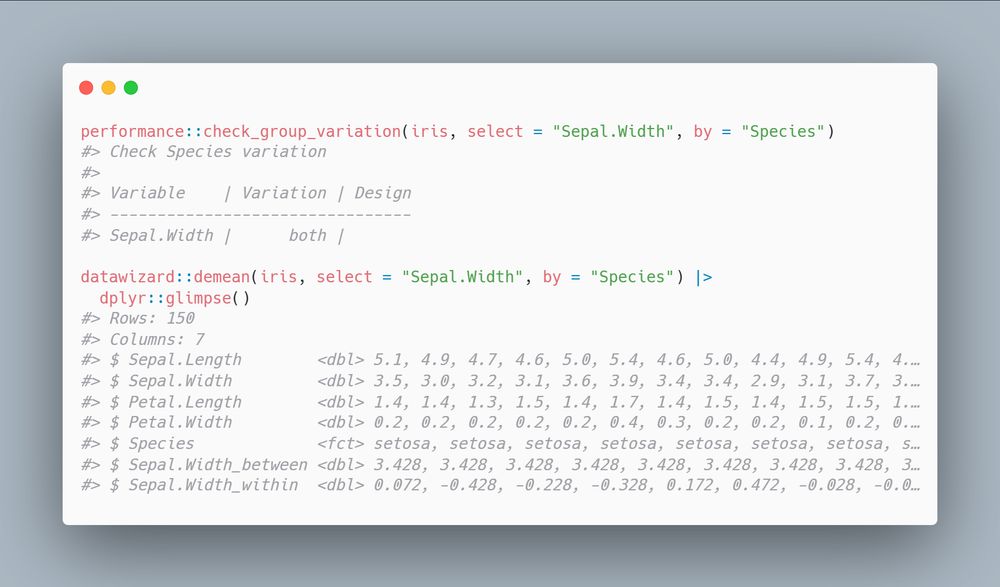
This function can also be used to detect any predictors that might cause heterogeneity bias - variable that vary both within and between groups, that can be treated with datawizard::demean()
easystats.github.io/datawizard/r...
easystats.github.io/datawizard/r...
May 27, 2025 at 6:48 AM
This function can also be used to detect any predictors that might cause heterogeneity bias - variable that vary both within and between groups, that can be treated with datawizard::demean()
easystats.github.io/datawizard/r...
easystats.github.io/datawizard/r...
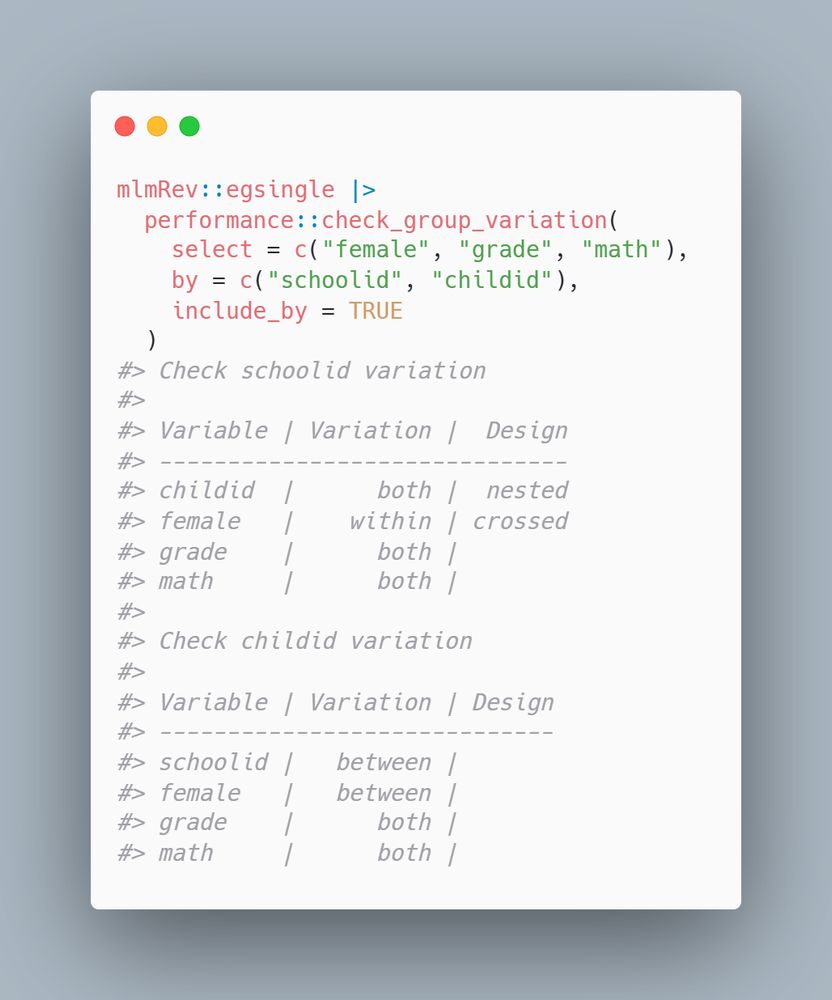
🆕 Introducing check_group_variation() in the {performance} #Rstats package! 🎉
This function makes it easy to checks if variables vary within or between levels of grouping variables.
Perfect for understanding and designing mixed models 🚀
easystats.github.io/performance/...
#stats #easystats
This function makes it easy to checks if variables vary within or between levels of grouping variables.
Perfect for understanding and designing mixed models 🚀
easystats.github.io/performance/...
#stats #easystats
May 27, 2025 at 6:48 AM
🆕 Introducing check_group_variation() in the {performance} #Rstats package! 🎉
This function makes it easy to checks if variables vary within or between levels of grouping variables.
Perfect for understanding and designing mixed models 🚀
easystats.github.io/performance/...
#stats #easystats
This function makes it easy to checks if variables vary within or between levels of grouping variables.
Perfect for understanding and designing mixed models 🚀
easystats.github.io/performance/...
#stats #easystats
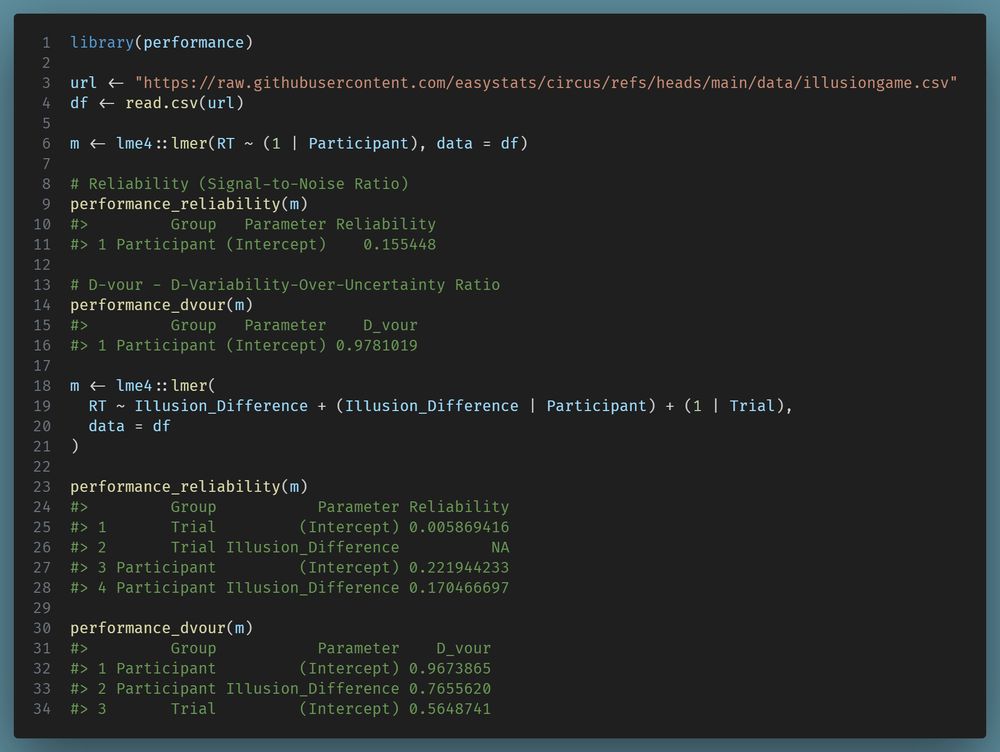
One function per week, this time we look closer at random effects variances in mixed models: `performance_reliability()` & `performance_dvour()`. Is the variability in your data due to noise within groups, or actual differences between groups? #easystats #rstats easystats.github.io/performance/...
May 22, 2025 at 8:50 PM
One function per week, this time we look closer at random effects variances in mixed models: `performance_reliability()` & `performance_dvour()`. Is the variability in your data due to noise within groups, or actual differences between groups? #easystats #rstats easystats.github.io/performance/...
One function per week (maybe we change it to month?), this time showing how to easily create a table of a sample description using the #rstats #easystats {report} package: easystats.github.io/report/refer...
Appropriate summary automatically applied based on variable types, also supports weighting.
Appropriate summary automatically applied based on variable types, also supports weighting.

May 15, 2025 at 6:00 PM
One function per week (maybe we change it to month?), this time showing how to easily create a table of a sample description using the #rstats #easystats {report} package: easystats.github.io/report/refer...
Appropriate summary automatically applied based on variable types, also supports weighting.
Appropriate summary automatically applied based on variable types, also supports weighting.
Centering is not only useful, but sometimes necessary. E.g., to avoid heterogeneity bias, commonly in longitudinal data analysis with variables that vary over time. Special centering is required then. Here's one function per week,
`datawizard::demean()`! #rstats
easystats.github.io/datawizard/r...
`datawizard::demean()`! #rstats
easystats.github.io/datawizard/r...

March 10, 2025 at 10:03 AM
Centering is not only useful, but sometimes necessary. E.g., to avoid heterogeneity bias, commonly in longitudinal data analysis with variables that vary over time. Special centering is required then. Here's one function per week,
`datawizard::demean()`! #rstats
easystats.github.io/datawizard/r...
`datawizard::demean()`! #rstats
easystats.github.io/datawizard/r...
One function per week, this time showing an easy way how to calculate correlations: with `correlation()` from the {correlation} package! Easily apply dozens of different methods, including multilevel and Bayesian correlations! #rstats #easystats
easystats.github.io/correlation/
easystats.github.io/correlation/

March 5, 2025 at 9:42 PM
One function per week, this time showing an easy way how to calculate correlations: with `correlation()` from the {correlation} package! Easily apply dozens of different methods, including multilevel and Bayesian correlations! #rstats #easystats
easystats.github.io/correlation/
easystats.github.io/correlation/
One function per week, this time with `parameters::model_parameters()`. The function returns a comprehensive, consistent ("tidy") output for regression models and many other statistical procedures, including Bayesian and mixed models. #rstats #easystats
easystats.github.io/parameters/r...
easystats.github.io/parameters/r...

February 28, 2025 at 7:02 AM
One function per week, this time with `parameters::model_parameters()`. The function returns a comprehensive, consistent ("tidy") output for regression models and many other statistical procedures, including Bayesian and mixed models. #rstats #easystats
easystats.github.io/parameters/r...
easystats.github.io/parameters/r...
One function per week, this time we show you `check_itemscale()`, which computes various measures of internal consistencies applied to (sub)scales from items that were extracted using `principal_components()`, or supplied as data frame. #easystats #rstats
easystats.github.io/performance/...
easystats.github.io/performance/...

February 16, 2025 at 5:07 PM
One function per week, this time we show you `check_itemscale()`, which computes various measures of internal consistencies applied to (sub)scales from items that were extracted using `principal_components()`, or supplied as data frame. #easystats #rstats
easystats.github.io/performance/...
easystats.github.io/performance/...
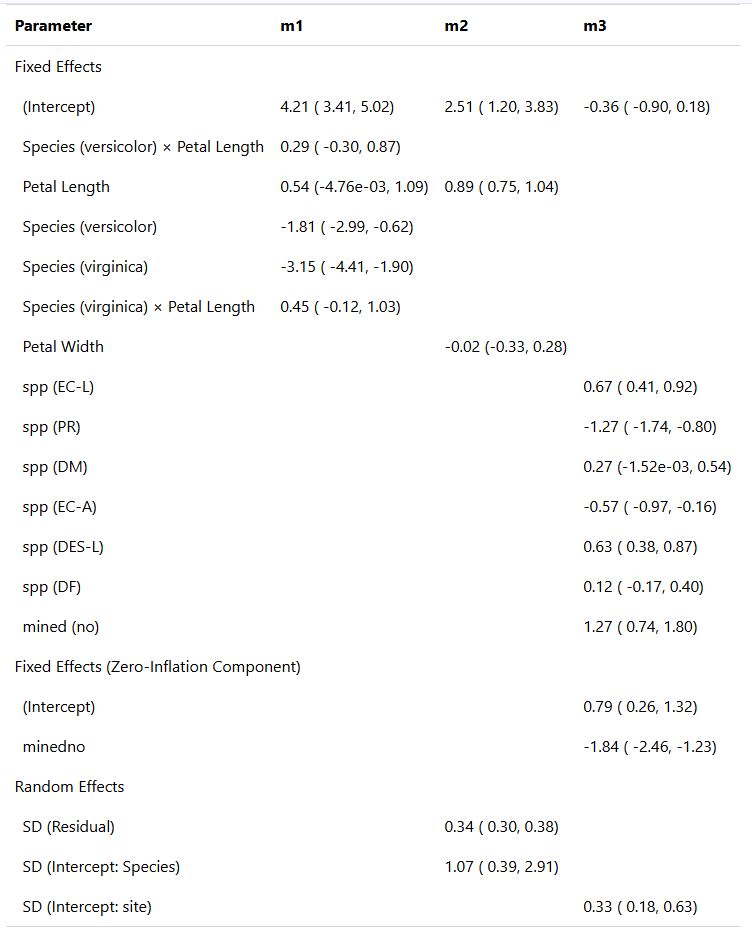
The `model_dashboard()` in action... #easystats #rstats
February 6, 2025 at 4:31 PM
The `model_dashboard()` in action... #easystats #rstats
One function per week, this week we're excited to show you `model_dashboard()`, *the* one-ring-to-rule-them-all to get a quick and comprehensive overview of your regression model:
easystats.github.io/easystats/re...
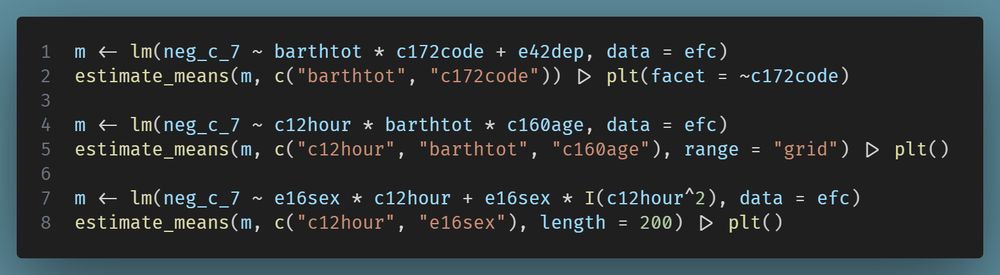
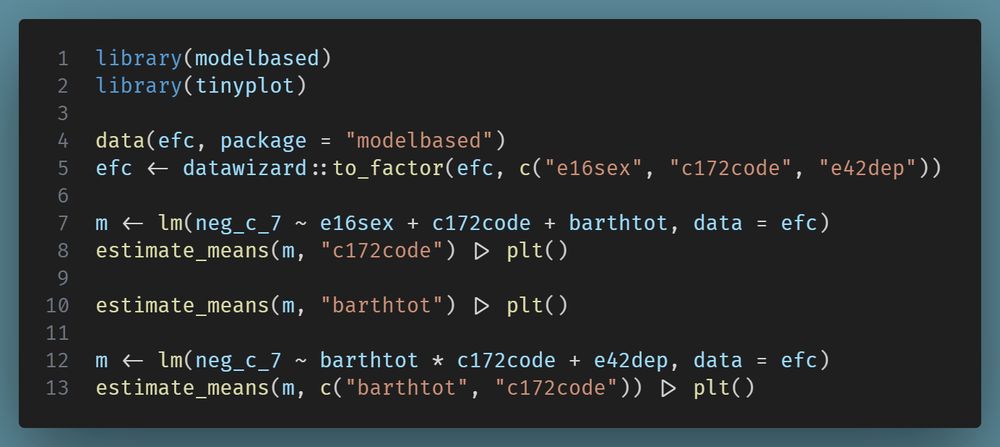
See example code in the screenshot, and video in next post!
#rstats #easystats
easystats.github.io/easystats/re...
See example code in the screenshot, and video in next post!
#rstats #easystats

February 6, 2025 at 4:31 PM
One function per week, this week we're excited to show you `model_dashboard()`, *the* one-ring-to-rule-them-all to get a quick and comprehensive overview of your regression model:
easystats.github.io/easystats/re...
See example code in the screenshot, and video in next post!
#rstats #easystats
easystats.github.io/easystats/re...
See example code in the screenshot, and video in next post!
#rstats #easystats
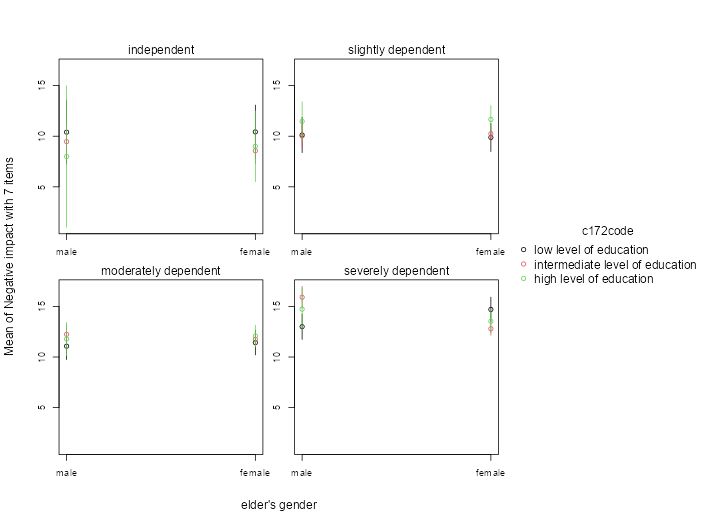
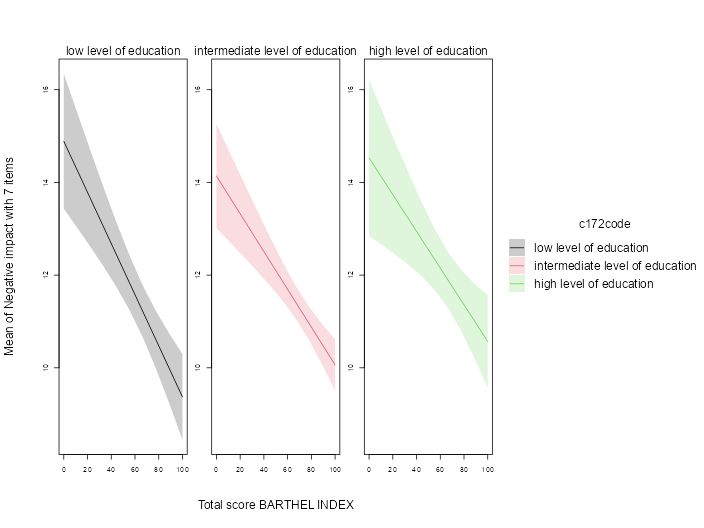
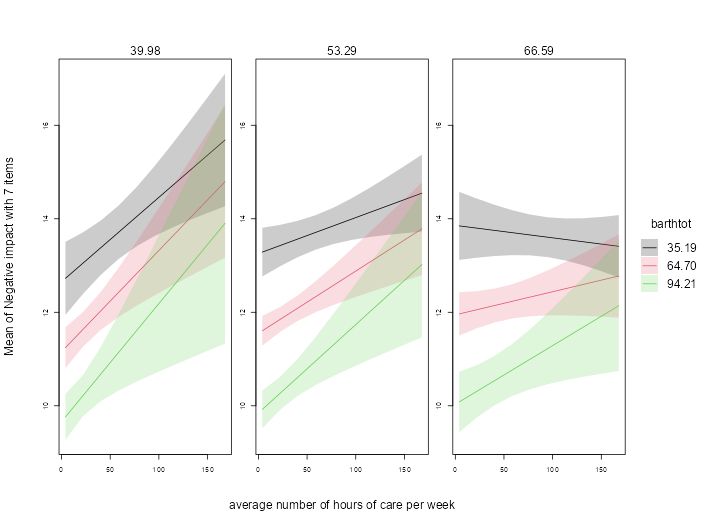
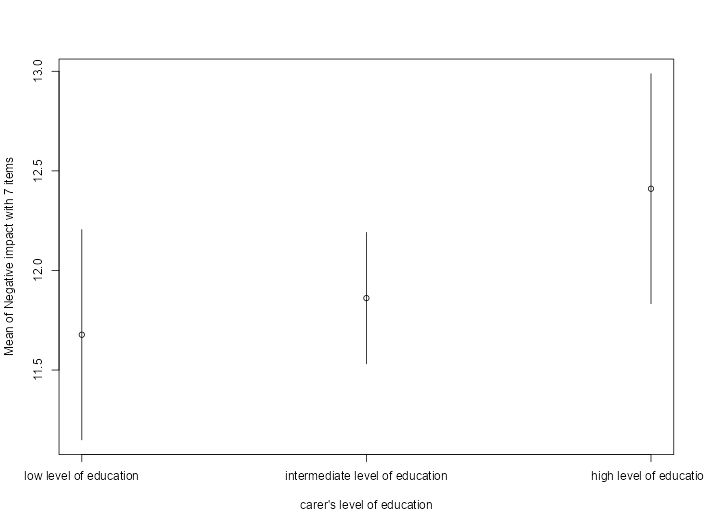
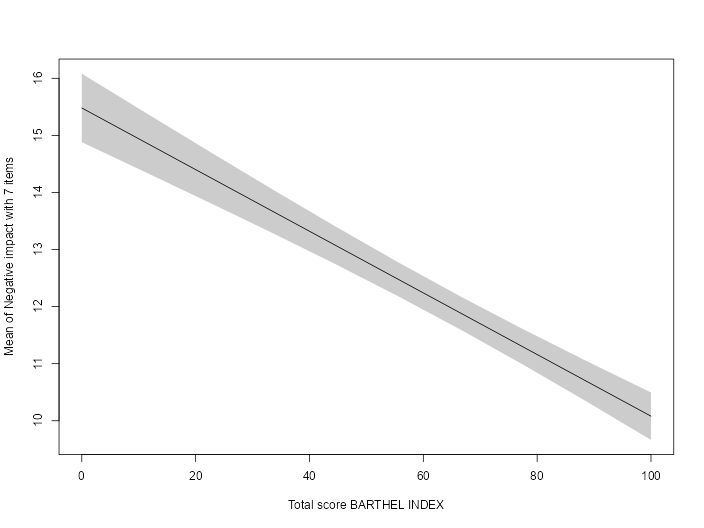
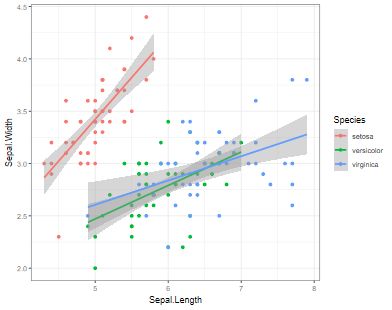
Plotting gives you nice figures out of the box!

February 6, 2025 at 12:01 AM
Plotting gives you nice figures out of the box!
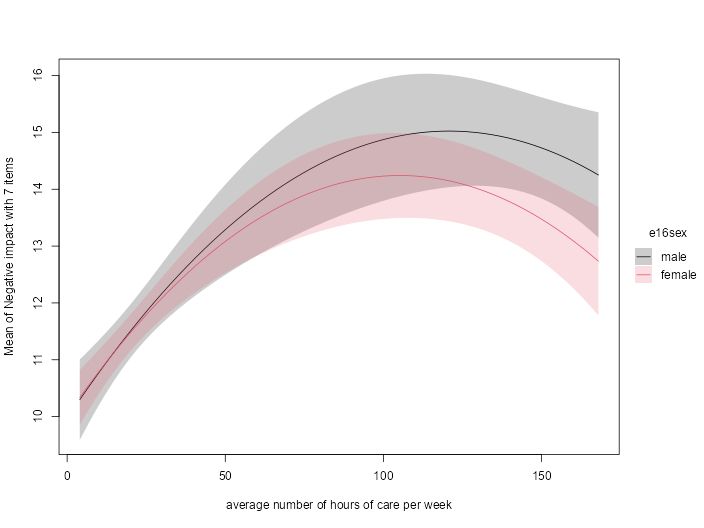
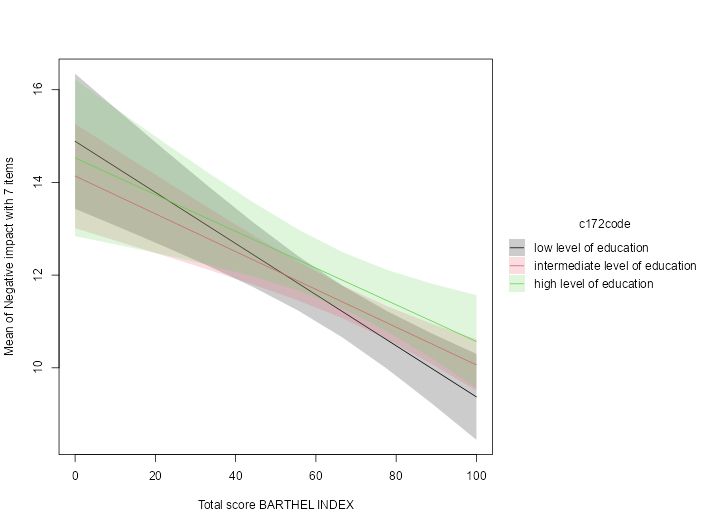
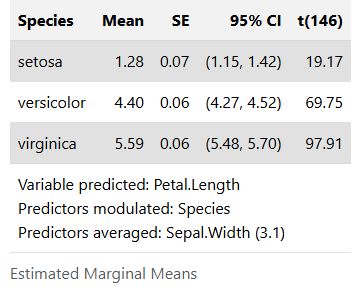
The output is clear and informative, see following examples:


February 6, 2025 at 12:01 AM
The output is clear and informative, see following examples:
One function per week, this week with `data_seek()` from the {datawizard} package. This function helps you finding variables by their names, variable or value labels in data sets Labelled data is also supported. #easystats #rstats easystats.github.io/datawizard/r...

January 27, 2025 at 11:23 PM
One function per week, this week with `data_seek()` from the {datawizard} package. This function helps you finding variables by their names, variable or value labels in data sets Labelled data is also supported. #easystats #rstats easystats.github.io/datawizard/r...