


Sam Sims
@drsamsims.bsky.social
Existing research, using traditional self-report methods, consistently finds that intrinsic/altruistic motives dominate the decision to become a teacher: www.sciencedirect.com/science/arti...
So why do we find such contrasting findings? One possibility:
So why do we find such contrasting findings? One possibility:

November 28, 2025 at 12:05 PM
Existing research, using traditional self-report methods, consistently finds that intrinsic/altruistic motives dominate the decision to become a teacher: www.sciencedirect.com/science/arti...
So why do we find such contrasting findings? One possibility:
So why do we find such contrasting findings? One possibility:
We also find only limited differences in preferences across maths/physics/engineering (MPE) versus other undergrads
The often more severe shortages of teachers in maths and physics is therefore unlikely to be explained by differences in preferences
The often more severe shortages of teachers in maths and physics is therefore unlikely to be explained by differences in preferences

November 28, 2025 at 12:05 PM
We also find only limited differences in preferences across maths/physics/engineering (MPE) versus other undergrads
The often more severe shortages of teachers in maths and physics is therefore unlikely to be explained by differences in preferences
The often more severe shortages of teachers in maths and physics is therefore unlikely to be explained by differences in preferences
Drawing on the literature on ‘public service motivation’ we find some differences in preferences for jobs with social impact
In this graph, points further to right indicate more of a preference
But 1) these are modest 2) high PSM grads place no less weight on extrinsic rewards than low PSM grads
In this graph, points further to right indicate more of a preference
But 1) these are modest 2) high PSM grads place no less weight on extrinsic rewards than low PSM grads

November 28, 2025 at 12:05 PM
Drawing on the literature on ‘public service motivation’ we find some differences in preferences for jobs with social impact
In this graph, points further to right indicate more of a preference
But 1) these are modest 2) high PSM grads place no less weight on extrinsic rewards than low PSM grads
In this graph, points further to right indicate more of a preference
But 1) these are modest 2) high PSM grads place no less weight on extrinsic rewards than low PSM grads
It's plausible that those on the margin of teaching (persuadable) are different to the average undergrad in our sample
But we find limited evidence for this among those who report they are considering/planning teaching:
But we find limited evidence for this among those who report they are considering/planning teaching:

November 28, 2025 at 12:05 PM
It's plausible that those on the margin of teaching (persuadable) are different to the average undergrad in our sample
But we find limited evidence for this among those who report they are considering/planning teaching:
But we find limited evidence for this among those who report they are considering/planning teaching:
Same graph but showing £ equivalent values:
6 weeks paid leave (grads) -> 13 weeks paid leave (teachers) = +£3.7k salary
Typical 40 hour week -> 52 hours per week (term time teaching) = -£3.2k salary
‘small’ social impact -> ‘significant’ (like teaching) = +£1.2k
TL;DR: Extrinsic rewards matter
6 weeks paid leave (grads) -> 13 weeks paid leave (teachers) = +£3.7k salary
Typical 40 hour week -> 52 hours per week (term time teaching) = -£3.2k salary
‘small’ social impact -> ‘significant’ (like teaching) = +£1.2k
TL;DR: Extrinsic rewards matter

November 28, 2025 at 12:05 PM
Same graph but showing £ equivalent values:
6 weeks paid leave (grads) -> 13 weeks paid leave (teachers) = +£3.7k salary
Typical 40 hour week -> 52 hours per week (term time teaching) = -£3.2k salary
‘small’ social impact -> ‘significant’ (like teaching) = +£1.2k
TL;DR: Extrinsic rewards matter
6 weeks paid leave (grads) -> 13 weeks paid leave (teachers) = +£3.7k salary
Typical 40 hour week -> 52 hours per week (term time teaching) = -£3.2k salary
‘small’ social impact -> ‘significant’ (like teaching) = +£1.2k
TL;DR: Extrinsic rewards matter
Main results in image below
Horizontal axis: change in probability of choosing a job
Eg: Increasing starting salary from £28.5k (grad average UK) to £31.5k (teachers UK) increases probability of choosing a job by 0.08 (8 percentage points)
TL;DR: Pay and hours really matter to undergrads.
Horizontal axis: change in probability of choosing a job
Eg: Increasing starting salary from £28.5k (grad average UK) to £31.5k (teachers UK) increases probability of choosing a job by 0.08 (8 percentage points)
TL;DR: Pay and hours really matter to undergrads.

November 28, 2025 at 12:05 PM
Main results in image below
Horizontal axis: change in probability of choosing a job
Eg: Increasing starting salary from £28.5k (grad average UK) to £31.5k (teachers UK) increases probability of choosing a job by 0.08 (8 percentage points)
TL;DR: Pay and hours really matter to undergrads.
Horizontal axis: change in probability of choosing a job
Eg: Increasing starting salary from £28.5k (grad average UK) to £31.5k (teachers UK) increases probability of choosing a job by 0.08 (8 percentage points)
TL;DR: Pay and hours really matter to undergrads.
We used an online survey experiment with photo-ID-verified respondents
Our sample completed ~20,000 randomised job choice tasks, with values carefully chosen to reflect teaching and non-teaching jobs
Which would you pick?
Our sample completed ~20,000 randomised job choice tasks, with values carefully chosen to reflect teaching and non-teaching jobs
Which would you pick?

November 28, 2025 at 12:05 PM
We used an online survey experiment with photo-ID-verified respondents
Our sample completed ~20,000 randomised job choice tasks, with values carefully chosen to reflect teaching and non-teaching jobs
Which would you pick?
Our sample completed ~20,000 randomised job choice tasks, with values carefully chosen to reflect teaching and non-teaching jobs
Which would you pick?
New research with @clareroutledge.bsky.social
Funded by the Gatsby Foundation
We asked 2000 UK/US undergrads to choose between pairs of hypothetical jobs to understand how more of them could be tempted into teaching
Funded by the Gatsby Foundation
We asked 2000 UK/US undergrads to choose between pairs of hypothetical jobs to understand how more of them could be tempted into teaching

November 28, 2025 at 12:05 PM
New research with @clareroutledge.bsky.social
Funded by the Gatsby Foundation
We asked 2000 UK/US undergrads to choose between pairs of hypothetical jobs to understand how more of them could be tempted into teaching
Funded by the Gatsby Foundation
We asked 2000 UK/US undergrads to choose between pairs of hypothetical jobs to understand how more of them could be tempted into teaching

November 25, 2025 at 6:24 PM
Reminds me of this UKIP add from 2010. Farage has always known that he functions as the F U button.

October 22, 2025 at 7:27 AM
Reminds me of this UKIP add from 2010. Farage has always known that he functions as the F U button.
Are you interested in teacher coaching, simulation, transfer of training?
Join us at 11am (online) for this talk on Thursday. Sign up using the link below:
ucl.zoom.us/webinar/regi...
Join us at 11am (online) for this talk on Thursday. Sign up using the link below:
ucl.zoom.us/webinar/regi...

September 1, 2025 at 10:06 AM
Are you interested in teacher coaching, simulation, transfer of training?
Join us at 11am (online) for this talk on Thursday. Sign up using the link below:
ucl.zoom.us/webinar/regi...
Join us at 11am (online) for this talk on Thursday. Sign up using the link below:
ucl.zoom.us/webinar/regi...
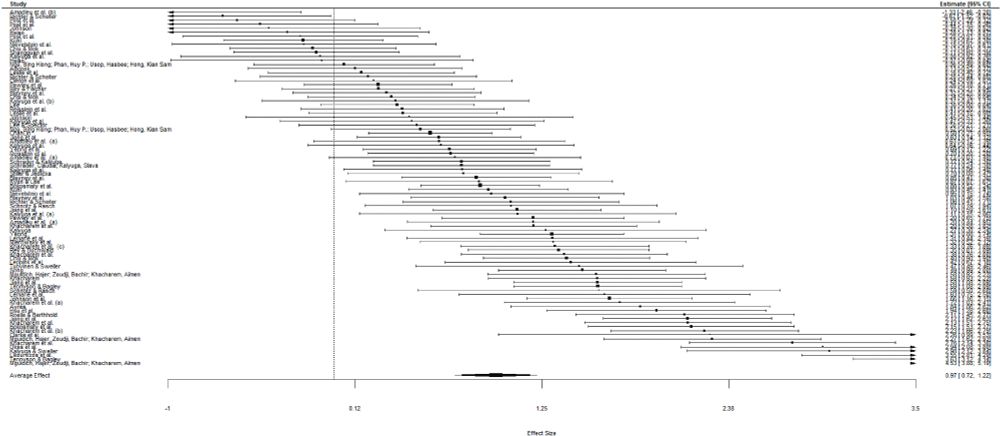
New meta-analysis of expertise reversal effect: lower prior knowledge learn more from higher instructional guidance; higher prior knowledge learn less
Differences in effects of guidance for low-high knowledge groups (60 studies) supports theory:
Tetzlaff et al www.sciencedirect.com/science/arti...
Differences in effects of guidance for low-high knowledge groups (60 studies) supports theory:
Tetzlaff et al www.sciencedirect.com/science/arti...
August 12, 2025 at 9:16 AM
New meta-analysis of expertise reversal effect: lower prior knowledge learn more from higher instructional guidance; higher prior knowledge learn less
Differences in effects of guidance for low-high knowledge groups (60 studies) supports theory:
Tetzlaff et al www.sciencedirect.com/science/arti...
Differences in effects of guidance for low-high knowledge groups (60 studies) supports theory:
Tetzlaff et al www.sciencedirect.com/science/arti...

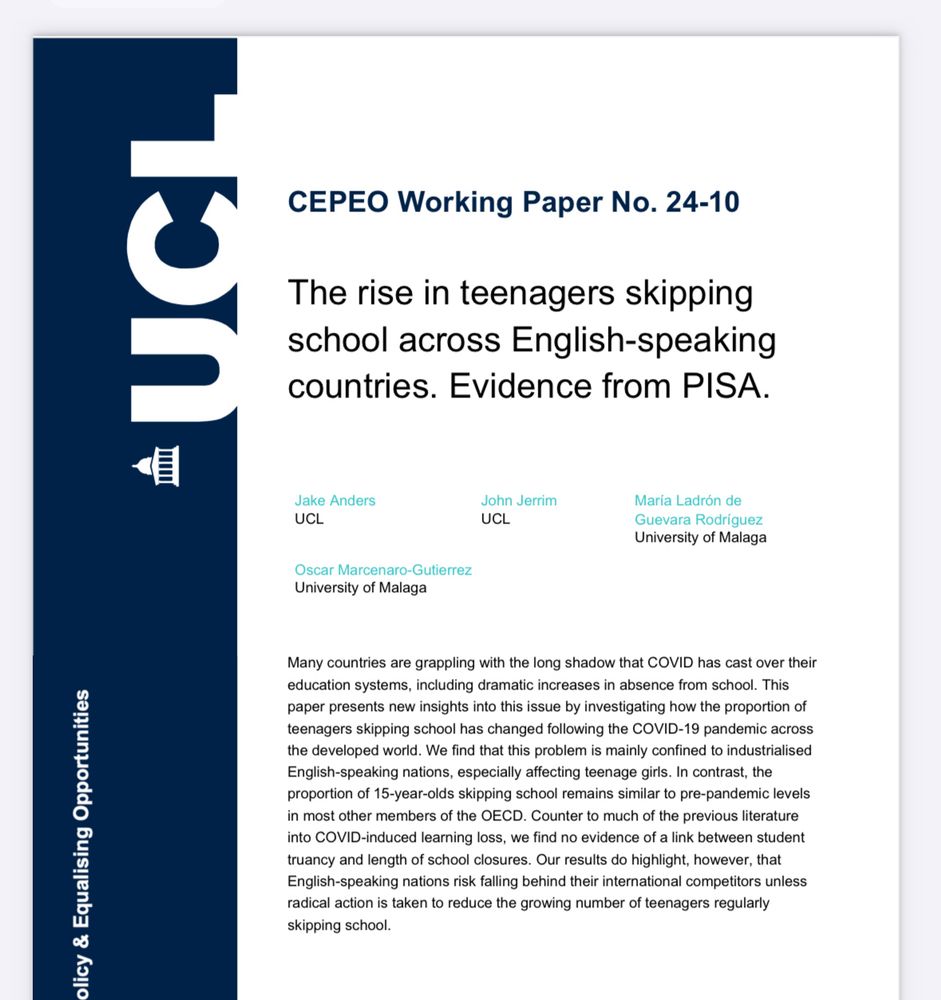
I had fun working on this paper in 2024.
We use a quirk of the TIMMS data (students answer questions on content they haven’t been taught) to study near transfer.
Summary (and co-authors) in screenshot below…
www.sciencedirect.com/science/arti...
We use a quirk of the TIMMS data (students answer questions on content they haven’t been taught) to study near transfer.
Summary (and co-authors) in screenshot below…
www.sciencedirect.com/science/arti...

December 19, 2024 at 6:58 PM
I had fun working on this paper in 2024.
We use a quirk of the TIMMS data (students answer questions on content they haven’t been taught) to study near transfer.
Summary (and co-authors) in screenshot below…
www.sciencedirect.com/science/arti...
We use a quirk of the TIMMS data (students answer questions on content they haven’t been taught) to study near transfer.
Summary (and co-authors) in screenshot below…
www.sciencedirect.com/science/arti...
November 22, 2024 at 6:21 PM

Such a pleasure to contribute to the secondary PGCE ‘professional studies’ day at @ioe.bsky.social this morning. 600 in the cohort. You are all doing something remarkable!

September 16, 2024 at 12:00 PM
Such a pleasure to contribute to the secondary PGCE ‘professional studies’ day at @ioe.bsky.social this morning. 600 in the cohort. You are all doing something remarkable!
