


David Kroodsma
@davidkroodsma.bsky.social
Chief Scientist, Global Fishing Watch. I lead a team that uses satellites and AI to reveal all major human activity at sea. globalfishingwatch.org
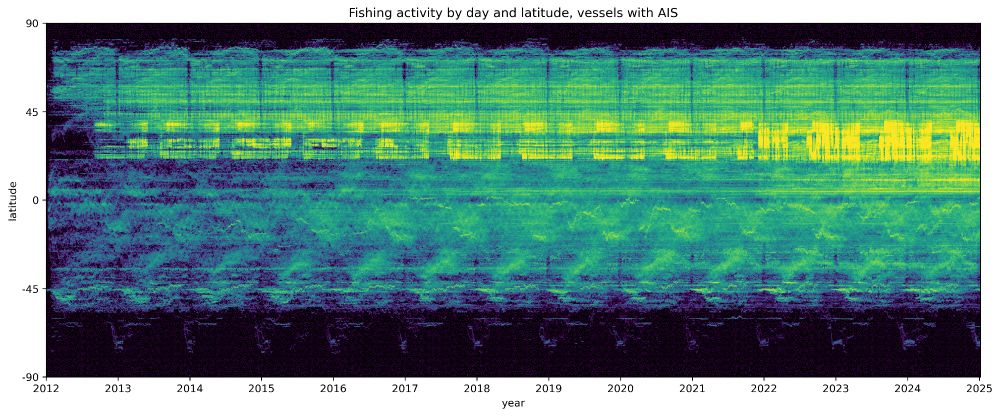
We have just updated our public fishing activity data. You can now download data for 2012-2024! Learn more: globalfishingwatch.org/insights/ask...
Here is fishing effort by latitude and day, across 12 years.
Here is fishing effort by latitude and day, across 12 years.
March 13, 2025 at 4:41 PM
We have just updated our public fishing activity data. You can now download data for 2012-2024! Learn more: globalfishingwatch.org/insights/ask...
Here is fishing effort by latitude and day, across 12 years.
Here is fishing effort by latitude and day, across 12 years.
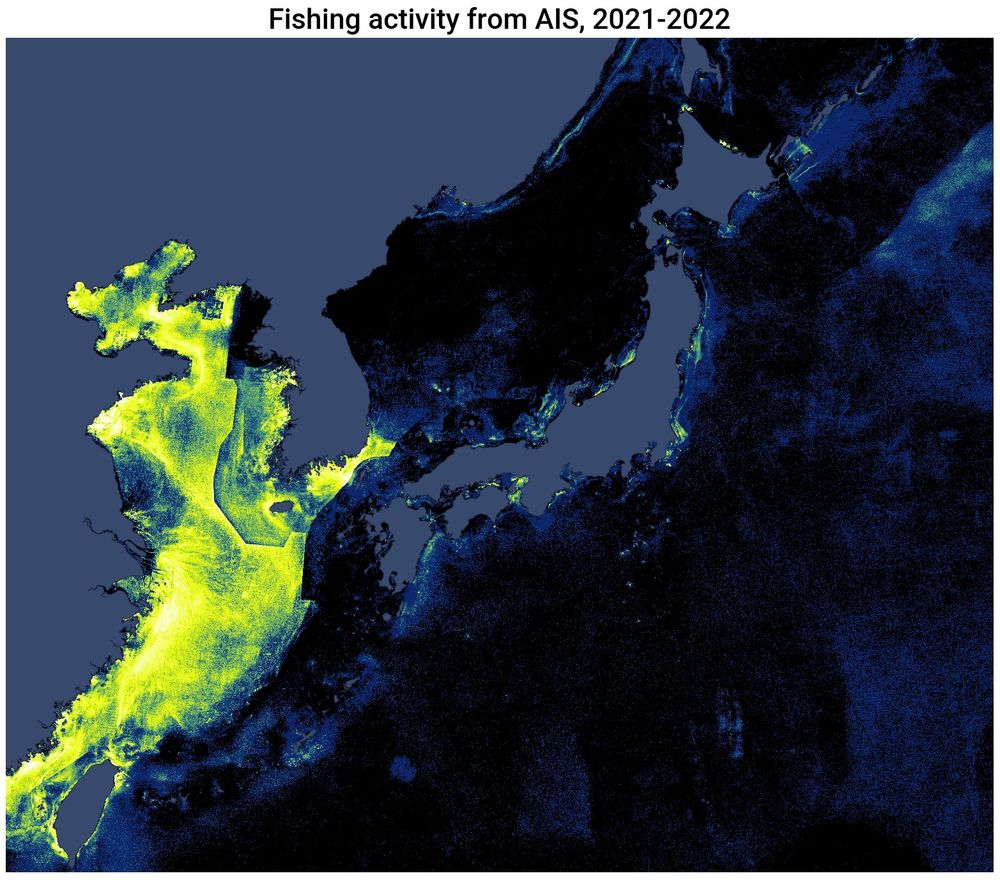
Currently on a flight to Tokyo -- amazed to have wifi over the middle of the Pacific (even if it is slow).
Looking forward to meetings in Tokyo, then Taiwan, then Korea, over the next eight days.
Here's an image of fishing from AIS data in the region.
Looking forward to meetings in Tokyo, then Taiwan, then Korea, over the next eight days.
Here's an image of fishing from AIS data in the region.
February 19, 2025 at 1:40 AM
Currently on a flight to Tokyo -- amazed to have wifi over the middle of the Pacific (even if it is slow).
Looking forward to meetings in Tokyo, then Taiwan, then Korea, over the next eight days.
Here's an image of fishing from AIS data in the region.
Looking forward to meetings in Tokyo, then Taiwan, then Korea, over the next eight days.
Here's an image of fishing from AIS data in the region.
That said, equal earth preserves area much better. But I really like the focus on the global coastline and ocean provided by elastic-2.
Also, when I say "we made the maps," I mean that @tim.hochberg.io made/found the maps and we commented on them.
Also, when I say "we made the maps," I mean that @tim.hochberg.io made/found the maps and we commented on them.
January 3, 2025 at 7:35 PM
That said, equal earth preserves area much better. But I really like the focus on the global coastline and ocean provided by elastic-2.
Also, when I say "we made the maps," I mean that @tim.hochberg.io made/found the maps and we commented on them.
Also, when I say "we made the maps," I mean that @tim.hochberg.io made/found the maps and we commented on them.
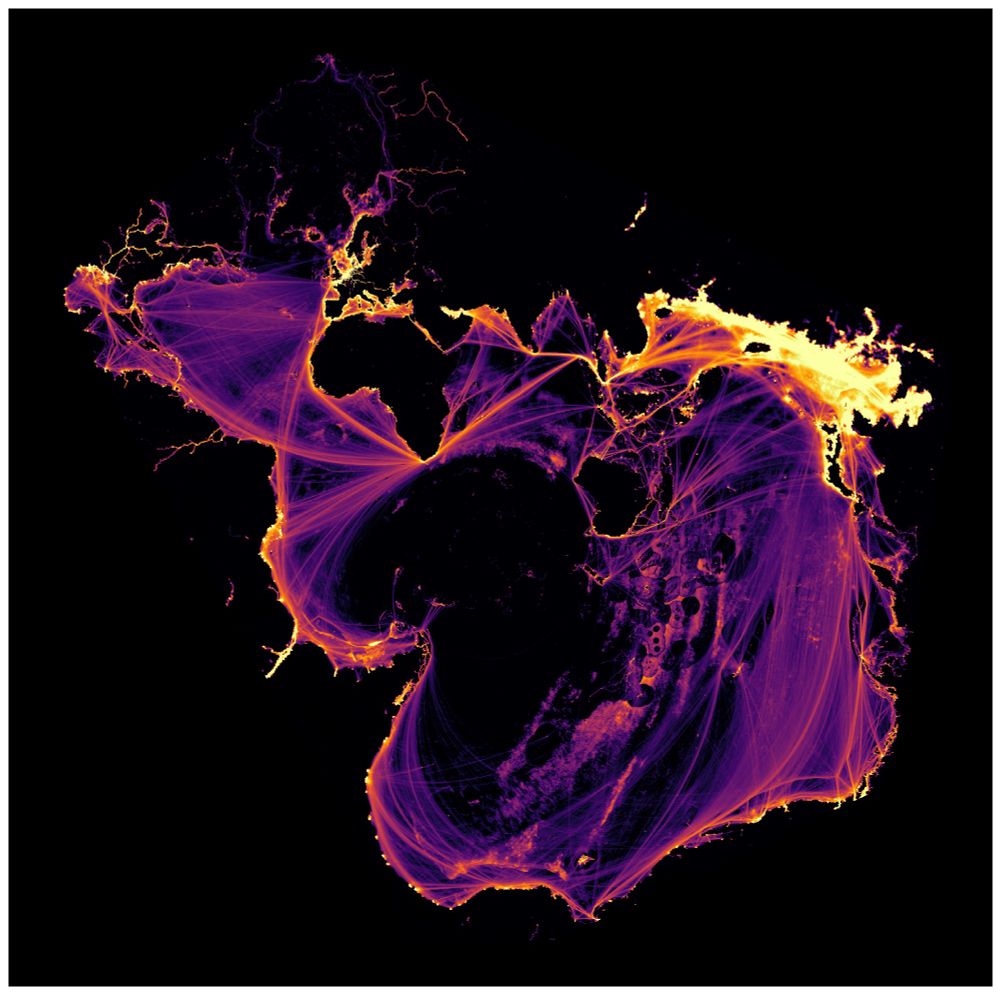
Previous map is all vessel activity from AIS-the map is most distorted in the area with the most traffic!
We looked around, and found the elastic-2 projection github.com/jkunimune/el..., which can give a similar view as Spilhaus, but doesn't distort the coastlines quite as much (except Australia).
We looked around, and found the elastic-2 projection github.com/jkunimune/el..., which can give a similar view as Spilhaus, but doesn't distort the coastlines quite as much (except Australia).

January 3, 2025 at 7:35 PM
Previous map is all vessel activity from AIS-the map is most distorted in the area with the most traffic!
We looked around, and found the elastic-2 projection github.com/jkunimune/el..., which can give a similar view as Spilhaus, but doesn't distort the coastlines quite as much (except Australia).
We looked around, and found the elastic-2 projection github.com/jkunimune/el..., which can give a similar view as Spilhaus, but doesn't distort the coastlines quite as much (except Australia).
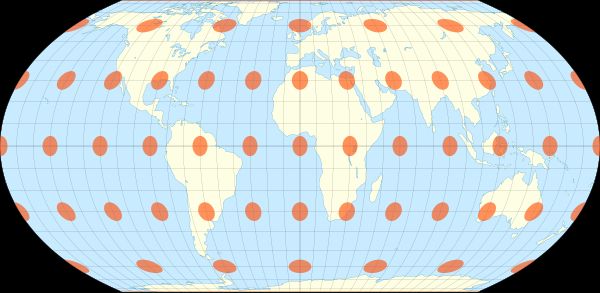
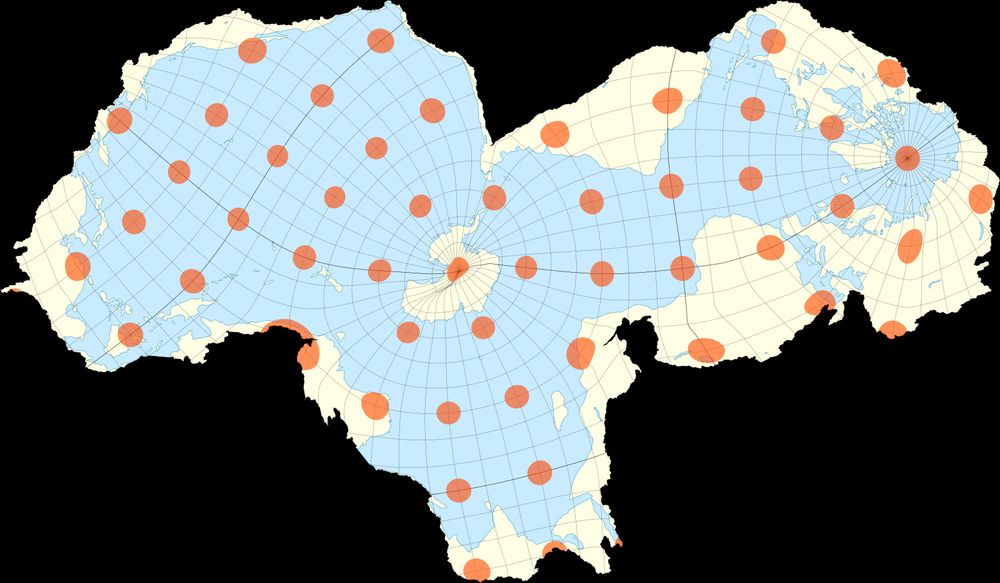
I like this projection not because of how it shows the ocean, but rather because it shows the global coastline as if it were a mostly-continuous line. Coastal waters are where the vast majority of human activity in the ocean is. However Spilhaus distorts the coastline a lot in some regions.
January 3, 2025 at 7:35 PM
I like this projection not because of how it shows the ocean, but rather because it shows the global coastline as if it were a mostly-continuous line. Coastal waters are where the vast majority of human activity in the ocean is. However Spilhaus distorts the coastline a lot in some regions.
Today at Global Fishing Watch, on Slack, we are discussing the best map projections for showing off the ocean (this is partially us procrastinating). Our default is an equal earth projection. But some argue we should use the Spilhaus projection instead, which is how "fish see the world."

January 3, 2025 at 7:35 PM
Today at Global Fishing Watch, on Slack, we are discussing the best map projections for showing off the ocean (this is partially us procrastinating). Our default is an equal earth projection. But some argue we should use the Spilhaus projection instead, which is how "fish see the world."
That's a good idea -- unfortunately not straightforward using cartopy and Global Fishing Watch's pyseas library. However, I can give you Stereographic:

December 20, 2024 at 9:15 PM
That's a good idea -- unfortunately not straightforward using cartopy and Global Fishing Watch's pyseas library. However, I can give you Stereographic:
One of my resolutions for 2025 will be to share more of the maps we make at Global Fishing Watch. Here is all vessel traffic from AIS across five years. And if you want a 50 megabyte file of this image where you can zoom in to really high resolution, go here: drive.google.com/file/d/1RgBQ...

December 20, 2024 at 3:58 PM
One of my resolutions for 2025 will be to share more of the maps we make at Global Fishing Watch. Here is all vessel traffic from AIS across five years. And if you want a 50 megabyte file of this image where you can zoom in to really high resolution, go here: drive.google.com/file/d/1RgBQ...
10 years ago (!) I self-published a book about my climate-change-awareness-raising bicycle adventure across North and South America. Reflections on the adventure and the self-publishing journey: rideforclimate.com/blog/?p=1490

December 13, 2024 at 6:22 PM
10 years ago (!) I self-published a book about my climate-change-awareness-raising bicycle adventure across North and South America. Reflections on the adventure and the self-publishing journey: rideforclimate.com/blog/?p=1490
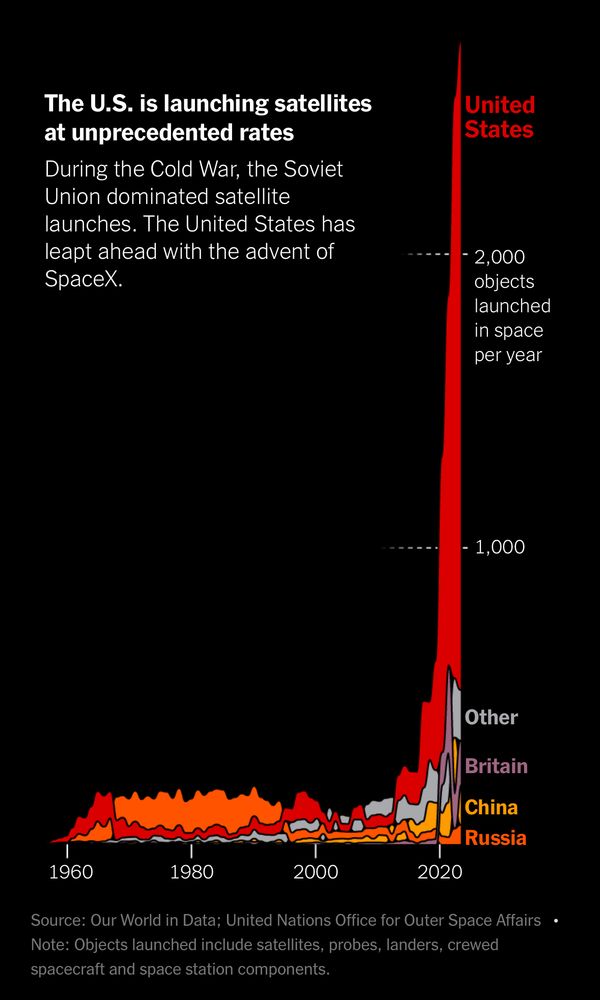
Also, this graph from the article is incredibly impressive. We live in the era of the satellite.
December 8, 2024 at 10:58 PM
Also, this graph from the article is incredibly impressive. We live in the era of the satellite.
What happens on this side of the world? It turns, a lot of fishing and shipping! Here's one year of fishing activity (yellow) and shipping (green) in the Pacific. This is Global Fishing Watch's data.
bsky.app/profile/hank...
bsky.app/profile/hank...


December 7, 2024 at 5:17 PM
What happens on this side of the world? It turns, a lot of fishing and shipping! Here's one year of fishing activity (yellow) and shipping (green) in the Pacific. This is Global Fishing Watch's data.
bsky.app/profile/hank...
bsky.app/profile/hank...
Box 1 from the paper shows the PAA (pink) and industrial fishing effort (red) from Global Fishing Watch "fishing the line" of the PAA -- that is, fishing just outside it because the larger vessels are not allowed inside.

December 6, 2024 at 6:05 AM
Box 1 from the paper shows the PAA (pink) and industrial fishing effort (red) from Global Fishing Watch "fishing the line" of the PAA -- that is, fishing just outside it because the larger vessels are not allowed inside.
I find this plot fascinating. Most of the world's topography is either between 4-5k meters underwater or close to sea level.

December 5, 2024 at 5:22 PM
I find this plot fascinating. Most of the world's topography is either between 4-5k meters underwater or close to sea level.
I was updating our bathymetry data with the latest global dataset (ETOPO 2022), and I couldn't help but make a few pretty maps. This was made using our Python library, github.com/GlobalFishin...

December 5, 2024 at 5:03 PM
I was updating our bathymetry data with the latest global dataset (ETOPO 2022), and I couldn't help but make a few pretty maps. This was made using our Python library, github.com/GlobalFishin...
Happy Thanksgiving! I’m enjoying sitting on the beach and reading The High Seas by @oliveheffernan.bsky.social — chapter 3 features Global Fishing Watch’s / @skytruth.bsky.social ‘s Bjorn Bergman!

November 28, 2024 at 4:57 PM
Happy Thanksgiving! I’m enjoying sitting on the beach and reading The High Seas by @oliveheffernan.bsky.social — chapter 3 features Global Fishing Watch’s / @skytruth.bsky.social ‘s Bjorn Bergman!
How much more activity will @planetlabs.bsky.social let us see? Here's an example of Long Island. The first image is the vessels with AIS at the time of Planet Images. The second shows all the vessels that we can detect with Planet. Now we can truly map human activity in the ocean.


November 20, 2024 at 4:15 PM
How much more activity will @planetlabs.bsky.social let us see? Here's an example of Long Island. The first image is the vessels with AIS at the time of Planet Images. The second shows all the vessels that we can detect with Planet. Now we can truly map human activity in the ocean.