


Michael Friendly
@datavisfriendly.bsky.social
ASA Fellow; #rstats developer of graphical methods for categorical and multivariate data; #datavis history of data visualization; #historicaldatavis; Milestones project
Web: www.datavis.ca
GitHub: github.com/friendly
Web: www.datavis.ca
GitHub: github.com/friendly
#TodayinHistory #dataviz #OTD 📊
🎂Nov 13, 1911 Heinz Von Foerster born in Vienna, Italy 🇮🇹
1930: Timeline of historical events drawn on a logarithmic scale, allowing enormous range & changing the default linear view of history for visibility of more recent events
🎂Nov 13, 1911 Heinz Von Foerster born in Vienna, Italy 🇮🇹
1930: Timeline of historical events drawn on a logarithmic scale, allowing enormous range & changing the default linear view of history for visibility of more recent events


November 14, 2025 at 2:33 AM
#TodayinHistory #dataviz #OTD 📊
🎂Nov 13, 1911 Heinz Von Foerster born in Vienna, Italy 🇮🇹
1930: Timeline of historical events drawn on a logarithmic scale, allowing enormous range & changing the default linear view of history for visibility of more recent events
🎂Nov 13, 1911 Heinz Von Foerster born in Vienna, Italy 🇮🇹
1930: Timeline of historical events drawn on a logarithmic scale, allowing enormous range & changing the default linear view of history for visibility of more recent events
#TodayinHistory #dataviz #OTD 📊
📅Nov 12, 1733 Abraham De Moivre published his limit theorem to the binomial distribution
'Approximatio ad Summam Terminorum Binomii in Seriem expansi'
📅Nov 12, 1733 Abraham De Moivre published his limit theorem to the binomial distribution
'Approximatio ad Summam Terminorum Binomii in Seriem expansi'
November 13, 2025 at 1:22 AM
#TodayinHistory #dataviz #OTD 📊
📅Nov 12, 1733 Abraham De Moivre published his limit theorem to the binomial distribution
'Approximatio ad Summam Terminorum Binomii in Seriem expansi'
📅Nov 12, 1733 Abraham De Moivre published his limit theorem to the binomial distribution
'Approximatio ad Summam Terminorum Binomii in Seriem expansi'

#rstats #dataviz
🚀📈 Plotting methods for linear/quadratic discriminant analysis now developing nicely in the dev 1.0.1 version of {candisc} 📦
Now, nice ggplot plots of decision regions in data space for MASS::lda() & MASS::qda
🔗 friendly.r-universe.dev/candisc
🚀📈 Plotting methods for linear/quadratic discriminant analysis now developing nicely in the dev 1.0.1 version of {candisc} 📦
Now, nice ggplot plots of decision regions in data space for MASS::lda() & MASS::qda
🔗 friendly.r-universe.dev/candisc

November 12, 2025 at 2:03 AM
#rstats #dataviz
🚀📈 Plotting methods for linear/quadratic discriminant analysis now developing nicely in the dev 1.0.1 version of {candisc} 📦
Now, nice ggplot plots of decision regions in data space for MASS::lda() & MASS::qda
🔗 friendly.r-universe.dev/candisc
🚀📈 Plotting methods for linear/quadratic discriminant analysis now developing nicely in the dev 1.0.1 version of {candisc} 📦
Now, nice ggplot plots of decision regions in data space for MASS::lda() & MASS::qda
🔗 friendly.r-universe.dev/candisc
#TodayinHistory #dataviz #OTD 📊
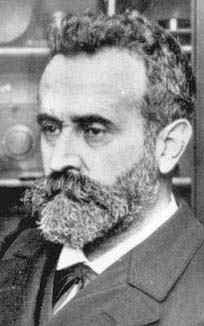
Bertillon introduced the first standardized system of causes of death, and made many statistical charts and maps.
This lovely one shows movement of travelers through Paris in 1889, using flow lines overlaid on the city map, bar charts and a pie chart legend.
Bertillon introduced the first standardized system of causes of death, and made many statistical charts and maps.
This lovely one shows movement of travelers through Paris in 1889, using flow lines overlaid on the city map, bar charts and a pie chart legend.

November 12, 2025 at 1:09 AM
#TodayinHistory #dataviz #OTD 📊
Bertillon introduced the first standardized system of causes of death, and made many statistical charts and maps.
This lovely one shows movement of travelers through Paris in 1889, using flow lines overlaid on the city map, bar charts and a pie chart legend.
Bertillon introduced the first standardized system of causes of death, and made many statistical charts and maps.
This lovely one shows movement of travelers through Paris in 1889, using flow lines overlaid on the city map, bar charts and a pie chart legend.
#TodayinHistory #dataviz #OTD 📊
🎂Nov 11, 1851 Jacques Bertillon born in Paris, France 🇫🇷
1896: Use of area rectangles on a #map to display two variables and their product (population of arrondisements in Paris, percent foreigners; area = absolute number of foreigners)
🎂Nov 11, 1851 Jacques Bertillon born in Paris, France 🇫🇷
1896: Use of area rectangles on a #map to display two variables and their product (population of arrondisements in Paris, percent foreigners; area = absolute number of foreigners)

November 12, 2025 at 1:05 AM
#TodayinHistory #dataviz #OTD 📊
🎂Nov 11, 1851 Jacques Bertillon born in Paris, France 🇫🇷
1896: Use of area rectangles on a #map to display two variables and their product (population of arrondisements in Paris, percent foreigners; area = absolute number of foreigners)
🎂Nov 11, 1851 Jacques Bertillon born in Paris, France 🇫🇷
1896: Use of area rectangles on a #map to display two variables and their product (population of arrondisements in Paris, percent foreigners; area = absolute number of foreigners)
#TodayinHistory #dataviz #OTD 📊
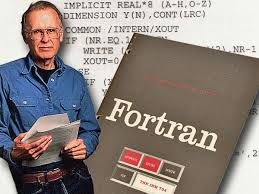
📅Nov 10, 1954 John Backus published the formal proposal for FORTRAN, the first high level language for computing
🔗 bit.ly/3DQnswH
It was proprietary to IBM. The 1st FORTRAN compiler was completed 1955-56.
Who remembers the shift from that to FORTRAN IV?
📅Nov 10, 1954 John Backus published the formal proposal for FORTRAN, the first high level language for computing
🔗 bit.ly/3DQnswH
It was proprietary to IBM. The 1st FORTRAN compiler was completed 1955-56.
Who remembers the shift from that to FORTRAN IV?
November 11, 2025 at 1:34 AM
#TodayinHistory #dataviz #OTD 📊
📅Nov 10, 1954 John Backus published the formal proposal for FORTRAN, the first high level language for computing
🔗 bit.ly/3DQnswH
It was proprietary to IBM. The 1st FORTRAN compiler was completed 1955-56.
Who remembers the shift from that to FORTRAN IV?
📅Nov 10, 1954 John Backus published the formal proposal for FORTRAN, the first high level language for computing
🔗 bit.ly/3DQnswH
It was proprietary to IBM. The 1st FORTRAN compiler was completed 1955-56.
Who remembers the shift from that to FORTRAN IV?
#TodayinHistory #dataviz #OTD 📊
🎂Nov 9, 1854 Matthew Henry Phineas Riall Sankey born in Nenagh, County Tipperary, Ireland
1898: introduced the first energy flow diagram to show the energy efficiency of a steam engine, dubbed the "Sankey diagram"
👀 bit.ly/497fk8l
🎂Nov 9, 1854 Matthew Henry Phineas Riall Sankey born in Nenagh, County Tipperary, Ireland
1898: introduced the first energy flow diagram to show the energy efficiency of a steam engine, dubbed the "Sankey diagram"
👀 bit.ly/497fk8l


November 10, 2025 at 2:25 AM
#TodayinHistory #dataviz #OTD 📊
🎂Nov 9, 1854 Matthew Henry Phineas Riall Sankey born in Nenagh, County Tipperary, Ireland
1898: introduced the first energy flow diagram to show the energy efficiency of a steam engine, dubbed the "Sankey diagram"
👀 bit.ly/497fk8l
🎂Nov 9, 1854 Matthew Henry Phineas Riall Sankey born in Nenagh, County Tipperary, Ireland
1898: introduced the first energy flow diagram to show the energy efficiency of a steam engine, dubbed the "Sankey diagram"
👀 bit.ly/497fk8l
#TodayinHistory #dataviz #OTD 📊
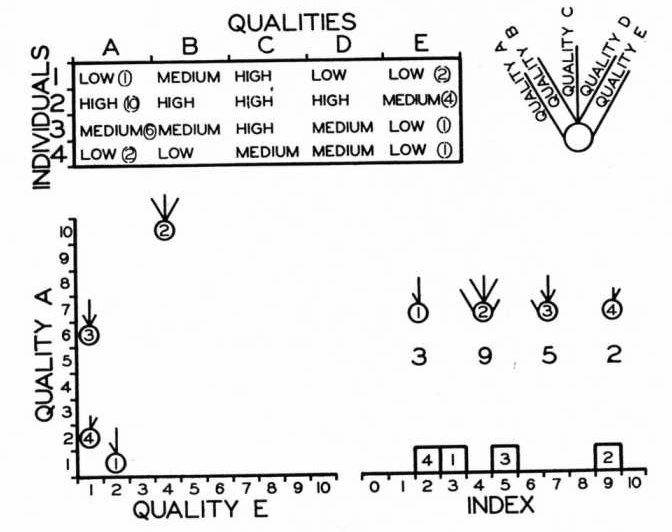
🎂Nov 9, 1897 Edgar Anderson born in Forestville, NY, USA 🇺🇸
1928: Multivariate glyphs, invented to display four variables and their relations (length and width of petals and sepals in iris flowers)
And, of course gave us the famed (or infamous) iris dataset
🎂Nov 9, 1897 Edgar Anderson born in Forestville, NY, USA 🇺🇸
1928: Multivariate glyphs, invented to display four variables and their relations (length and width of petals and sepals in iris flowers)
And, of course gave us the famed (or infamous) iris dataset


November 10, 2025 at 2:07 AM
#TodayinHistory #dataviz #OTD 📊
🎂Nov 9, 1897 Edgar Anderson born in Forestville, NY, USA 🇺🇸
1928: Multivariate glyphs, invented to display four variables and their relations (length and width of petals and sepals in iris flowers)
And, of course gave us the famed (or infamous) iris dataset
🎂Nov 9, 1897 Edgar Anderson born in Forestville, NY, USA 🇺🇸
1928: Multivariate glyphs, invented to display four variables and their relations (length and width of petals and sepals in iris flowers)
And, of course gave us the famed (or infamous) iris dataset
#TodayinHistory #dataviz #OTD 📊
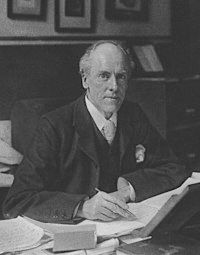
🎂Nov 6, 1869 Arthur L. Bowley born in Bristol, UK. 🇬🇧
1901: Smoothing of time series in one of the 1st text books on data graphics
He used 3-, 5-, 10- year running averages, discussed the merits of smoothing
#rstats: data(Bowley, package="HistData"); example(Bowley)
🎂Nov 6, 1869 Arthur L. Bowley born in Bristol, UK. 🇬🇧
1901: Smoothing of time series in one of the 1st text books on data graphics
He used 3-, 5-, 10- year running averages, discussed the merits of smoothing
#rstats: data(Bowley, package="HistData"); example(Bowley)


November 7, 2025 at 2:23 AM
#TodayinHistory #dataviz #OTD 📊
🎂Nov 6, 1869 Arthur L. Bowley born in Bristol, UK. 🇬🇧
1901: Smoothing of time series in one of the 1st text books on data graphics
He used 3-, 5-, 10- year running averages, discussed the merits of smoothing
#rstats: data(Bowley, package="HistData"); example(Bowley)
🎂Nov 6, 1869 Arthur L. Bowley born in Bristol, UK. 🇬🇧
1901: Smoothing of time series in one of the 1st text books on data graphics
He used 3-, 5-, 10- year running averages, discussed the merits of smoothing
#rstats: data(Bowley, package="HistData"); example(Bowley)
#TodayinHistory #dataviz #OTD 📊
🎂Nov 6, 1771 Aloys Senefelder born in Prague, Czech Republic
1798: Invention of lithographic technique for printing of maps and diagrams 🗺️
"At the time the effect of lithography ... was as great as has been the introduction [of the Xerox machine]" - A.H. Robinson
🎂Nov 6, 1771 Aloys Senefelder born in Prague, Czech Republic
1798: Invention of lithographic technique for printing of maps and diagrams 🗺️
"At the time the effect of lithography ... was as great as has been the introduction [of the Xerox machine]" - A.H. Robinson


November 7, 2025 at 1:50 AM
#TodayinHistory #dataviz #OTD 📊
🎂Nov 6, 1771 Aloys Senefelder born in Prague, Czech Republic
1798: Invention of lithographic technique for printing of maps and diagrams 🗺️
"At the time the effect of lithography ... was as great as has been the introduction [of the Xerox machine]" - A.H. Robinson
🎂Nov 6, 1771 Aloys Senefelder born in Prague, Czech Republic
1798: Invention of lithographic technique for printing of maps and diagrams 🗺️
"At the time the effect of lithography ... was as great as has been the introduction [of the Xerox machine]" - A.H. Robinson

#TodayinHistory #dataviz #OTD 📊
💀Nov 5, 1879 James Clerk Maxwell died in Cambridge, England 🏴
1861: Invention of the trichromatic process for making color photographs, by taking three monochrome images through red, green and blue filters
💀Nov 5, 1879 James Clerk Maxwell died in Cambridge, England 🏴
1861: Invention of the trichromatic process for making color photographs, by taking three monochrome images through red, green and blue filters


November 2, 2025 at 1:21 AM
#TodayinHistory #dataviz #OTD 📊
💀Nov 5, 1879 James Clerk Maxwell died in Cambridge, England 🏴
1861: Invention of the trichromatic process for making color photographs, by taking three monochrome images through red, green and blue filters
💀Nov 5, 1879 James Clerk Maxwell died in Cambridge, England 🏴
1861: Invention of the trichromatic process for making color photographs, by taking three monochrome images through red, green and blue filters
#TodayinHistory #dataviz #OTD 📊
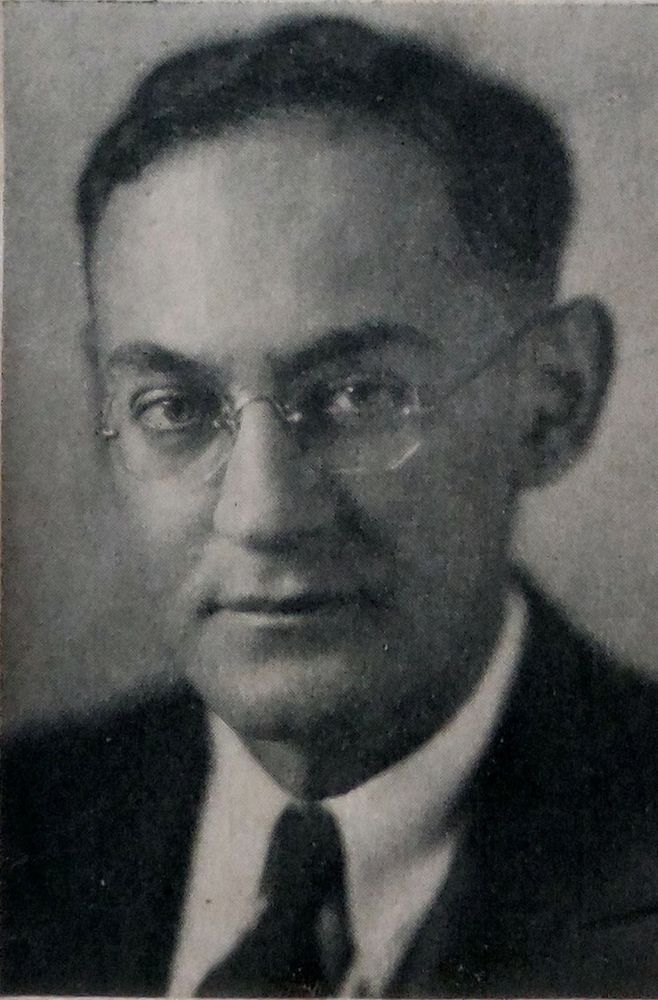
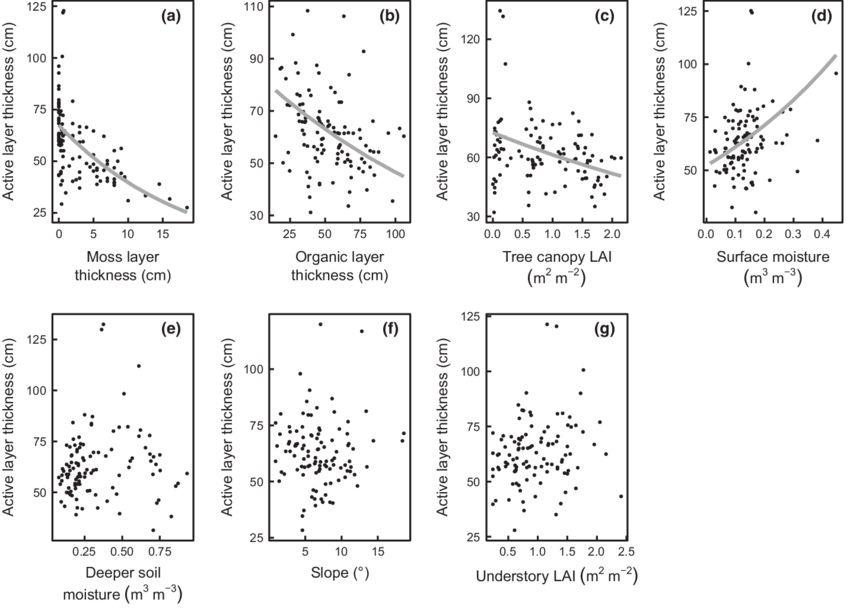
💀Oct 31, 1974 Mordecai J. B. Ezekial died in Washington, D.C, USA 🇺🇸
In 1924, he developed the essential idea behind what are now called _partial residual plots_ -- showing the net relation of a predictor controlling for others.
💀Oct 31, 1974 Mordecai J. B. Ezekial died in Washington, D.C, USA 🇺🇸
In 1924, he developed the essential idea behind what are now called _partial residual plots_ -- showing the net relation of a predictor controlling for others.
November 1, 2025 at 1:29 AM
#TodayinHistory #dataviz #OTD 📊
💀Oct 31, 1974 Mordecai J. B. Ezekial died in Washington, D.C, USA 🇺🇸
In 1924, he developed the essential idea behind what are now called _partial residual plots_ -- showing the net relation of a predictor controlling for others.
💀Oct 31, 1974 Mordecai J. B. Ezekial died in Washington, D.C, USA 🇺🇸
In 1924, he developed the essential idea behind what are now called _partial residual plots_ -- showing the net relation of a predictor controlling for others.
🎃🎃🎃 For Halloween, Dr. Matrix wields some scary vectors, some of which may be magically eigen. 🪄
What a singular value!
What a singular value!

November 1, 2025 at 12:38 AM
🎃🎃🎃 For Halloween, Dr. Matrix wields some scary vectors, some of which may be magically eigen. 🪄
What a singular value!
What a singular value!
#TodayinHistory #dataviz #OTD 📊
💀Oct 30, 1626 Willebrord van Roijen Snell died in Leiden, NL 🇳🇱
1617: First use of Gemma Frisius' method of trigonometric triangulation to produce locations of major cities in Holland, detailed in book Eratosthenes Batavus.
Helped establish the field of geodesy.
💀Oct 30, 1626 Willebrord van Roijen Snell died in Leiden, NL 🇳🇱
1617: First use of Gemma Frisius' method of trigonometric triangulation to produce locations of major cities in Holland, detailed in book Eratosthenes Batavus.
Helped establish the field of geodesy.


October 31, 2025 at 1:03 AM
#TodayinHistory #dataviz #OTD 📊
💀Oct 30, 1626 Willebrord van Roijen Snell died in Leiden, NL 🇳🇱
1617: First use of Gemma Frisius' method of trigonometric triangulation to produce locations of major cities in Holland, detailed in book Eratosthenes Batavus.
Helped establish the field of geodesy.
💀Oct 30, 1626 Willebrord van Roijen Snell died in Leiden, NL 🇳🇱
1617: First use of Gemma Frisius' method of trigonometric triangulation to produce locations of major cities in Holland, detailed in book Eratosthenes Batavus.
Helped establish the field of geodesy.
#TodayinHistory #dataviz #OTD 📊
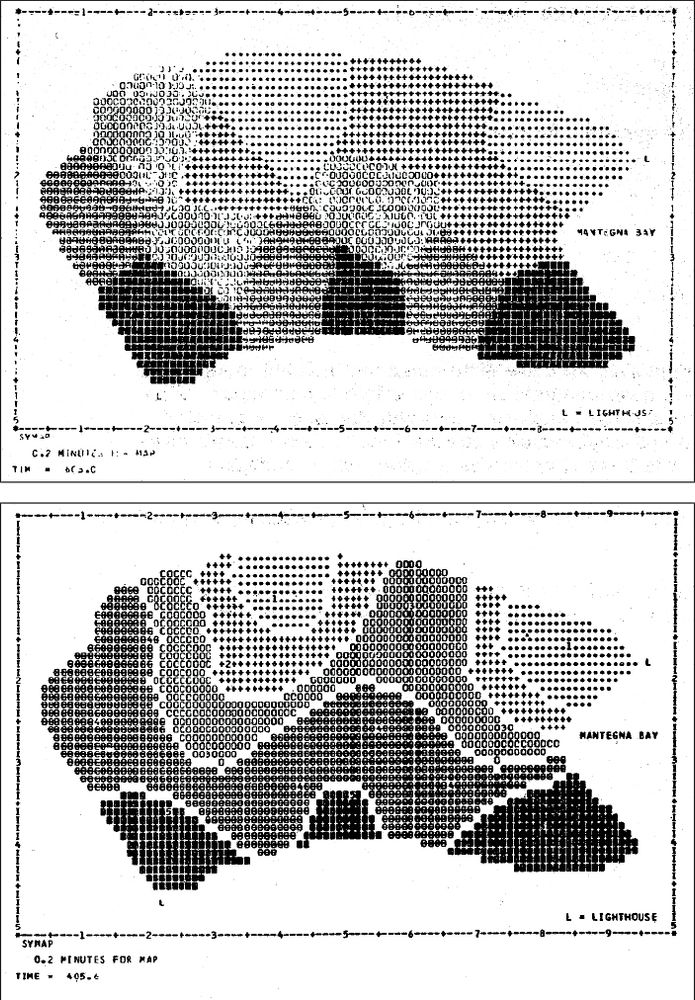
🎂Oct 30, 1903 Howard Taylor Fisher born in Chicago, Illinois, USA 🇺🇸
1960: Initial development of geographic information systems (SYMAP), combining spatially-referenced data, spatial models and map-based visualization.
[Graphics done on a mainframe line printer]
🎂Oct 30, 1903 Howard Taylor Fisher born in Chicago, Illinois, USA 🇺🇸
1960: Initial development of geographic information systems (SYMAP), combining spatially-referenced data, spatial models and map-based visualization.
[Graphics done on a mainframe line printer]

October 31, 2025 at 12:17 AM
#TodayinHistory #dataviz #OTD 📊
🎂Oct 30, 1903 Howard Taylor Fisher born in Chicago, Illinois, USA 🇺🇸
1960: Initial development of geographic information systems (SYMAP), combining spatially-referenced data, spatial models and map-based visualization.
[Graphics done on a mainframe line printer]
🎂Oct 30, 1903 Howard Taylor Fisher born in Chicago, Illinois, USA 🇺🇸
1960: Initial development of geographic information systems (SYMAP), combining spatially-referenced data, spatial models and map-based visualization.
[Graphics done on a mainframe line printer]
#TodayinHistory #dataviz #OTD 📊
💀Oct 29, 1946 Leonard Porter Ayres died in Cleveland, Ohio, 🇺🇸
1919: Social statistical chartbook, containing a variety of graphic and semi-graphic displays in a USA Government report, ending a dark period in govt graphics
(These ideas influenced JW Tukey's EDA)
💀Oct 29, 1946 Leonard Porter Ayres died in Cleveland, Ohio, 🇺🇸
1919: Social statistical chartbook, containing a variety of graphic and semi-graphic displays in a USA Government report, ending a dark period in govt graphics
(These ideas influenced JW Tukey's EDA)


October 30, 2025 at 1:17 AM
#TodayinHistory #dataviz #OTD 📊
💀Oct 29, 1946 Leonard Porter Ayres died in Cleveland, Ohio, 🇺🇸
1919: Social statistical chartbook, containing a variety of graphic and semi-graphic displays in a USA Government report, ending a dark period in govt graphics
(These ideas influenced JW Tukey's EDA)
💀Oct 29, 1946 Leonard Porter Ayres died in Cleveland, Ohio, 🇺🇸
1919: Social statistical chartbook, containing a variety of graphic and semi-graphic displays in a USA Government report, ending a dark period in govt graphics
(These ideas influenced JW Tukey's EDA)
#TodayinHistory #dataviz #OTD 📊
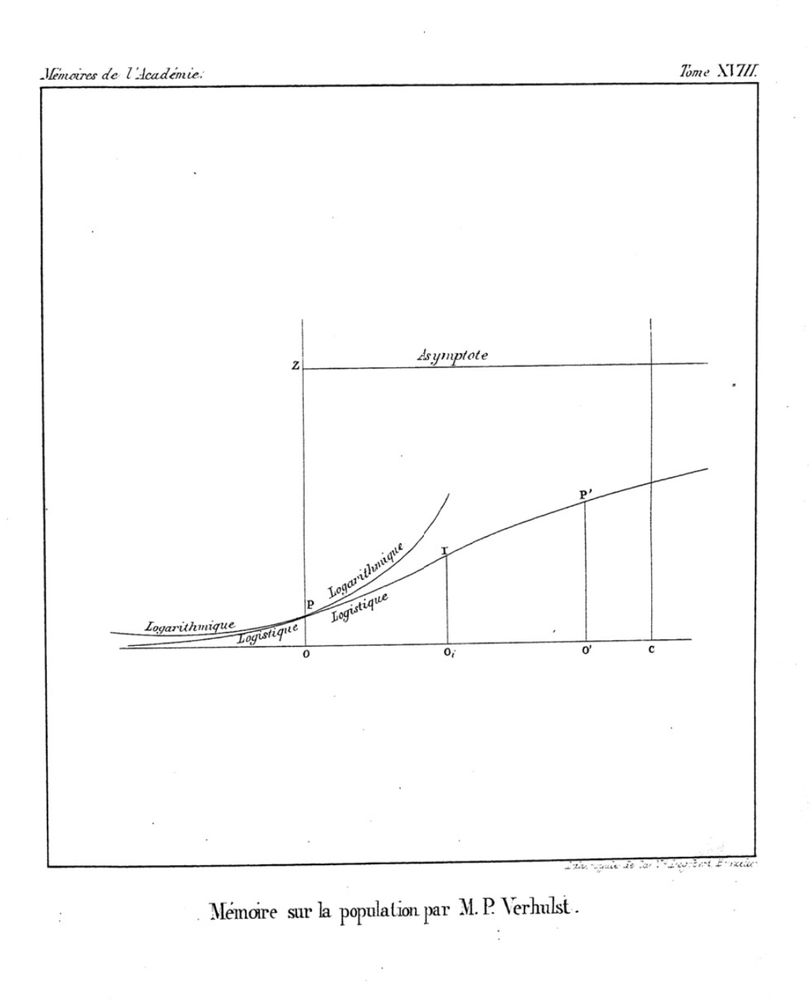
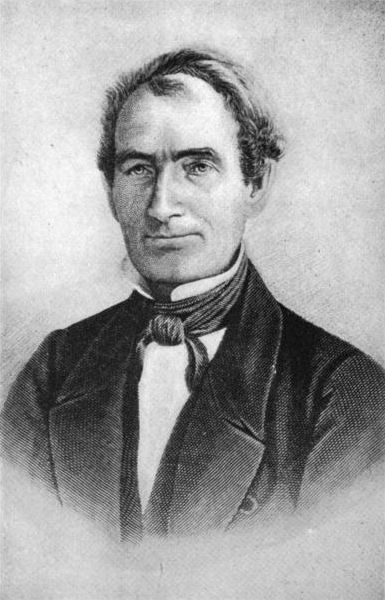
🎂Oct 28, 1804 Pierre-Francois Verhulst born in Brussels, Belgium 🇧🇪
1839: Development of the logistic curve,
y = k / (1 + C e^{rt}),
to describe the growth of human populations
🎂Oct 28, 1804 Pierre-Francois Verhulst born in Brussels, Belgium 🇧🇪
1839: Development of the logistic curve,
y = k / (1 + C e^{rt}),
to describe the growth of human populations

October 29, 2025 at 12:54 AM
#TodayinHistory #dataviz #OTD 📊
🎂Oct 28, 1804 Pierre-Francois Verhulst born in Brussels, Belgium 🇧🇪
1839: Development of the logistic curve,
y = k / (1 + C e^{rt}),
to describe the growth of human populations
🎂Oct 28, 1804 Pierre-Francois Verhulst born in Brussels, Belgium 🇧🇪
1839: Development of the logistic curve,
y = k / (1 + C e^{rt}),
to describe the growth of human populations
#TodayinHistory #dataviz #OTD 📊
📅Oct 27, 1654 Blaise Pascal wrote his last letter to Pierre de Fermat, detailing the beginning of the modern theory of probability. [Ball:1908]
🔗 bit.ly/48mjSoO
📅Oct 27, 1654 Blaise Pascal wrote his last letter to Pierre de Fermat, detailing the beginning of the modern theory of probability. [Ball:1908]
🔗 bit.ly/48mjSoO


October 28, 2025 at 12:22 AM
#TodayinHistory #dataviz #OTD 📊
📅Oct 27, 1654 Blaise Pascal wrote his last letter to Pierre de Fermat, detailing the beginning of the modern theory of probability. [Ball:1908]
🔗 bit.ly/48mjSoO
📅Oct 27, 1654 Blaise Pascal wrote his last letter to Pierre de Fermat, detailing the beginning of the modern theory of probability. [Ball:1908]
🔗 bit.ly/48mjSoO
#TodayinHistory #dataviz #OTD 📊
📅Oct 26, 1893 Karl Pearson's first statistical publication, a letter to Nature [Stigler:1986, p.331]
Asymmetrical Frequency Curves,
👀 www.nature.com/articles/048...
📅Oct 26, 1893 Karl Pearson's first statistical publication, a letter to Nature [Stigler:1986, p.331]
Asymmetrical Frequency Curves,
👀 www.nature.com/articles/048...

October 27, 2025 at 11:55 PM
#TodayinHistory #dataviz #OTD 📊
📅Oct 26, 1893 Karl Pearson's first statistical publication, a letter to Nature [Stigler:1986, p.331]
Asymmetrical Frequency Curves,
👀 www.nature.com/articles/048...
📅Oct 26, 1893 Karl Pearson's first statistical publication, a letter to Nature [Stigler:1986, p.331]
Asymmetrical Frequency Curves,
👀 www.nature.com/articles/048...
#TodayinHistory #dataviz #OTD 📊
🎂Oct 26, 1954 Luke Tierney born in New York City, NY, USA 🇺🇸
1990: Lisp-Stat, an object-oriented environment for statistical computing and dynamic graphics based on lisp. It was Influential for devel of S, now #rstats
🎂Oct 26, 1954 Luke Tierney born in New York City, NY, USA 🇺🇸
1990: Lisp-Stat, an object-oriented environment for statistical computing and dynamic graphics based on lisp. It was Influential for devel of S, now #rstats


October 27, 2025 at 1:41 AM
#TodayinHistory #dataviz #OTD 📊
🎂Oct 26, 1954 Luke Tierney born in New York City, NY, USA 🇺🇸
1990: Lisp-Stat, an object-oriented environment for statistical computing and dynamic graphics based on lisp. It was Influential for devel of S, now #rstats
🎂Oct 26, 1954 Luke Tierney born in New York City, NY, USA 🇺🇸
1990: Lisp-Stat, an object-oriented environment for statistical computing and dynamic graphics based on lisp. It was Influential for devel of S, now #rstats
#TodayinHistory #dataviz #OTD 📊
💀Oct 25, 1914 Wilhelm Lexis died in Gottingen, Germany 🇩🇪
1875: The Lexis diagram, showing relations among age (cohort), calendar time, and life spans of individuals simultaneously.
Revolutionized demography, making key variables visible
💀Oct 25, 1914 Wilhelm Lexis died in Gottingen, Germany 🇩🇪
1875: The Lexis diagram, showing relations among age (cohort), calendar time, and life spans of individuals simultaneously.
Revolutionized demography, making key variables visible


October 26, 2025 at 1:36 AM
#TodayinHistory #dataviz #OTD 📊
💀Oct 25, 1914 Wilhelm Lexis died in Gottingen, Germany 🇩🇪
1875: The Lexis diagram, showing relations among age (cohort), calendar time, and life spans of individuals simultaneously.
Revolutionized demography, making key variables visible
💀Oct 25, 1914 Wilhelm Lexis died in Gottingen, Germany 🇩🇪
1875: The Lexis diagram, showing relations among age (cohort), calendar time, and life spans of individuals simultaneously.
Revolutionized demography, making key variables visible
How about those
@bluejaysbot.bsky.social
9 -- that's NINE -- read 'em NINE runs in the bottom of the 6th
@bluejaysbot.bsky.social
9 -- that's NINE -- read 'em NINE runs in the bottom of the 6th

October 25, 2025 at 2:45 AM
How about those
@bluejaysbot.bsky.social
9 -- that's NINE -- read 'em NINE runs in the bottom of the 6th
@bluejaysbot.bsky.social
9 -- that's NINE -- read 'em NINE runs in the bottom of the 6th