


Chris Graham
@chrisgrahamuk.bsky.social
Chief Executive at Picker. Interested in health policy, person centred care, and in understanding, measuring, and improving patient and staff experiences. All views are my own, reposts are not endorsements.
Remember when PriceWaterhouse Coopers spent £75m on rebranding its consulting arm as Monday, then sold it to IBM who immediately dropped the name?
news.bbc.co.uk/1/hi/uk/2163...
news.bbc.co.uk/1/hi/uk/2163...
BBC NEWS | UK | R.I.P. Monday
news.bbc.co.uk
April 23, 2025 at 8:07 PM
Remember when PriceWaterhouse Coopers spent £75m on rebranding its consulting arm as Monday, then sold it to IBM who immediately dropped the name?
news.bbc.co.uk/1/hi/uk/2163...
news.bbc.co.uk/1/hi/uk/2163...
There's lots more to explore in the excellent summary and full report at www.kingsfund.org.uk/insight-and-... - full credit to @thekingsfund.bsky.social & @nuffieldtrust.bsky.social for this insightful, must-read analysis.
🧵8/8
🧵8/8
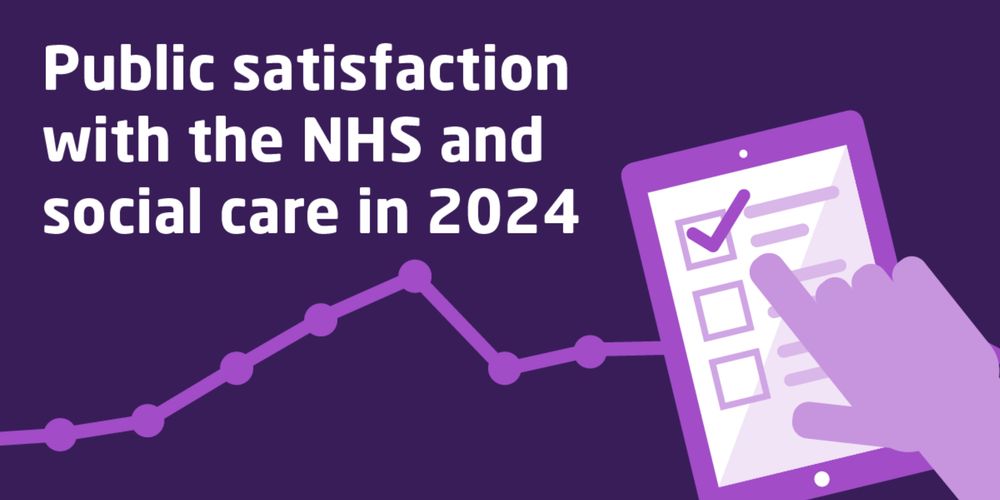
Public Satisfaction With The NHS And Social Care In 2024 | BSA | The King's Fund
This report explores public satisfaction with the NHS and social care in 2024. Just 1 in 5 people in 2024 said they were satisfied with the NHS. This is the lowest level of satisfaction recorded since...
www.kingsfund.org.uk
April 2, 2025 at 10:53 AM
There's lots more to explore in the excellent summary and full report at www.kingsfund.org.uk/insight-and-... - full credit to @thekingsfund.bsky.social & @nuffieldtrust.bsky.social for this insightful, must-read analysis.
🧵8/8
🧵8/8
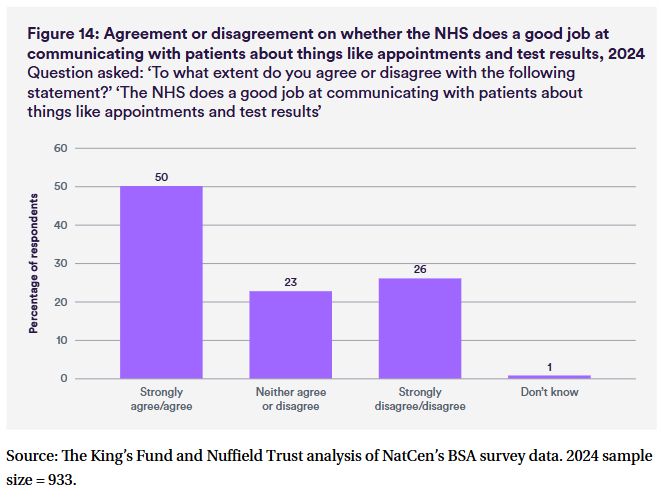
There are some really interesting new questions in this year's edition. One that stands out is around communication - only 50% agree that the NHS "does a good job at communicating with patients about
things like appointments and test results".
🧵7/8
things like appointments and test results".
🧵7/8
April 2, 2025 at 10:53 AM
There are some really interesting new questions in this year's edition. One that stands out is around communication - only 50% agree that the NHS "does a good job at communicating with patients about
things like appointments and test results".
🧵7/8
things like appointments and test results".
🧵7/8
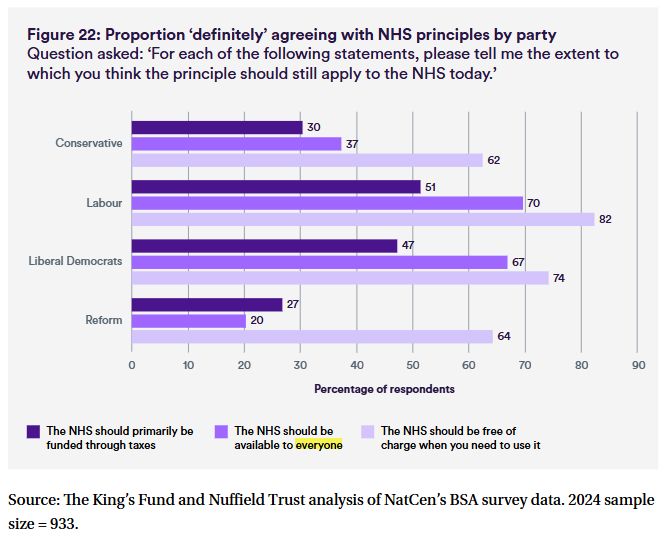
I was sad to see an 11% point drop in the proportion who 'definitely' agree that "the NHS should be available to everyone" - down from 67% to 56%. Attitudes to this issue vary by people's political allegiances.
🧵6/8
🧵6/8
April 2, 2025 at 10:53 AM
I was sad to see an 11% point drop in the proportion who 'definitely' agree that "the NHS should be available to everyone" - down from 67% to 56%. Attitudes to this issue vary by people's political allegiances.
🧵6/8
🧵6/8
The survey no longer asks for the reasons for dissatisfaction - but the issues that people are most dissatisfied with are around waiting times and staffing levels.
Public views of staffing levels are, in my opinion, likely to be bound up with experiences of waiting.
🧵5/8
Public views of staffing levels are, in my opinion, likely to be bound up with experiences of waiting.
🧵5/8
April 2, 2025 at 10:53 AM
The survey no longer asks for the reasons for dissatisfaction - but the issues that people are most dissatisfied with are around waiting times and staffing levels.
Public views of staffing levels are, in my opinion, likely to be bound up with experiences of waiting.
🧵5/8
Public views of staffing levels are, in my opinion, likely to be bound up with experiences of waiting.
🧵5/8
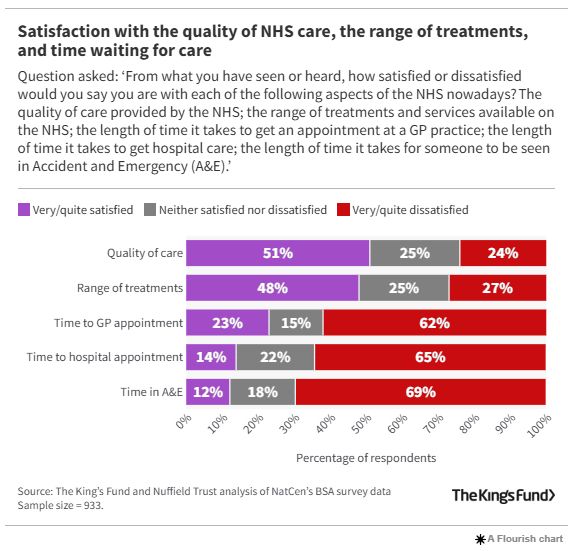
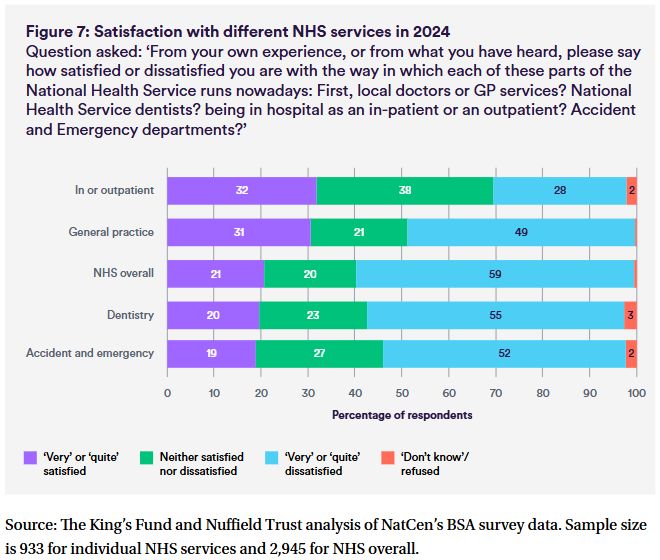
Levels of dissatisfaction vary across services, with the steepest rise in A&E.
🦷 Dentistry: 55% dissatisfied, a 7% pt increase
🚑 A&E depts: 52% dissatisfied, a 15% pt increase
🩺 GP services: 49% dissatisfied, an 8% pt increase
🏥 In/outpatient hospital services: 28% dissatisfied (new)
🧵4/8
🦷 Dentistry: 55% dissatisfied, a 7% pt increase
🚑 A&E depts: 52% dissatisfied, a 15% pt increase
🩺 GP services: 49% dissatisfied, an 8% pt increase
🏥 In/outpatient hospital services: 28% dissatisfied (new)
🧵4/8
April 2, 2025 at 10:53 AM
Levels of dissatisfaction vary across services, with the steepest rise in A&E.
🦷 Dentistry: 55% dissatisfied, a 7% pt increase
🚑 A&E depts: 52% dissatisfied, a 15% pt increase
🩺 GP services: 49% dissatisfied, an 8% pt increase
🏥 In/outpatient hospital services: 28% dissatisfied (new)
🧵4/8
🦷 Dentistry: 55% dissatisfied, a 7% pt increase
🚑 A&E depts: 52% dissatisfied, a 15% pt increase
🩺 GP services: 49% dissatisfied, an 8% pt increase
🏥 In/outpatient hospital services: 28% dissatisfied (new)
🧵4/8
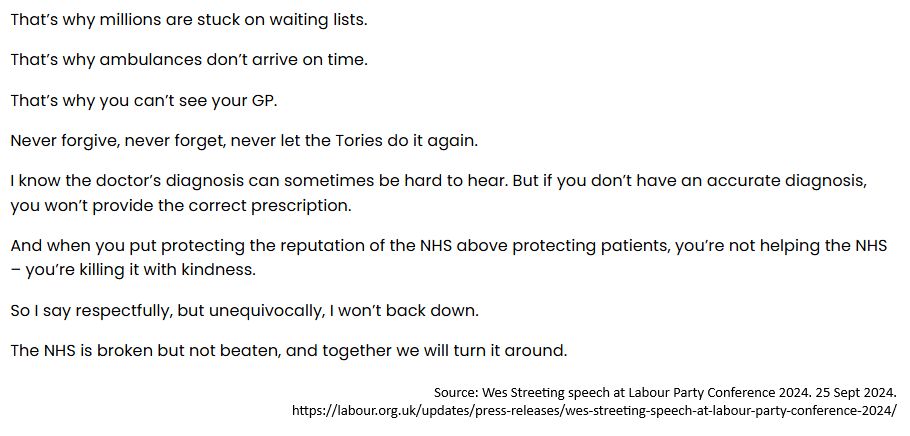
How to interpret that decline? Data was collected in Sept/October 2024 - early days for the new Govt, and SoS's message was that "the NHS is broken" (eg see image).
It's no surprise that people are dissatistifed - but it reminds us of the urgent need for improvement to restore confidence.
🧵3/8
It's no surprise that people are dissatistifed - but it reminds us of the urgent need for improvement to restore confidence.
🧵3/8
April 2, 2025 at 10:53 AM
How to interpret that decline? Data was collected in Sept/October 2024 - early days for the new Govt, and SoS's message was that "the NHS is broken" (eg see image).
It's no surprise that people are dissatistifed - but it reminds us of the urgent need for improvement to restore confidence.
🧵3/8
It's no surprise that people are dissatistifed - but it reminds us of the urgent need for improvement to restore confidence.
🧵3/8
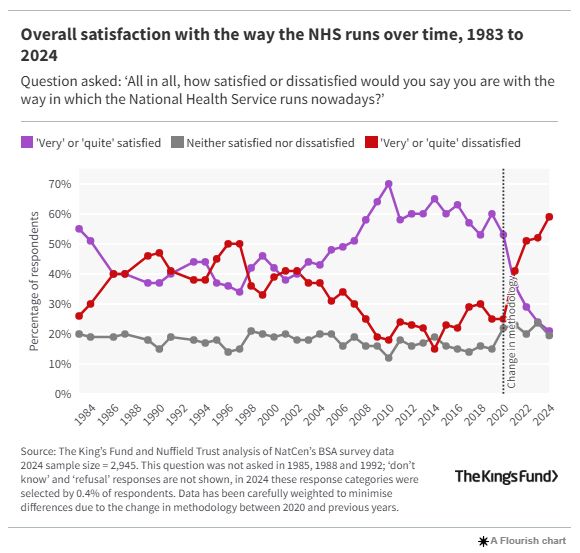
Overall satisfaction with the health service has continued to nosedive. Pre-pandemic, 60% of people were 'very'/'quite' satisfied with "the way the NHS runs": it's now 21%.
If there's a positive, the rate of decline has slowed: 'only' a 3% drop this year. But dissatisfaction has risen 7% pts.
🧵2/8
If there's a positive, the rate of decline has slowed: 'only' a 3% drop this year. But dissatisfaction has risen 7% pts.
🧵2/8
April 2, 2025 at 10:53 AM
Overall satisfaction with the health service has continued to nosedive. Pre-pandemic, 60% of people were 'very'/'quite' satisfied with "the way the NHS runs": it's now 21%.
If there's a positive, the rate of decline has slowed: 'only' a 3% drop this year. But dissatisfaction has risen 7% pts.
🧵2/8
If there's a positive, the rate of decline has slowed: 'only' a 3% drop this year. But dissatisfaction has risen 7% pts.
🧵2/8