


Chris Graham
@chrisgrahamuk.bsky.social
Chief Executive at Picker. Interested in health policy, person centred care, and in understanding, measuring, and improving patient and staff experiences. All views are my own, reposts are not endorsements.
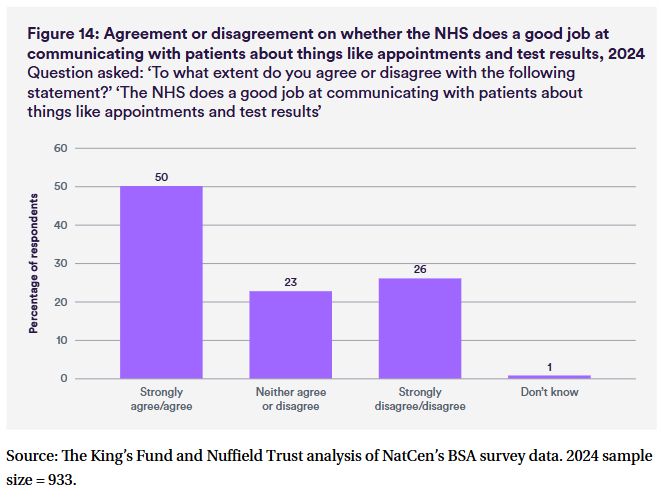
There are some really interesting new questions in this year's edition. One that stands out is around communication - only 50% agree that the NHS "does a good job at communicating with patients about
things like appointments and test results".
🧵7/8
things like appointments and test results".
🧵7/8
April 2, 2025 at 10:53 AM
There are some really interesting new questions in this year's edition. One that stands out is around communication - only 50% agree that the NHS "does a good job at communicating with patients about
things like appointments and test results".
🧵7/8
things like appointments and test results".
🧵7/8
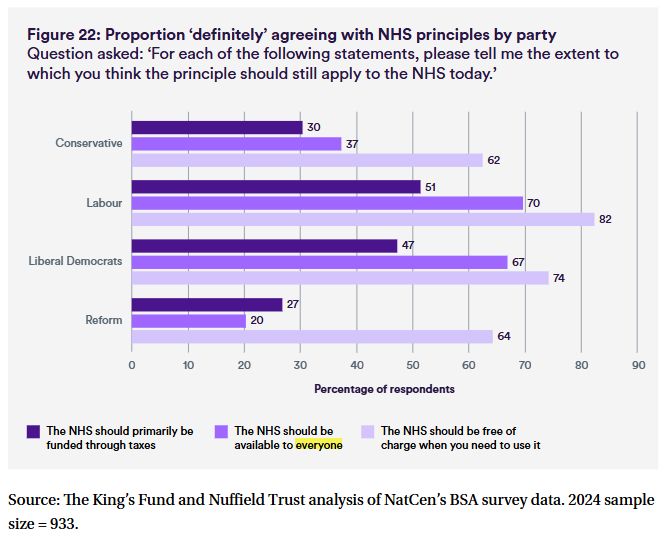
I was sad to see an 11% point drop in the proportion who 'definitely' agree that "the NHS should be available to everyone" - down from 67% to 56%. Attitudes to this issue vary by people's political allegiances.
🧵6/8
🧵6/8
April 2, 2025 at 10:53 AM
I was sad to see an 11% point drop in the proportion who 'definitely' agree that "the NHS should be available to everyone" - down from 67% to 56%. Attitudes to this issue vary by people's political allegiances.
🧵6/8
🧵6/8
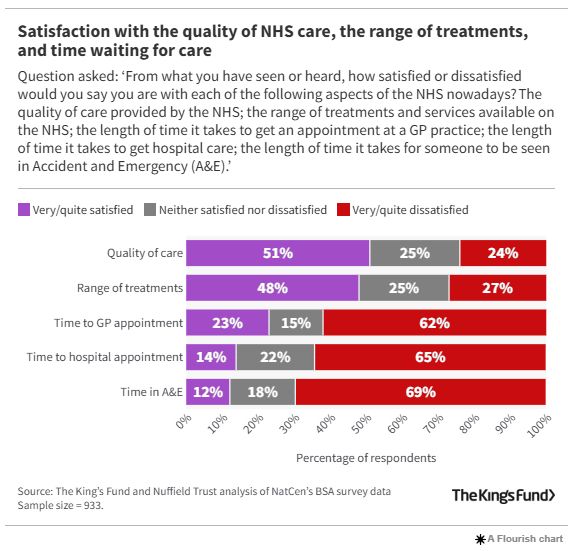
The survey no longer asks for the reasons for dissatisfaction - but the issues that people are most dissatisfied with are around waiting times and staffing levels.
Public views of staffing levels are, in my opinion, likely to be bound up with experiences of waiting.
🧵5/8
Public views of staffing levels are, in my opinion, likely to be bound up with experiences of waiting.
🧵5/8
April 2, 2025 at 10:53 AM
The survey no longer asks for the reasons for dissatisfaction - but the issues that people are most dissatisfied with are around waiting times and staffing levels.
Public views of staffing levels are, in my opinion, likely to be bound up with experiences of waiting.
🧵5/8
Public views of staffing levels are, in my opinion, likely to be bound up with experiences of waiting.
🧵5/8
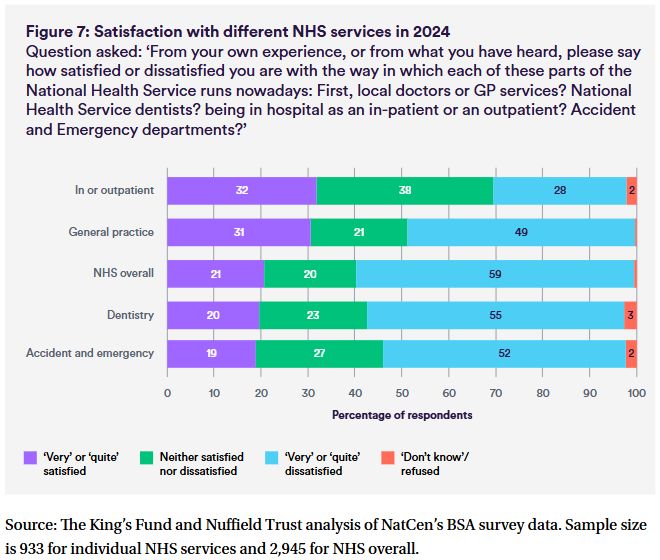
Levels of dissatisfaction vary across services, with the steepest rise in A&E.
🦷 Dentistry: 55% dissatisfied, a 7% pt increase
🚑 A&E depts: 52% dissatisfied, a 15% pt increase
🩺 GP services: 49% dissatisfied, an 8% pt increase
🏥 In/outpatient hospital services: 28% dissatisfied (new)
🧵4/8
🦷 Dentistry: 55% dissatisfied, a 7% pt increase
🚑 A&E depts: 52% dissatisfied, a 15% pt increase
🩺 GP services: 49% dissatisfied, an 8% pt increase
🏥 In/outpatient hospital services: 28% dissatisfied (new)
🧵4/8
April 2, 2025 at 10:53 AM
Levels of dissatisfaction vary across services, with the steepest rise in A&E.
🦷 Dentistry: 55% dissatisfied, a 7% pt increase
🚑 A&E depts: 52% dissatisfied, a 15% pt increase
🩺 GP services: 49% dissatisfied, an 8% pt increase
🏥 In/outpatient hospital services: 28% dissatisfied (new)
🧵4/8
🦷 Dentistry: 55% dissatisfied, a 7% pt increase
🚑 A&E depts: 52% dissatisfied, a 15% pt increase
🩺 GP services: 49% dissatisfied, an 8% pt increase
🏥 In/outpatient hospital services: 28% dissatisfied (new)
🧵4/8
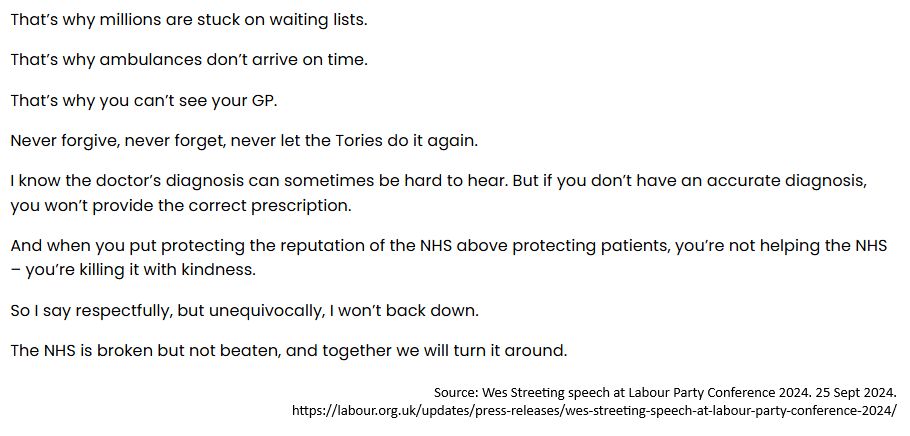
How to interpret that decline? Data was collected in Sept/October 2024 - early days for the new Govt, and SoS's message was that "the NHS is broken" (eg see image).
It's no surprise that people are dissatistifed - but it reminds us of the urgent need for improvement to restore confidence.
🧵3/8
It's no surprise that people are dissatistifed - but it reminds us of the urgent need for improvement to restore confidence.
🧵3/8
April 2, 2025 at 10:53 AM
How to interpret that decline? Data was collected in Sept/October 2024 - early days for the new Govt, and SoS's message was that "the NHS is broken" (eg see image).
It's no surprise that people are dissatistifed - but it reminds us of the urgent need for improvement to restore confidence.
🧵3/8
It's no surprise that people are dissatistifed - but it reminds us of the urgent need for improvement to restore confidence.
🧵3/8
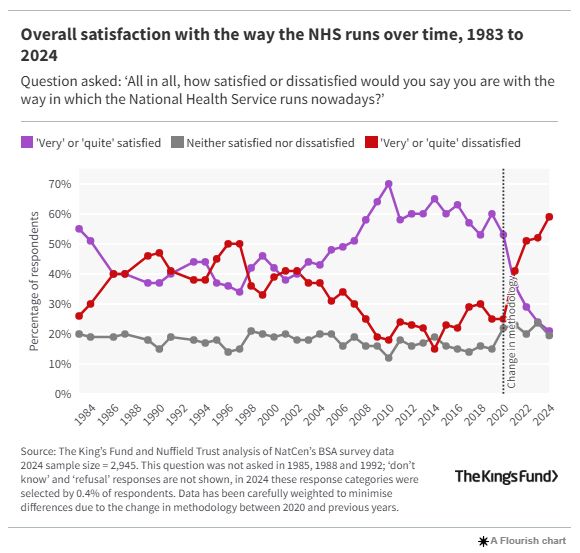
Overall satisfaction with the health service has continued to nosedive. Pre-pandemic, 60% of people were 'very'/'quite' satisfied with "the way the NHS runs": it's now 21%.
If there's a positive, the rate of decline has slowed: 'only' a 3% drop this year. But dissatisfaction has risen 7% pts.
🧵2/8
If there's a positive, the rate of decline has slowed: 'only' a 3% drop this year. But dissatisfaction has risen 7% pts.
🧵2/8
April 2, 2025 at 10:53 AM
Overall satisfaction with the health service has continued to nosedive. Pre-pandemic, 60% of people were 'very'/'quite' satisfied with "the way the NHS runs": it's now 21%.
If there's a positive, the rate of decline has slowed: 'only' a 3% drop this year. But dissatisfaction has risen 7% pts.
🧵2/8
If there's a positive, the rate of decline has slowed: 'only' a 3% drop this year. But dissatisfaction has risen 7% pts.
🧵2/8
Far too few patients felt involved in their care and treatment, an essential part of person centred care.
Only 58% of T1 and 71% of T3 patients were "definitely" involved as much as they wanted.
Only 58% of T1 and 71% of T3 patients were "definitely" involved as much as they wanted.


November 21, 2024 at 11:29 AM
Far too few patients felt involved in their care and treatment, an essential part of person centred care.
Only 58% of T1 and 71% of T3 patients were "definitely" involved as much as they wanted.
Only 58% of T1 and 71% of T3 patients were "definitely" involved as much as they wanted.
There was evidence of time pressures when people were treated, too. Only 61% "definitely" had enough time to discuss their condition/treatment with a doctor or nurse; only 69% thought that doctors and nurses "definitely" listened to what they had to say.

November 21, 2024 at 11:23 AM
There was evidence of time pressures when people were treated, too. Only 61% "definitely" had enough time to discuss their condition/treatment with a doctor or nurse; only 69% thought that doctors and nurses "definitely" listened to what they had to say.
The target for A&Es is for patients to be seen and assessed by a doctor or nurse within 15 minutes of arrival. In February 2024, only 29% were - and almost as many (28%) waited more than an hour for an initial assessment.
Type 3 departments did a bit better but still 19% waited more than an hour.
Type 3 departments did a bit better but still 19% waited more than an hour.

November 21, 2024 at 11:14 AM
The target for A&Es is for patients to be seen and assessed by a doctor or nurse within 15 minutes of arrival. In February 2024, only 29% were - and almost as many (28%) waited more than an hour for an initial assessment.
Type 3 departments did a bit better but still 19% waited more than an hour.
Type 3 departments did a bit better but still 19% waited more than an hour.
The failure to value patients' time - & privileging of the service's time - is so frustrating. This section from Faster (1999) by @gleick.mas.to.ap.brid.gy describes it well.
Surely it couldn't be too difficult to include a message saying "there are x people ahead of you; average wait is y mins"?
Surely it couldn't be too difficult to include a message saying "there are x people ahead of you; average wait is y mins"?

November 14, 2024 at 2:20 PM
The failure to value patients' time - & privileging of the service's time - is so frustrating. This section from Faster (1999) by @gleick.mas.to.ap.brid.gy describes it well.
Surely it couldn't be too difficult to include a message saying "there are x people ahead of you; average wait is y mins"?
Surely it couldn't be too difficult to include a message saying "there are x people ahead of you; average wait is y mins"?
