

Alex Ruane
@alexruane.bsky.social
NASA Goddard Institute for Space Studies Impacts Group co-Director making Earth information useful to people and systems at risk; IPCC AR6 WGI CLA + SYR Core Writing Team Member; Columbia University; AgMIP Science Coordinator & Climate Team Lead
Fortunate to attend last night’s early access party for MoMA Pirouette exhibit featuring @edhawkins.org Climate Stripes and Climate Spiral alongside other iconic designs (like original I❤️NY, crocs and first emojis). I can’t share inside photos but climate stripes prominently visible from 54th St!

January 23, 2025 at 10:05 PM
Fortunate to attend last night’s early access party for MoMA Pirouette exhibit featuring @edhawkins.org Climate Stripes and Climate Spiral alongside other iconic designs (like original I❤️NY, crocs and first emojis). I can’t share inside photos but climate stripes prominently visible from 54th St!
Looking for summer interns to help refine our climate game that builds off our IPCC SYR Figure SPM.1. Climate affects each region and generation differently - what if that was better represented in climate planning?
Looking for USA undergrads to apply at stemgateway.nasa.gov/s/course-off...
Looking for USA undergrads to apply at stemgateway.nasa.gov/s/course-off...
January 13, 2025 at 5:00 PM
Looking for summer interns to help refine our climate game that builds off our IPCC SYR Figure SPM.1. Climate affects each region and generation differently - what if that was better represented in climate planning?
Looking for USA undergrads to apply at stemgateway.nasa.gov/s/course-off...
Looking for USA undergrads to apply at stemgateway.nasa.gov/s/course-off...
Scale of devastation in Los Angeles is hard to comprehend. This snapshot from www.fire.ca.gov shows how the Eaton Fire is steamrolling through dense city neighborhoods, pushed on toward the coast by hot/dry Santa Ana winds. A catastrophic set of conditions on top of increasingly perilous baseline.

January 10, 2025 at 5:26 AM
Scale of devastation in Los Angeles is hard to comprehend. This snapshot from www.fire.ca.gov shows how the Eaton Fire is steamrolling through dense city neighborhoods, pushed on toward the coast by hot/dry Santa Ana winds. A catastrophic set of conditions on top of increasingly perilous baseline.
Kilauea eruption for Christmas Eve treat on the Big Island of Hawaii! Lava spurting several hundred feet high in a continuous fountain, with an ash and gas plume spectacularly catching the sunset. Only getting better as it gets darker

December 25, 2024 at 4:09 AM
Kilauea eruption for Christmas Eve treat on the Big Island of Hawaii! Lava spurting several hundred feet high in a continuous fountain, with an ash and gas plume spectacularly catching the sunset. Only getting better as it gets darker
Poster shows how changes to one part of ModelE, for example adding resolution to upper atmosphere, has notable footprint across many conditions relevant to nature and society (CIDs). In many cases biases shift but climate change signal is more robust signal less sensitive to model version 2/4

December 13, 2024 at 1:56 PM
Poster shows how changes to one part of ModelE, for example adding resolution to upper atmosphere, has notable footprint across many conditions relevant to nature and society (CIDs). In many cases biases shift but climate change signal is more robust signal less sensitive to model version 2/4
Later this morning I will stand by AGU poster GC51X-0295 showing a study led by Max Elling. This collaboration between the NASA GISS ModelE Earth Systems Model development team and GISS Climate Impacts Group uses the Climatic Impact-Driver (CID) framework to track changes in ModelE versions. 🧵 1/4

December 13, 2024 at 1:56 PM
Later this morning I will stand by AGU poster GC51X-0295 showing a study led by Max Elling. This collaboration between the NASA GISS ModelE Earth Systems Model development team and GISS Climate Impacts Group uses the Climatic Impact-Driver (CID) framework to track changes in ModelE versions. 🧵 1/4
For those at AGU - stop by my poster this morning to learn about current state of climate game we have been developing over the past two years with a team of all-star interns. Game builds on IPCC SYR Figure SPM.1 to allow unique cooperation across time and space. Education section poster ED31B-2244

December 11, 2024 at 1:11 PM
For those at AGU - stop by my poster this morning to learn about current state of climate game we have been developing over the past two years with a team of all-star interns. Game builds on IPCC SYR Figure SPM.1 to allow unique cooperation across time and space. Education section poster ED31B-2244
Here’s three generations of my family made in the Climate Legacies tool on Google Chrome - I’d love to see the versions you make at svs.gsfc.nasa.gov/webapps/clim...!

November 19, 2024 at 7:03 PM
Here’s three generations of my family made in the Climate Legacies tool on Google Chrome - I’d love to see the versions you make at svs.gsfc.nasa.gov/webapps/clim...!
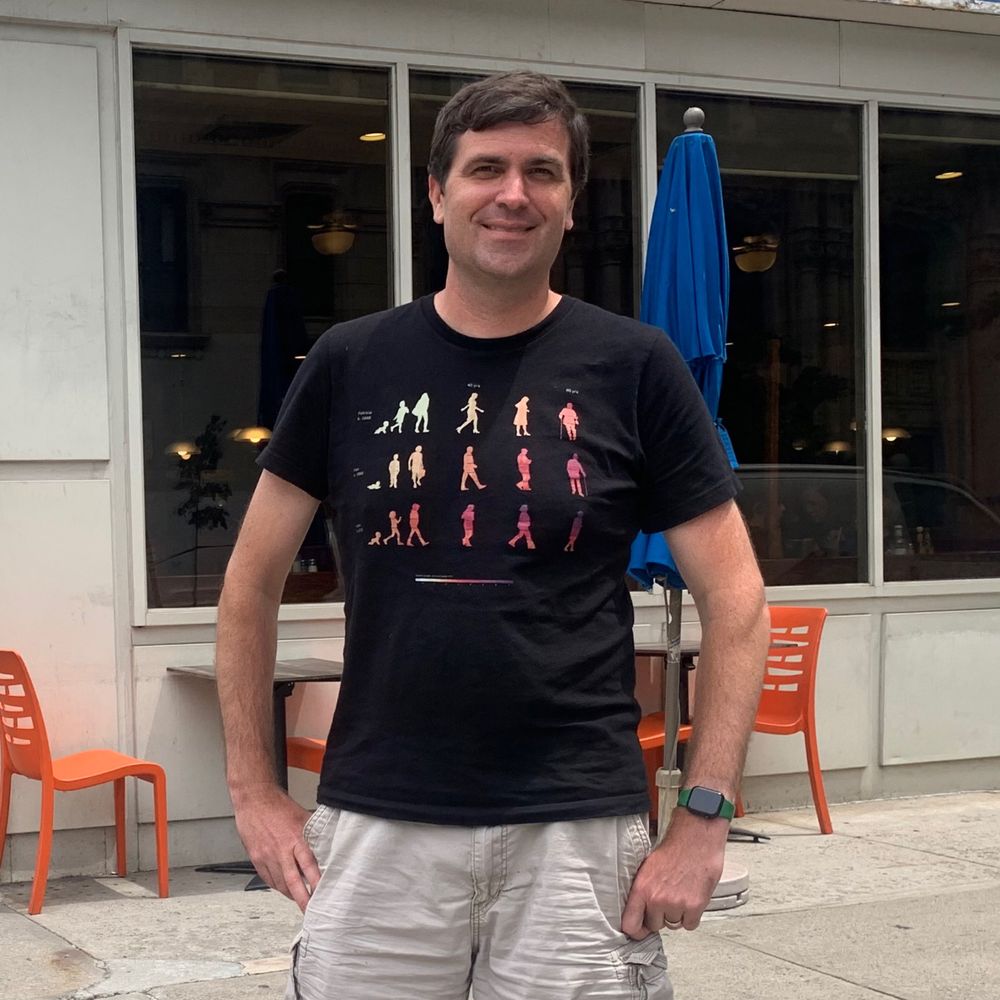
The button in the top-right allows images to be exported to post on Twitter/X, print out, or upload to one of the many websites that will place images on a mug or mousepad. I made mine into a T-shirt that is a great conversation starter. Any other ideas for these graphics?

June 21, 2024 at 5:54 PM
The button in the top-right allows images to be exported to post on Twitter/X, print out, or upload to one of the many websites that will place images on a mug or mousepad. I made mine into a T-shirt that is a great conversation starter. Any other ideas for these graphics?
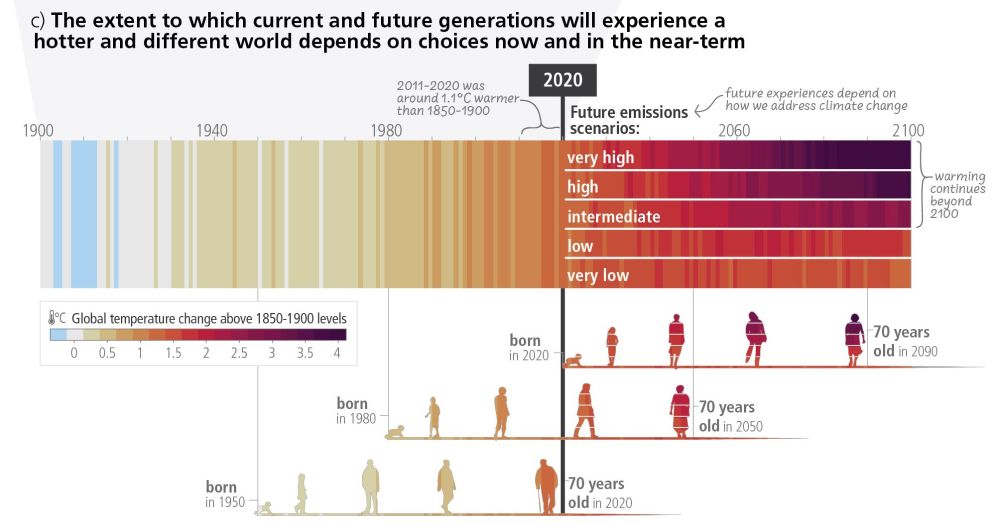
You can then click upper-left button to switch to a view aligning the icons by age, showing how one generation's climate experience compares to another's at each age. This helps us explore how we are perceiving climate change differently and the role of uncertainty in our future

June 21, 2024 at 5:53 PM
You can then click upper-left button to switch to a view aligning the icons by age, showing how one generation's climate experience compares to another's at each age. This helps us explore how we are perceiving climate change differently and the role of uncertainty in our future
You can then click each icon to customize it to better represent each person. For example, I played a lot of baseball as a kid and now love running and gardening; my son is a soccer player; I can represent those in my graphic showing 3 generations of my family:

June 21, 2024 at 5:52 PM
You can then click each icon to customize it to better represent each person. For example, I played a lot of baseball as a kid and now love running and gardening; my son is a soccer player; I can represent those in my graphic showing 3 generations of my family:
In our study we only looked at yield changes out to GWL reached by all climate models in 21st century SSP-RCP8.5 (3.5C, denoted by star on dotted line in left panels). Beyond this point the more pessimistic (low CO2) models are over represented. 11/12

April 13, 2024 at 3:42 PM
In our study we only looked at yield changes out to GWL reached by all climate models in 21st century SSP-RCP8.5 (3.5C, denoted by star on dotted line in left panels). Beyond this point the more pessimistic (low CO2) models are over represented. 11/12
In our study we noted that this leads to big differences in CO2 concentrations associated with higher GWL. For example, at the 3C GWL the 5 GCMs had a CO2 concentration range of 525-745 ppm. Models with high TCR had lower CO2, and thus lower yields. 8/12

April 13, 2024 at 3:40 PM
In our study we noted that this leads to big differences in CO2 concentrations associated with higher GWL. For example, at the 3C GWL the 5 GCMs had a CO2 concentration range of 525-745 ppm. Models with high TCR had lower CO2, and thus lower yields. 8/12
Our study characterizes the climate change response pattern for each regional system, as shown below for maize and wheat:

April 13, 2024 at 3:34 PM
Our study characterizes the climate change response pattern for each regional system, as shown below for maize and wheat:
Patterns of GWL response were characterized by crop production changes according to the ultimate direction of change (increase, neutral, decrease) and their linearity of change (consistent, peak, dip), leading to 9 combined patterns as stylized below:

April 13, 2024 at 3:32 PM
Patterns of GWL response were characterized by crop production changes according to the ultimate direction of change (increase, neutral, decrease) and their linearity of change (consistent, peak, dip), leading to 9 combined patterns as stylized below:
Building food system resilience is a key challenge in preparing our world for current and future climate changes. Many farmers are already seeing climate-driven trends impacting their farms, with benefits or losses depending on the region and farm system. 2/14

April 13, 2024 at 3:30 PM
Building food system resilience is a key challenge in preparing our world for current and future climate changes. Many farmers are already seeing climate-driven trends impacting their farms, with benefits or losses depending on the region and farm system. 2/14